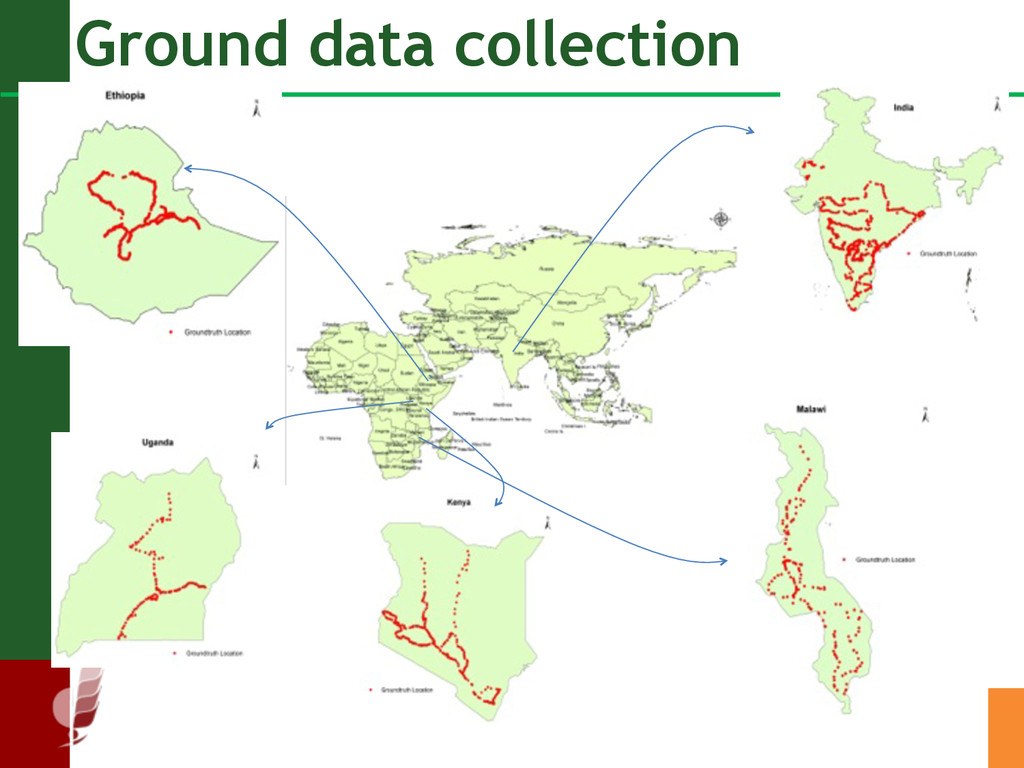
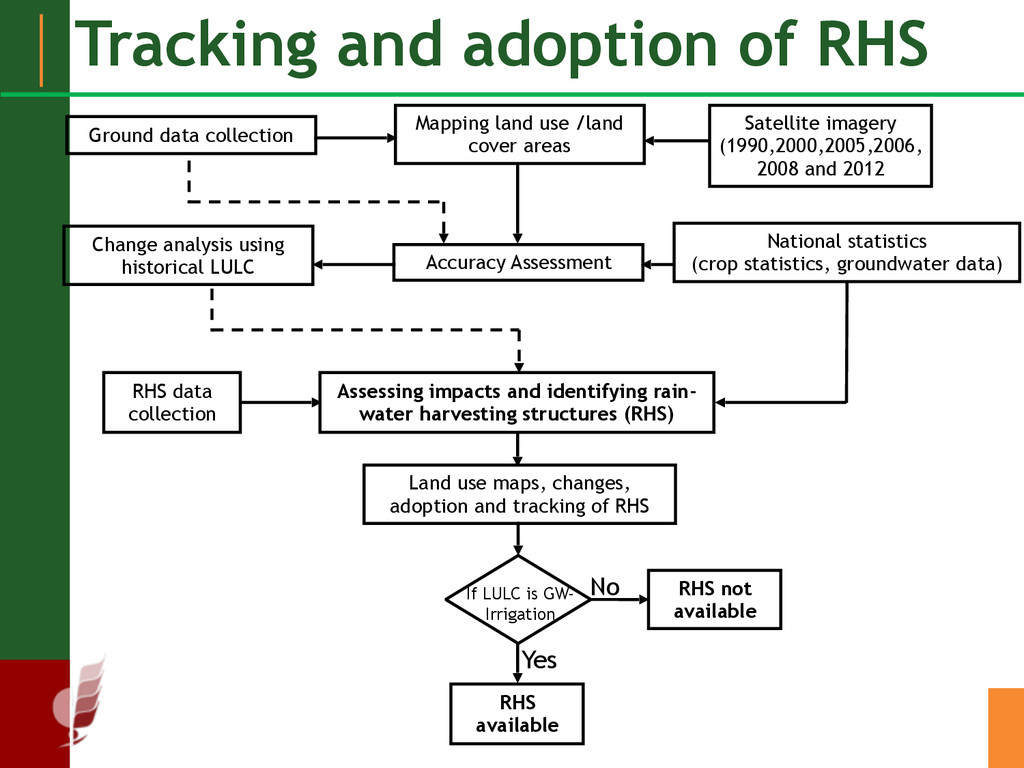
Ground data collection Yes No Satellite imagery (1990,2000,2005,2006, 2008 and 2012 National statistics (crop statistics, groundwater data) Mapping land use /land cover areas Land use maps, changes, adoption and tracking of RHS Accuracy Assessment Assessing impacts and identifying rain- water harvesting structures (RHS) RHS data collection If LULC is GW- Irrigation RHS available RHS not available
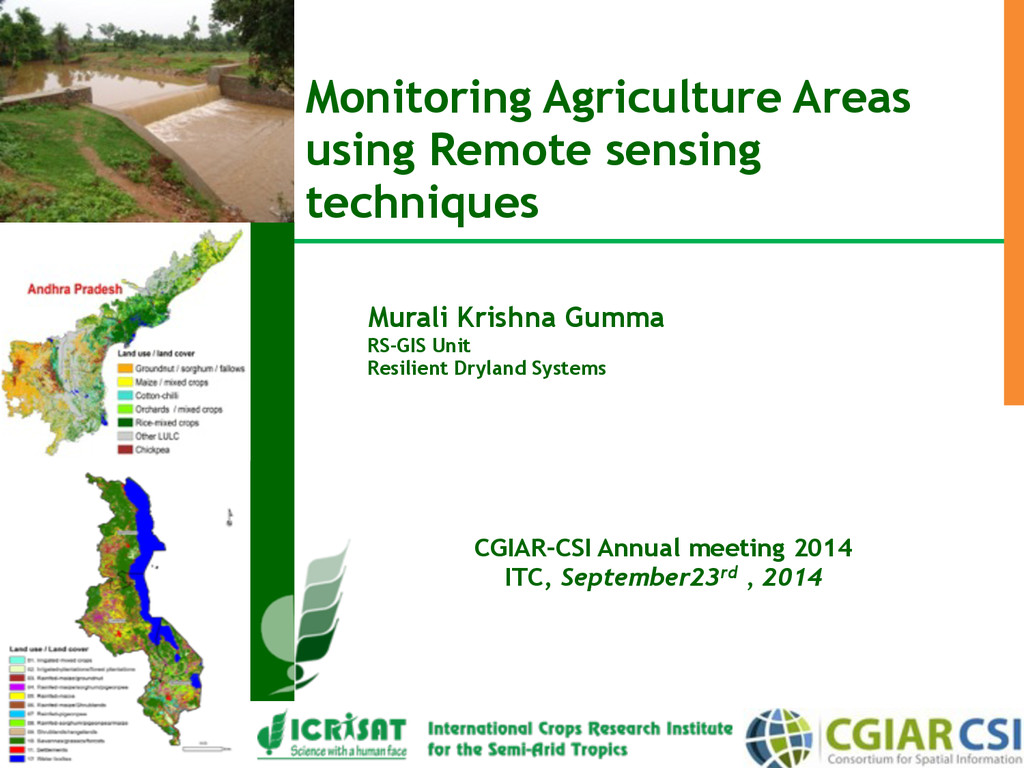
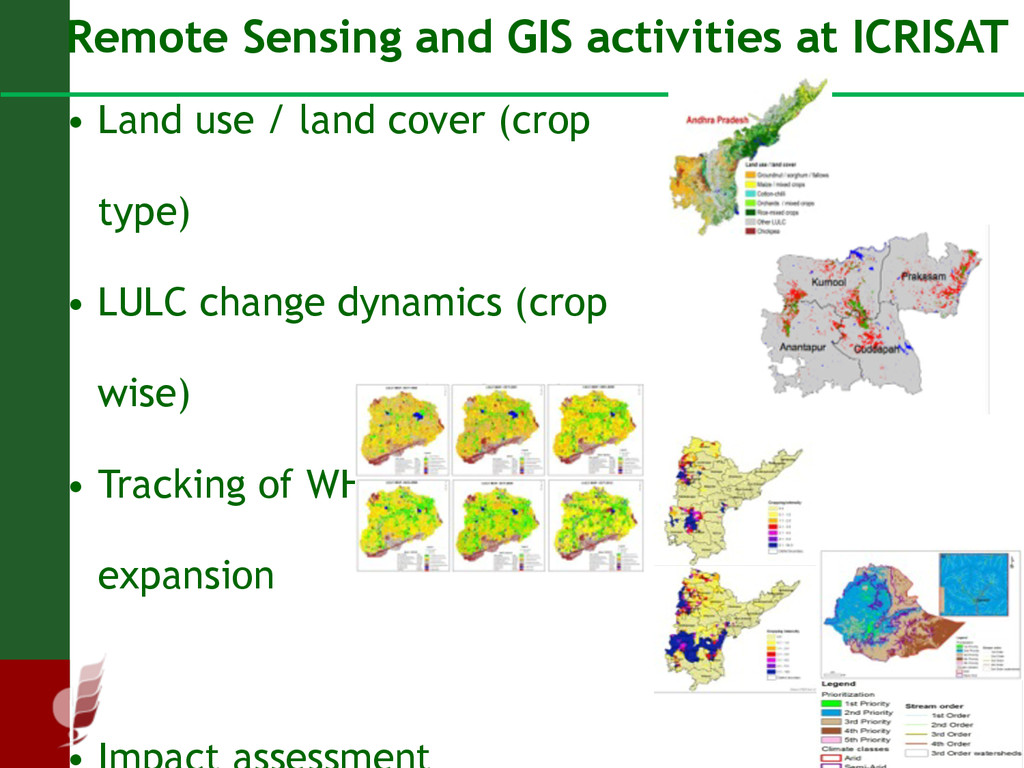
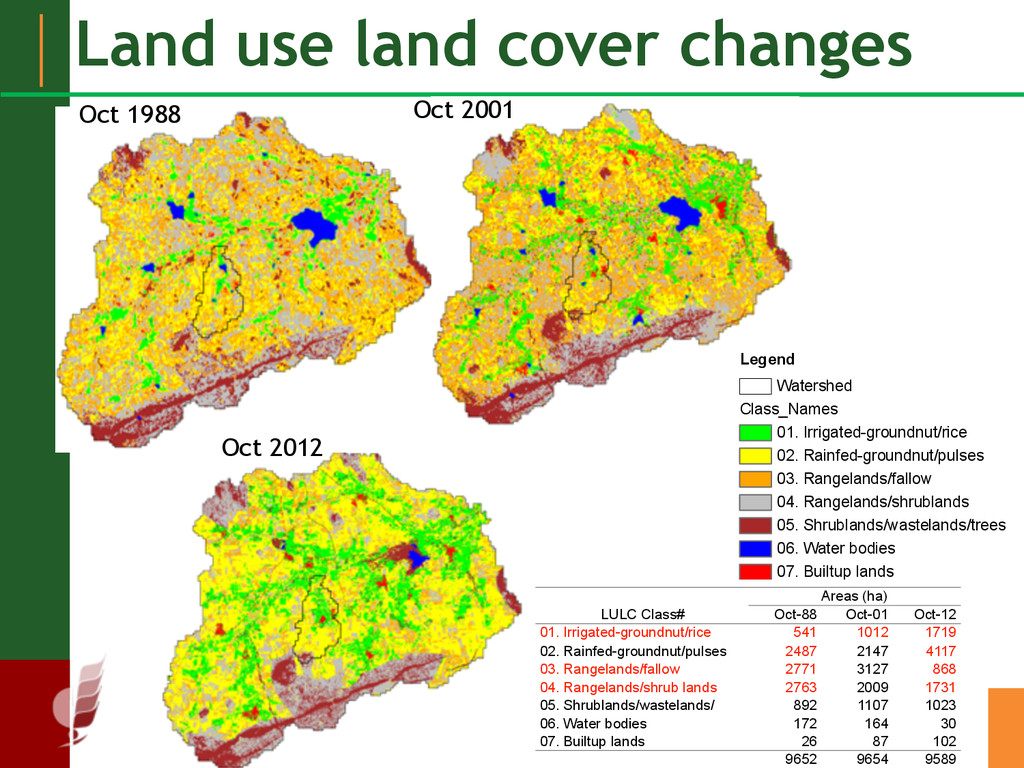
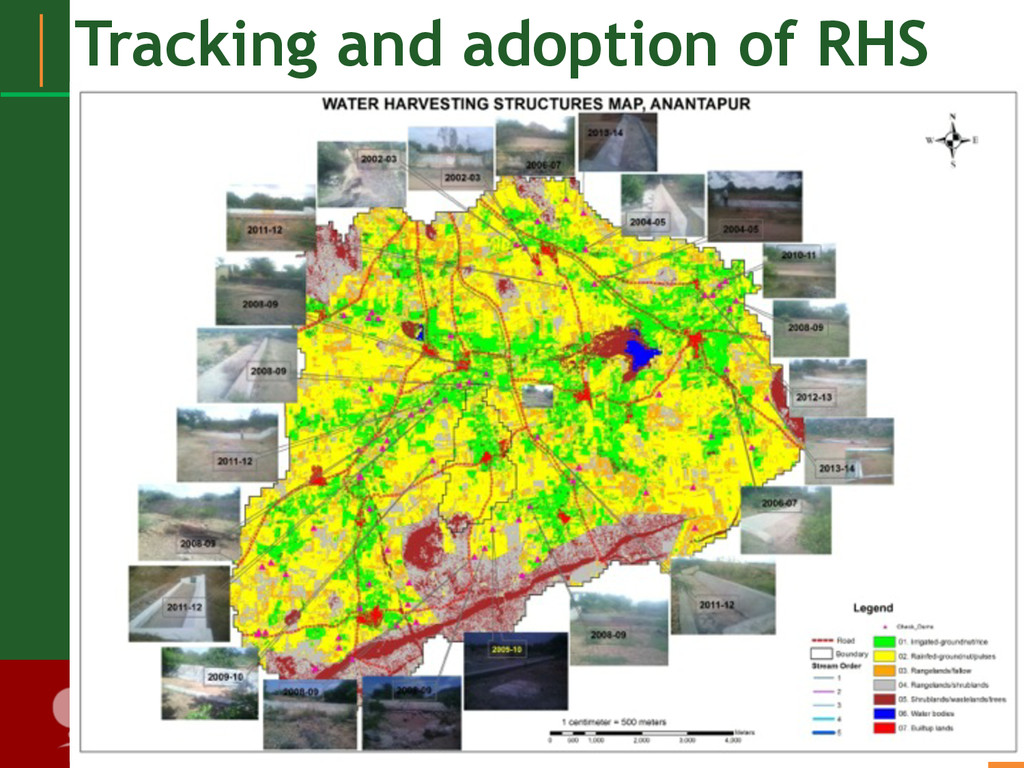
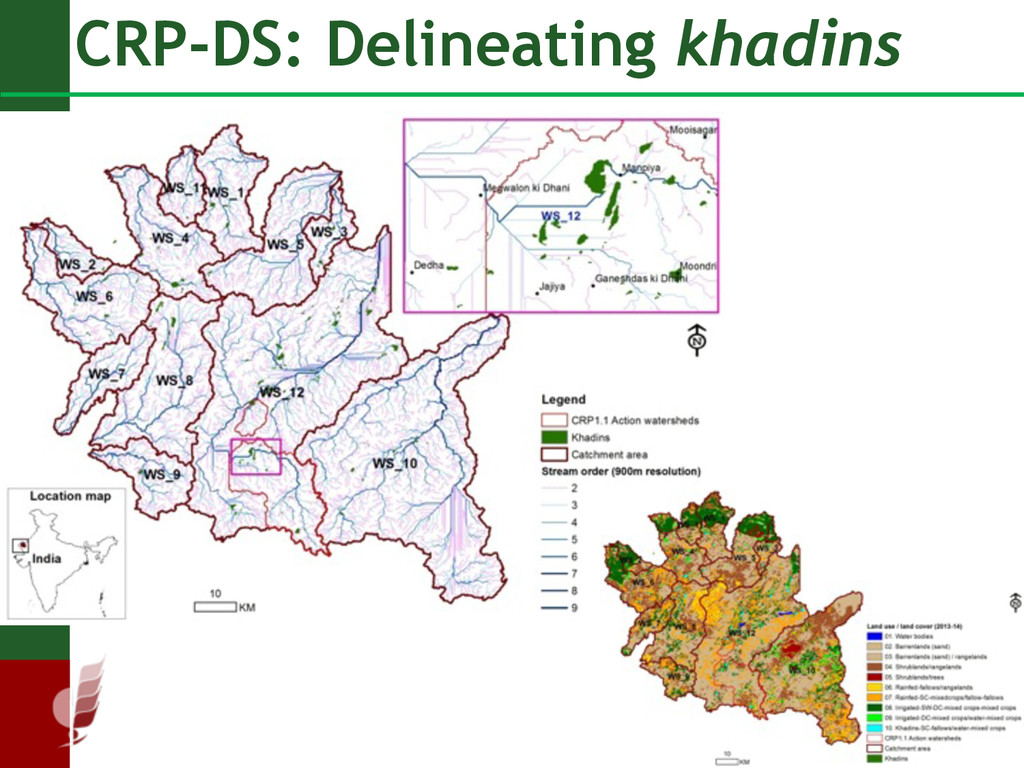
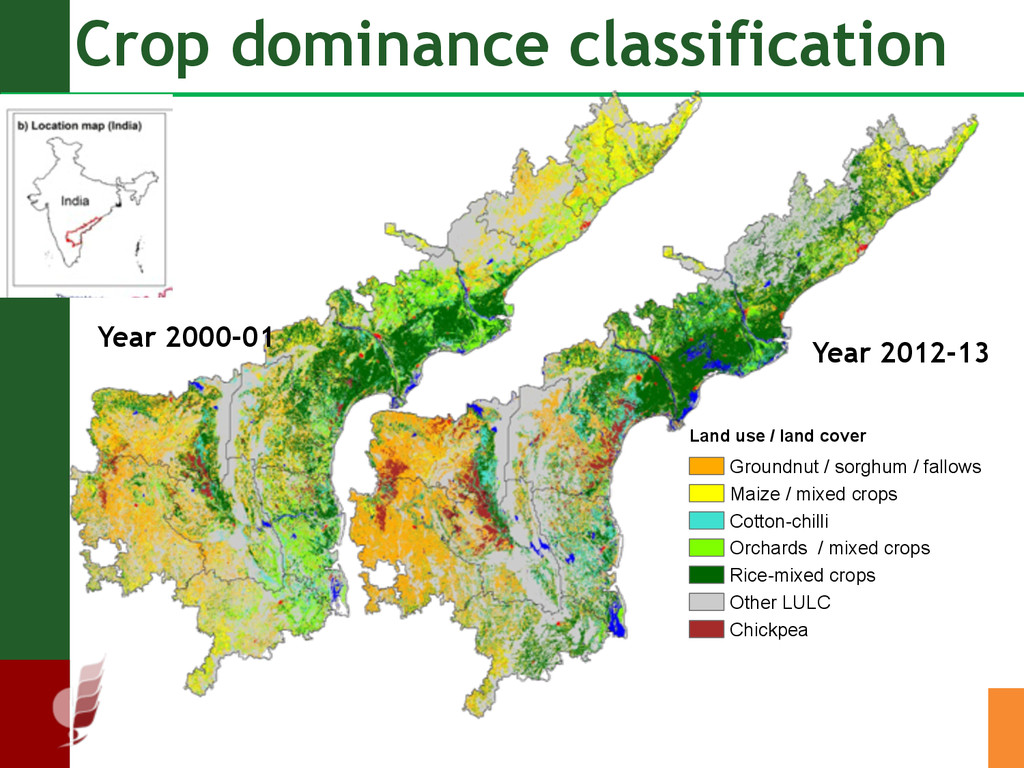
Landsat imagery and MODIS to prepare Land use/ Landover (LULC) maps and changes in LULC during selected years. ! • Data on source of irrigation before and after adoption of RHS identifies the relationship between RHS adoption and availability of groundwater for irrigation.
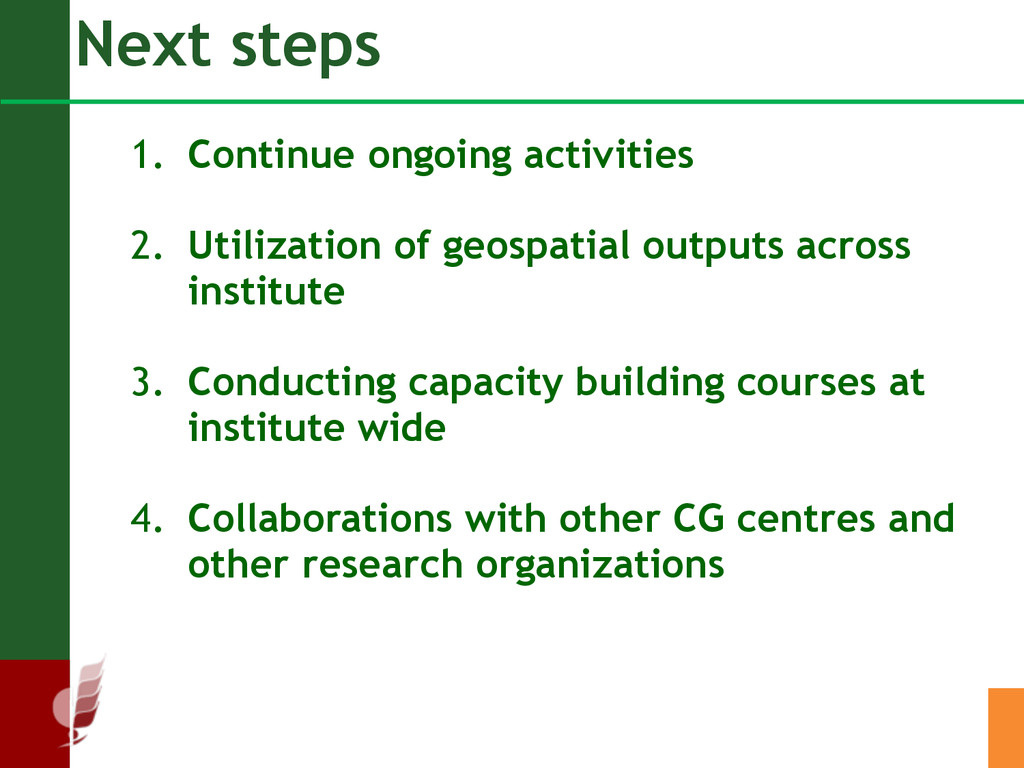
geospatial outputs across institute ! 3. Conducting capacity building courses at institute wide ! 4. Collaborations with other CG centres and other research organizations
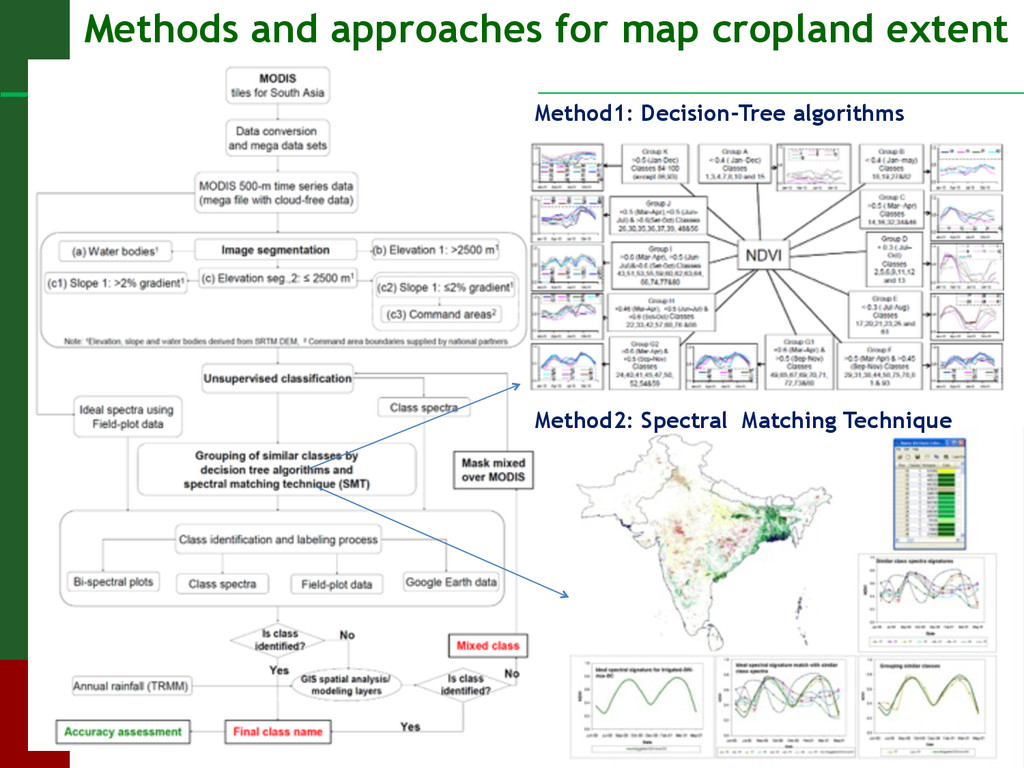
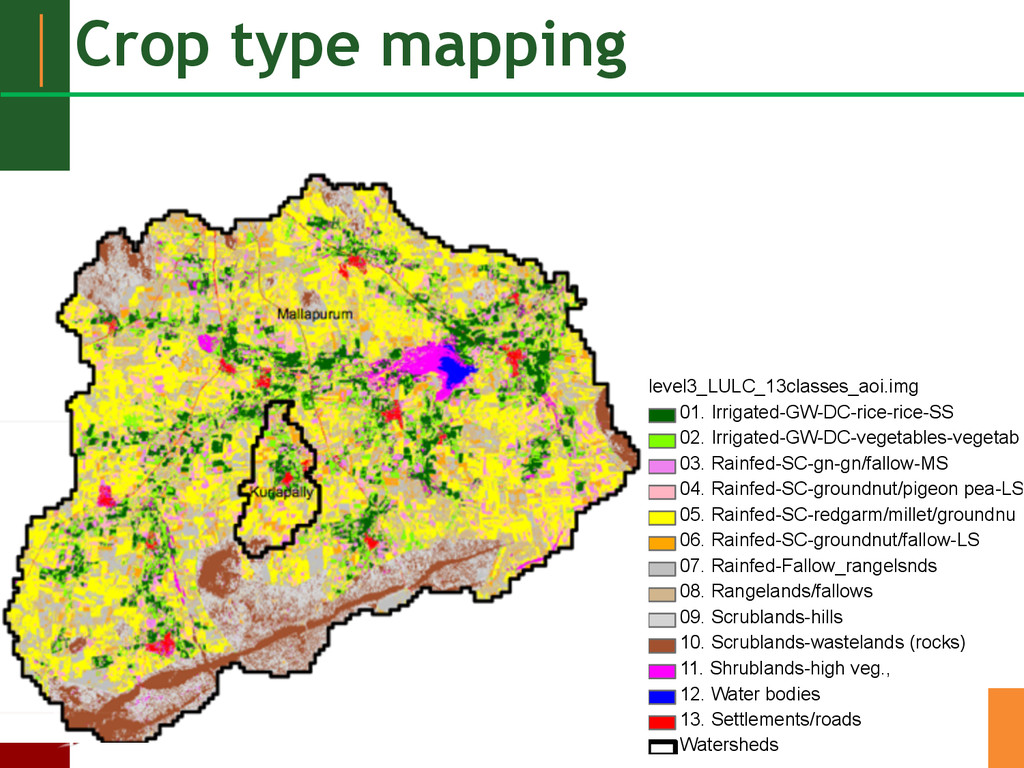
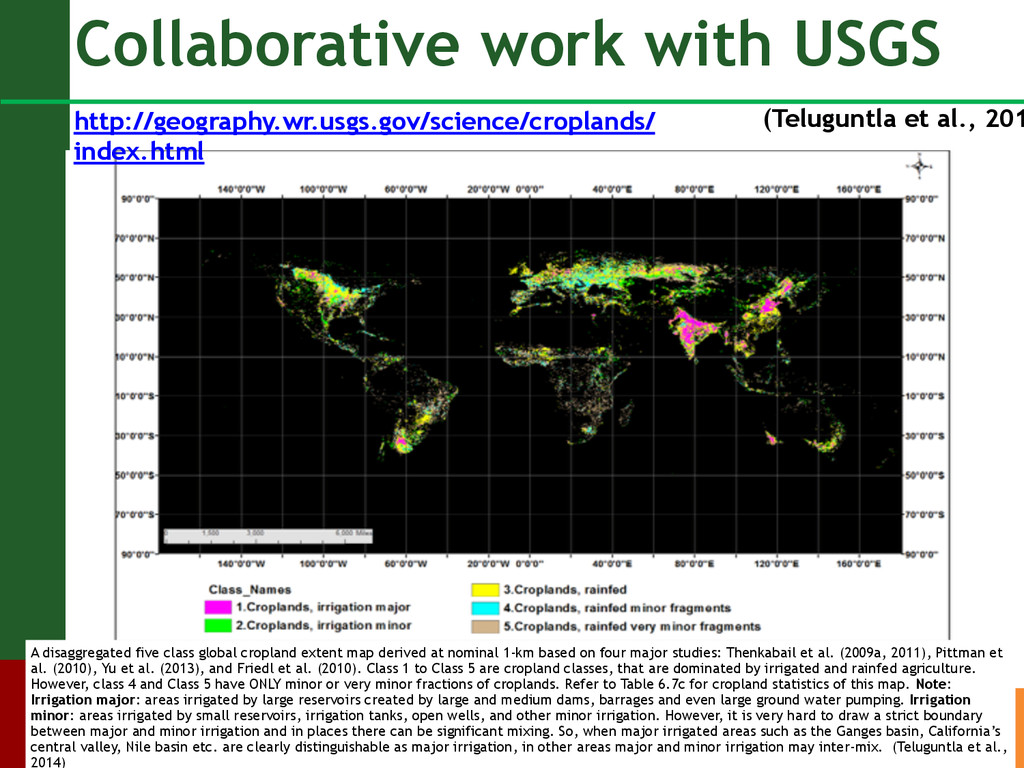
extent map derived at nominal 1-km based on four major studies: Thenkabail et al. (2009a, 2011), Pittman et al. (2010), Yu et al. (2013), and Friedl et al. (2010). Class 1 to Class 5 are cropland classes, that are dominated by irrigated and rainfed agriculture. However, class 4 and Class 5 have ONLY minor or very minor fractions of croplands. Refer to Table 6.7c for cropland statistics of this map. Note: Irrigation major: areas irrigated by large reservoirs created by large and medium dams, barrages and even large ground water pumping. Irrigation minor: areas irrigated by small reservoirs, irrigation tanks, open wells, and other minor irrigation. However, it is very hard to draw a strict boundary between major and minor irrigation and in places there can be significant mixing. So, when major irrigated areas such as the Ganges basin, California’s central valley, Nile basin etc. are clearly distinguishable as major irrigation, in other areas major and minor irrigation may inter-mix. (Teluguntla et al., 2014) (Teluguntla et al., 201 http://geography.wr.usgs.gov/science/croplands/ index.html