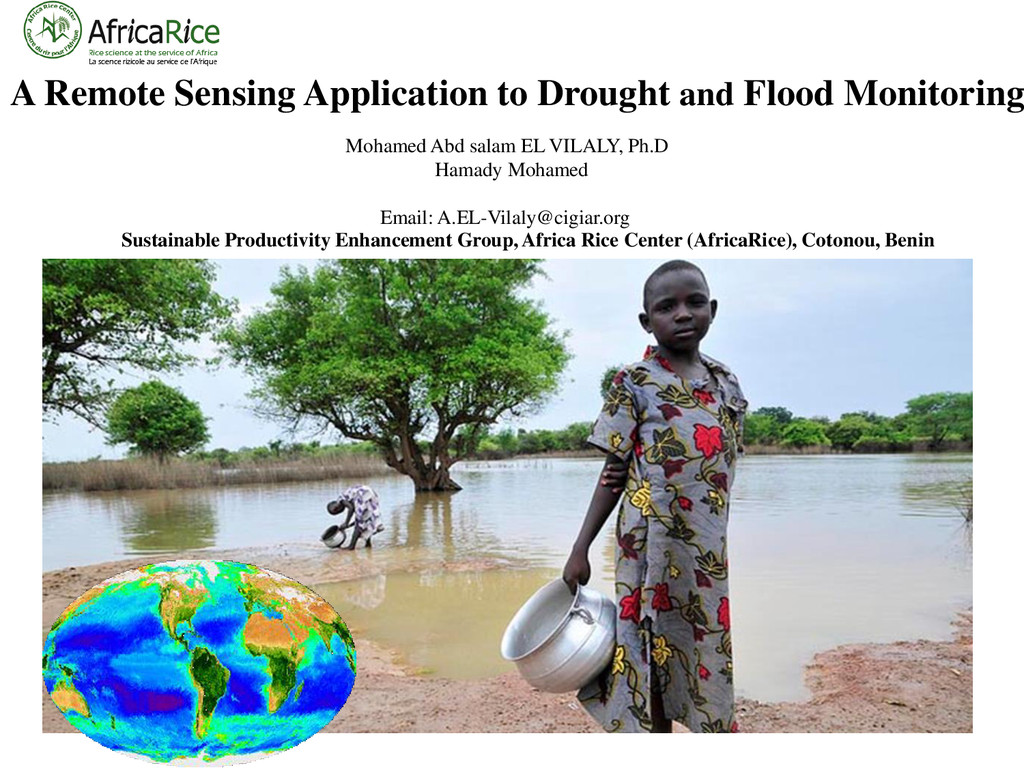
Abd salam EL VILALY, Ph.D Hamady Mohamed Email: [email protected] Sustainable Productivity Enhancement Group, Africa Rice Center (AfricaRice), Cotonou, Benin
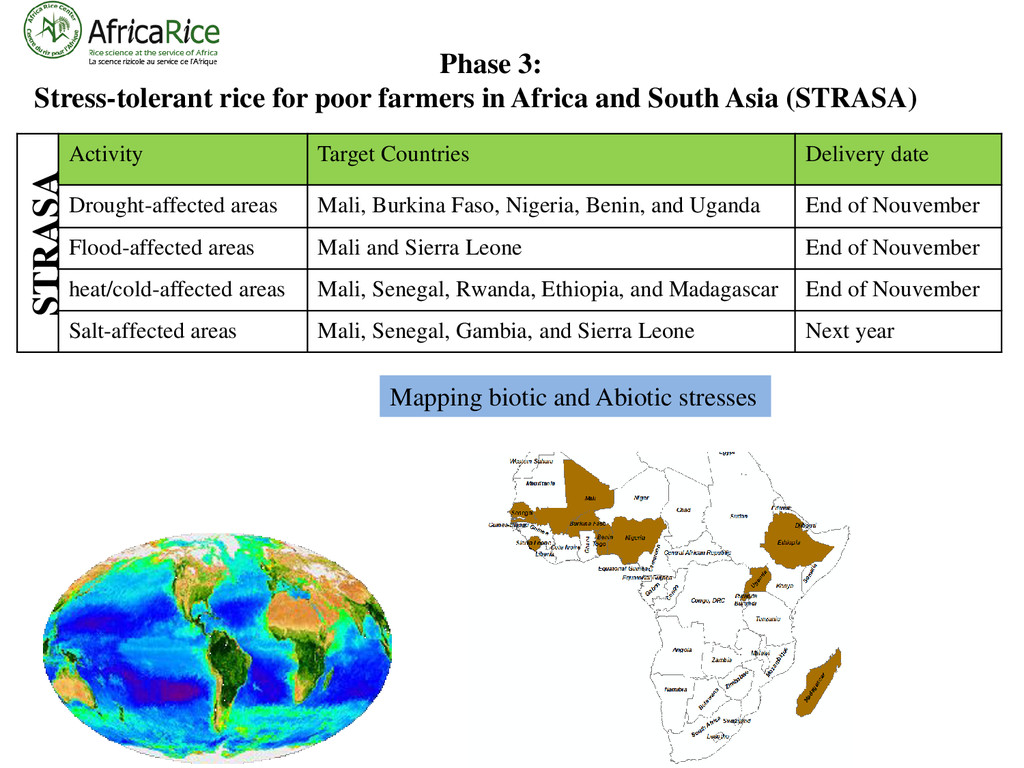
Nigeria, Benin, and Uganda End of Nouvember Flood-affected areas Mali and Sierra Leone End of Nouvember heat/cold-affected areas Mali, Senegal, Rwanda, Ethiopia, and Madagascar End of Nouvember Salt-affected areas Mali, Senegal, Gambia, and Sierra Leone Next year Phase 3: Stress-tolerant rice for poor farmers in Africa and South Asia (STRASA) STRASA Mapping biotic and Abiotic stresses
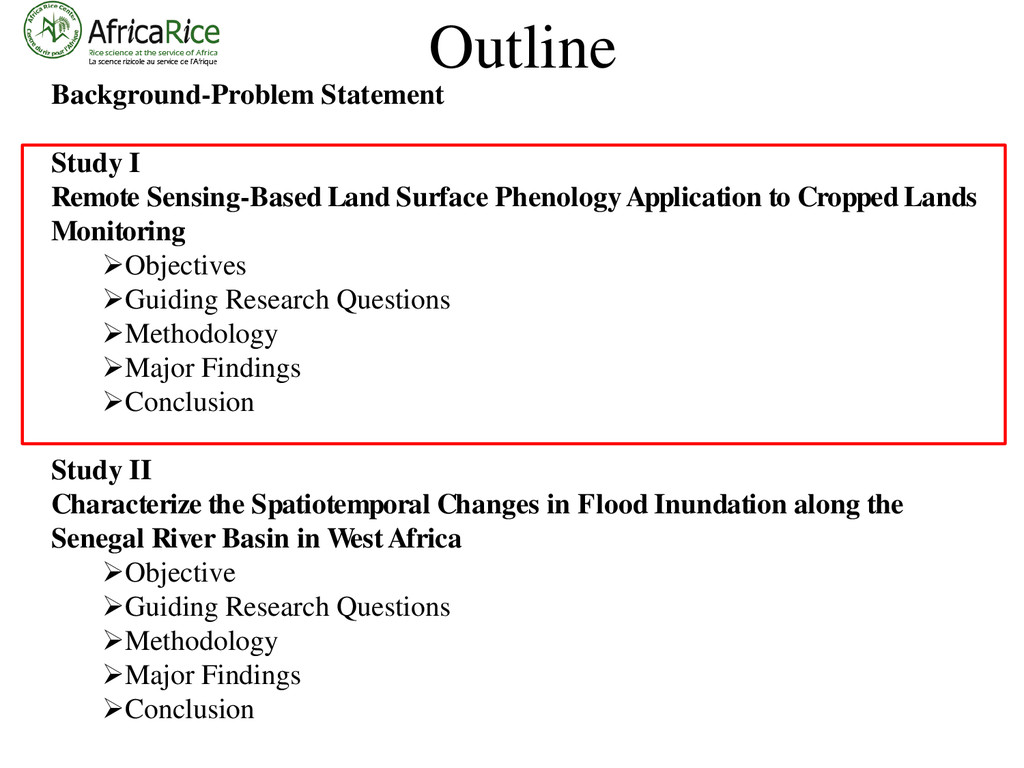
Application to Cropped Lands Monitoring Objectives Guiding Research Questions Methodology Major Findings Conclusion Study II Characterize the Spatiotemporal Changes in Flood Inundation along the Senegal River Basin in West Africa Objective Guiding Research Questions Methodology Major Findings Conclusion
countries. In Africa, a third of the people already live in drought-affected areas. Increasing concern that changes in climate are leading to an increase in the frequency and severity of droughts. https://www2.ucar.edu/atmosnews/news/2904/climate-change-drought-may- threaten-much-globe-within-decades Natural phenomenon and normal part of the climate Impacts all regions regardless of how arid or humid they are Complex phenomenon and one of the least understood. Develops slowly, difficult to detect and predict. 1900-2004, more than 807 droughts 11 million people lost their lives Second most geographically widespread hazard after floods FAO, 1997
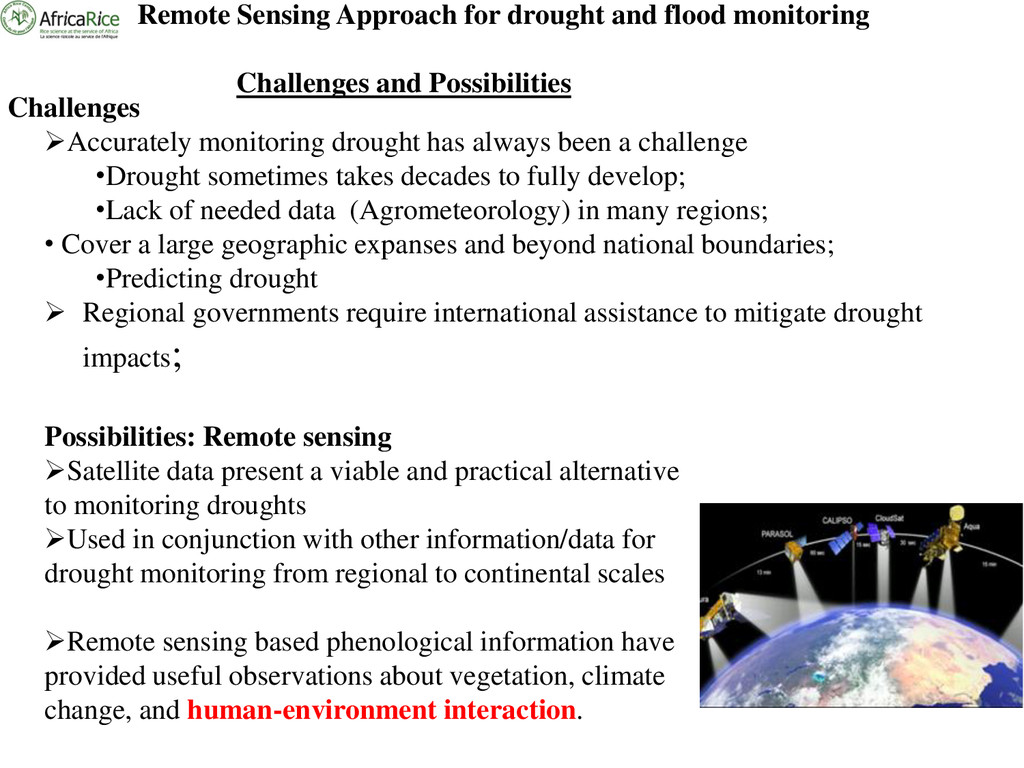
Possibilities Possibilities: Remote sensing Satellite data present a viable and practical alternative to monitoring droughts Used in conjunction with other information/data for drought monitoring from regional to continental scales Remote sensing based phenological information have provided useful observations about vegetation, climate change, and human-environment interaction. Challenges Accurately monitoring drought has always been a challenge •Drought sometimes takes decades to fully develop; •Lack of needed data (Agrometeorology) in many regions; • Cover a large geographic expanses and beyond national boundaries; •Predicting drought Regional governments require international assistance to mitigate drought impacts;
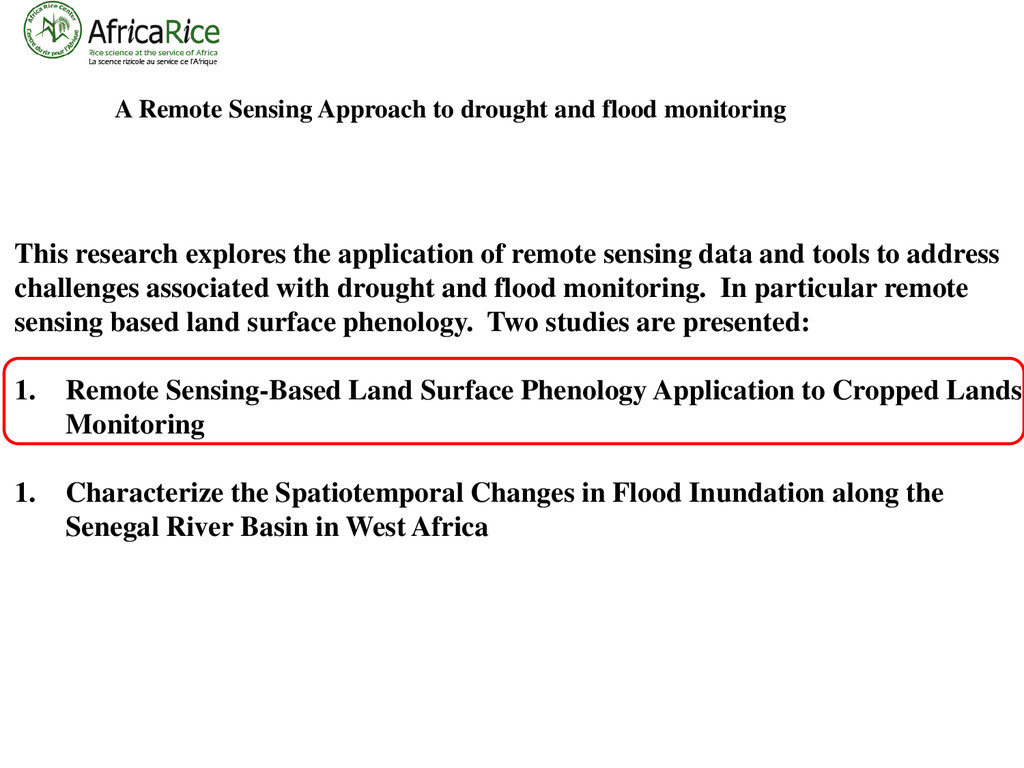
research explores the application of remote sensing data and tools to address challenges associated with drought and flood monitoring. In particular remote sensing based land surface phenology. Two studies are presented: 1. Remote Sensing-Based Land Surface Phenology Application to Cropped Lands Monitoring 1. Characterize the Spatiotemporal Changes in Flood Inundation along the Senegal River Basin in West Africa
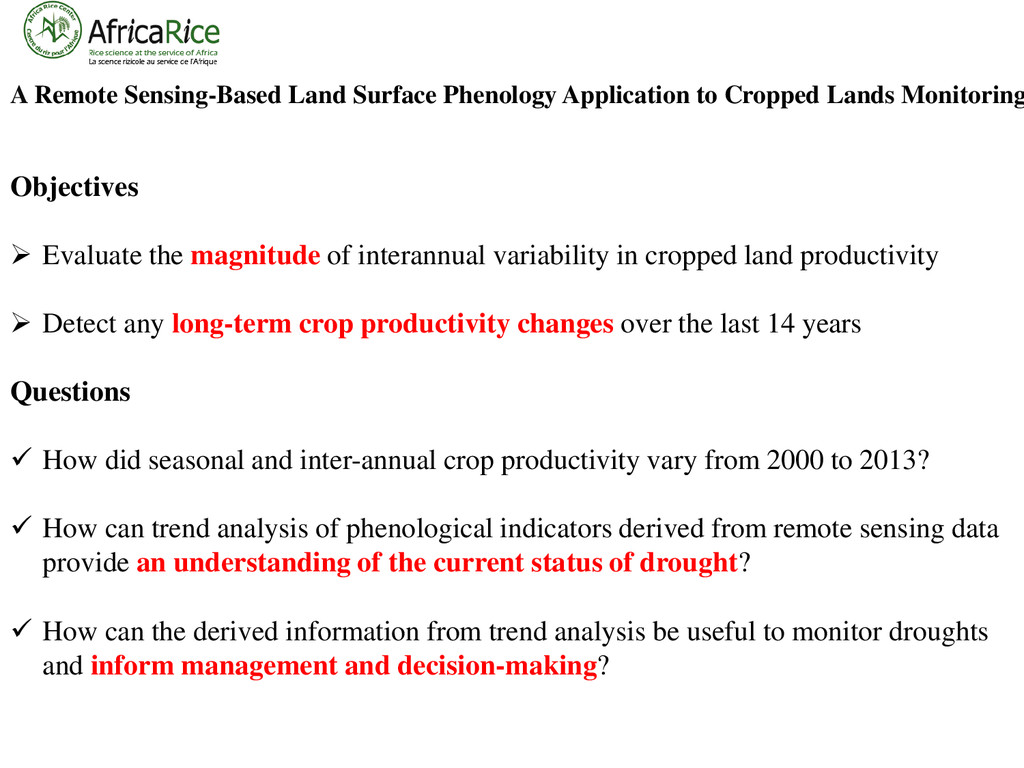
land productivity Detect any long-term crop productivity changes over the last 14 years Questions How did seasonal and inter-annual crop productivity vary from 2000 to 2013? How can trend analysis of phenological indicators derived from remote sensing data provide an understanding of the current status of drought? How can the derived information from trend analysis be useful to monitor droughts and inform management and decision-making? A Remote Sensing-Based Land Surface Phenology Application to Cropped Lands Monitoring
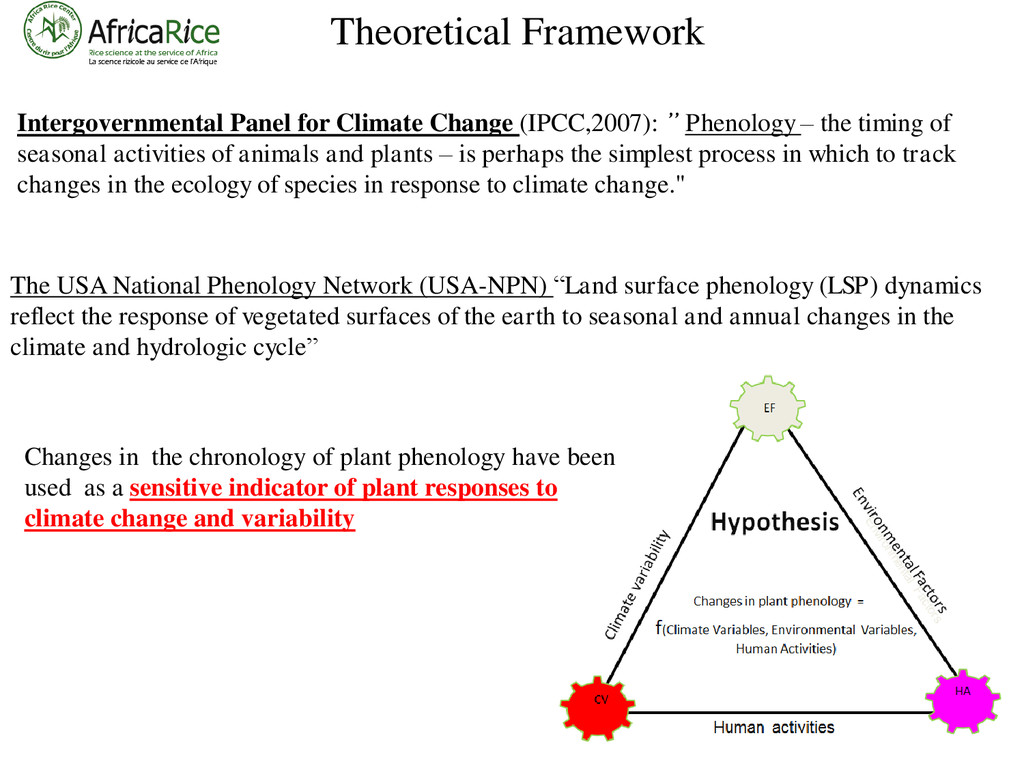
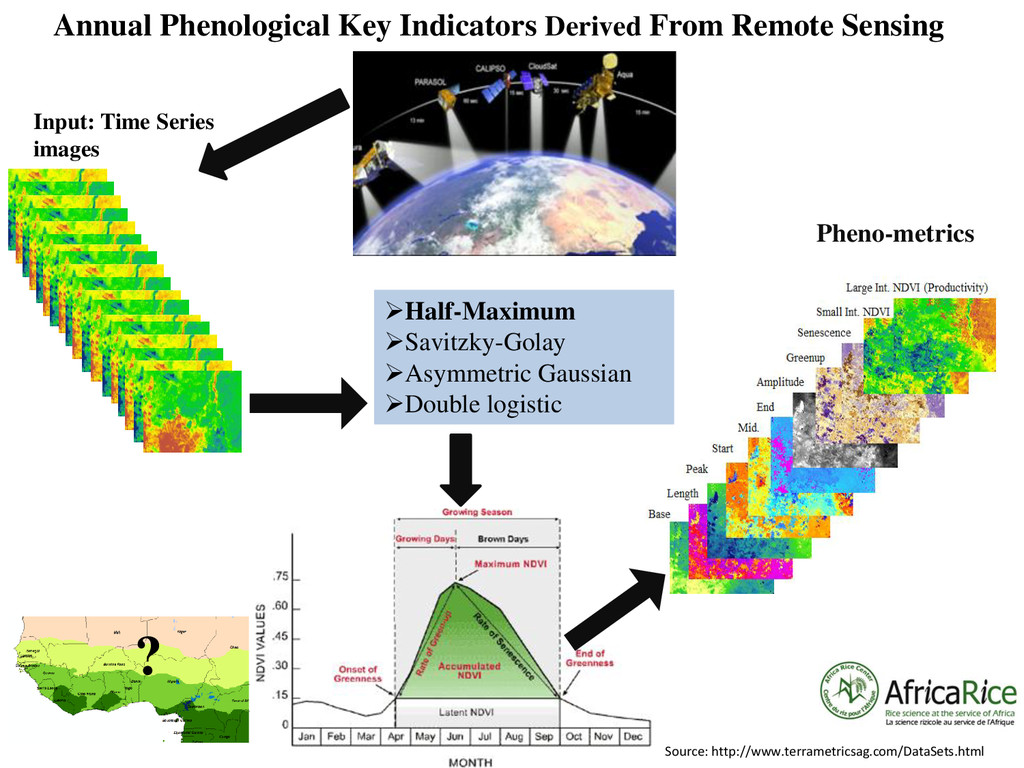
– the timing of seasonal activities of animals and plants – is perhaps the simplest process in which to track changes in the ecology of species in response to climate change." The USA National Phenology Network (USA-NPN) “Land surface phenology (LSP) dynamics reflect the response of vegetated surfaces of the earth to seasonal and annual changes in the climate and hydrologic cycle” Changes in the chronology of plant phenology have been used as a sensitive indicator of plant responses to climate change and variability
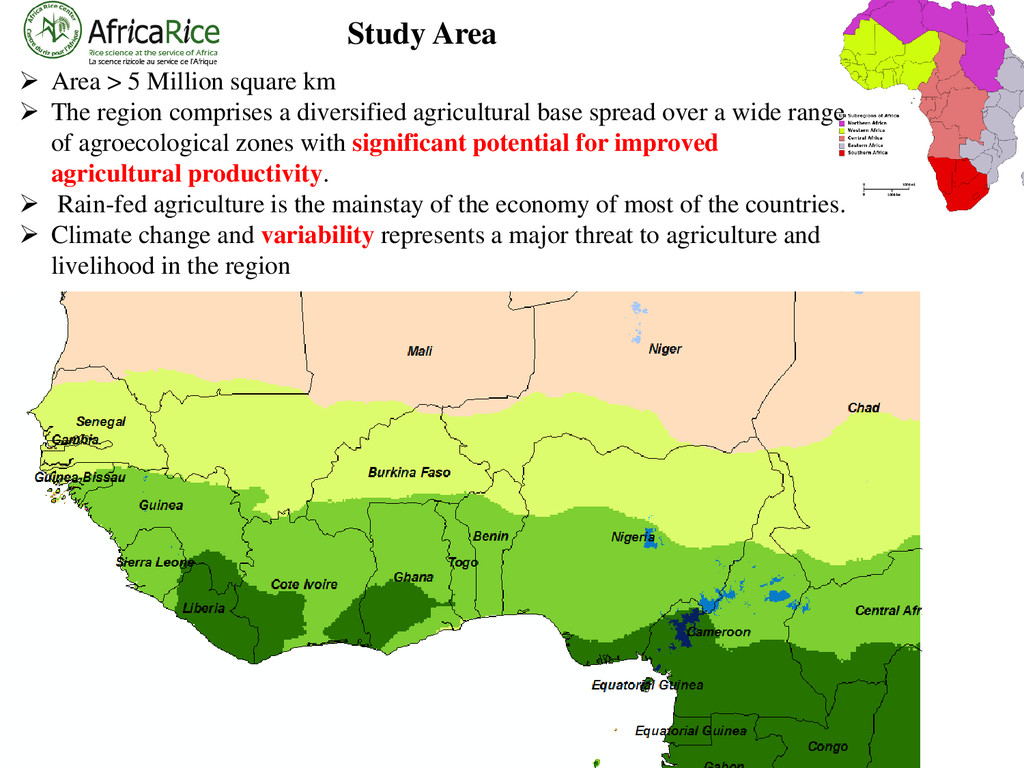
The region comprises a diversified agricultural base spread over a wide range of agroecological zones with significant potential for improved agricultural productivity. Rain-fed agriculture is the mainstay of the economy of most of the countries. Climate change and variability represents a major threat to agriculture and livelihood in the region
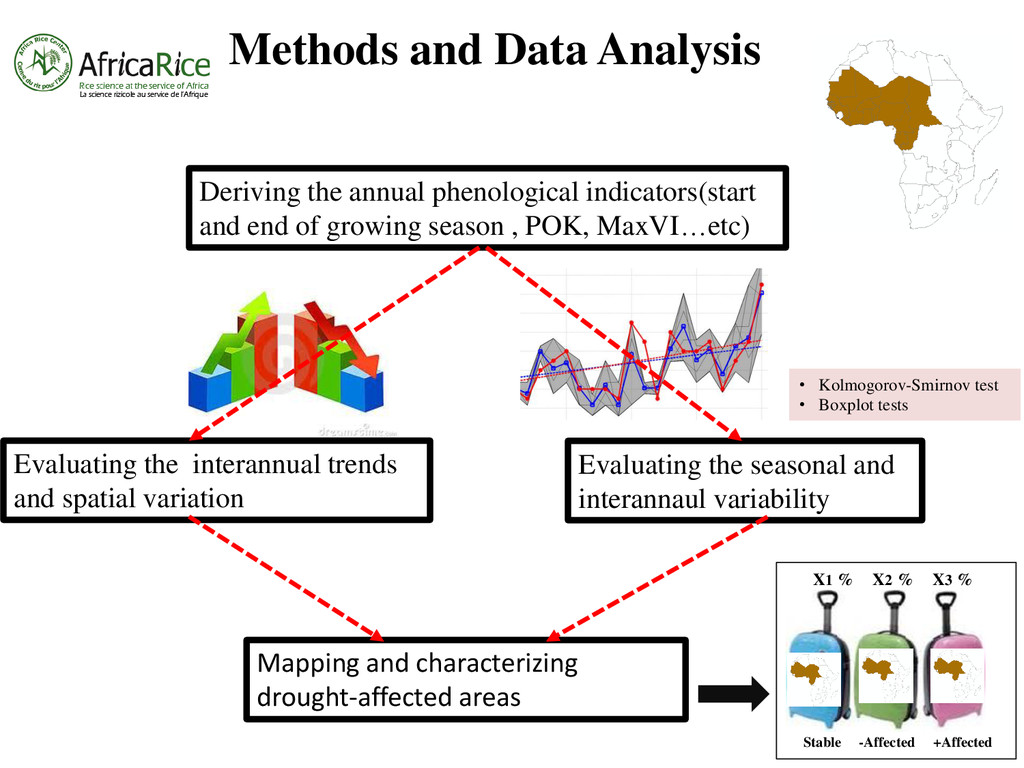
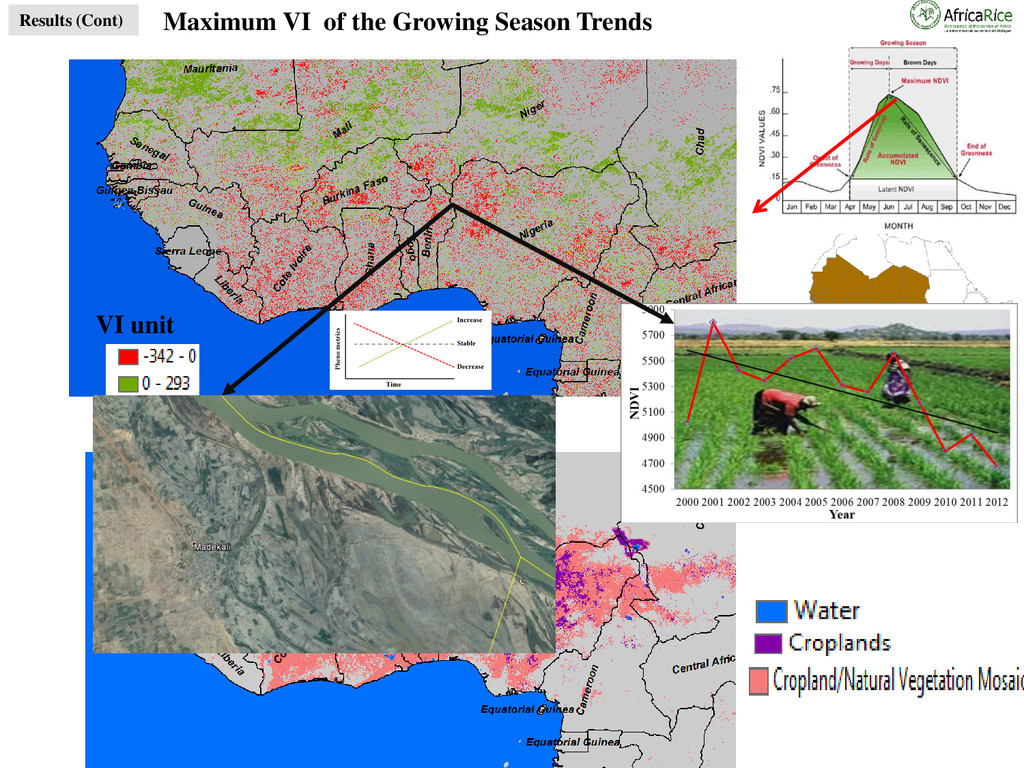
variation Evaluating the seasonal and interannaul variability Deriving the annual phenological indicators(start and end of growing season , POK, MaxVI…etc) Mapping and characterizing drought-affected areas X1 % X2 % X3 % Stable -Affected +Affected • Kolmogorov-Smirnov test • Boxplot tests
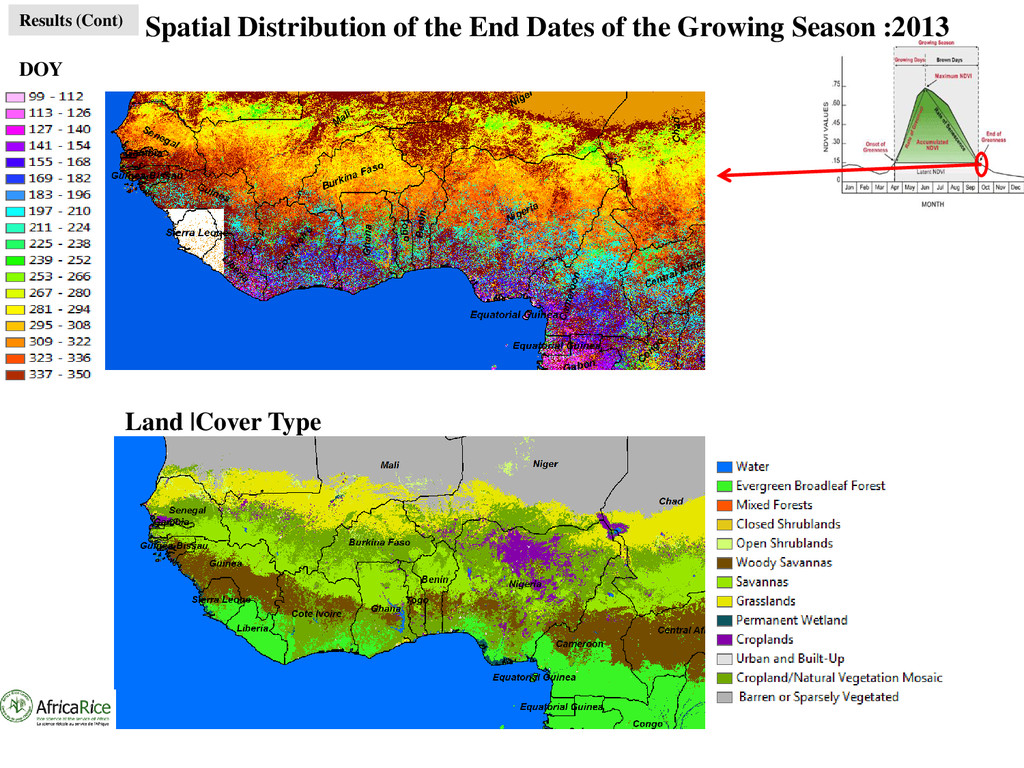
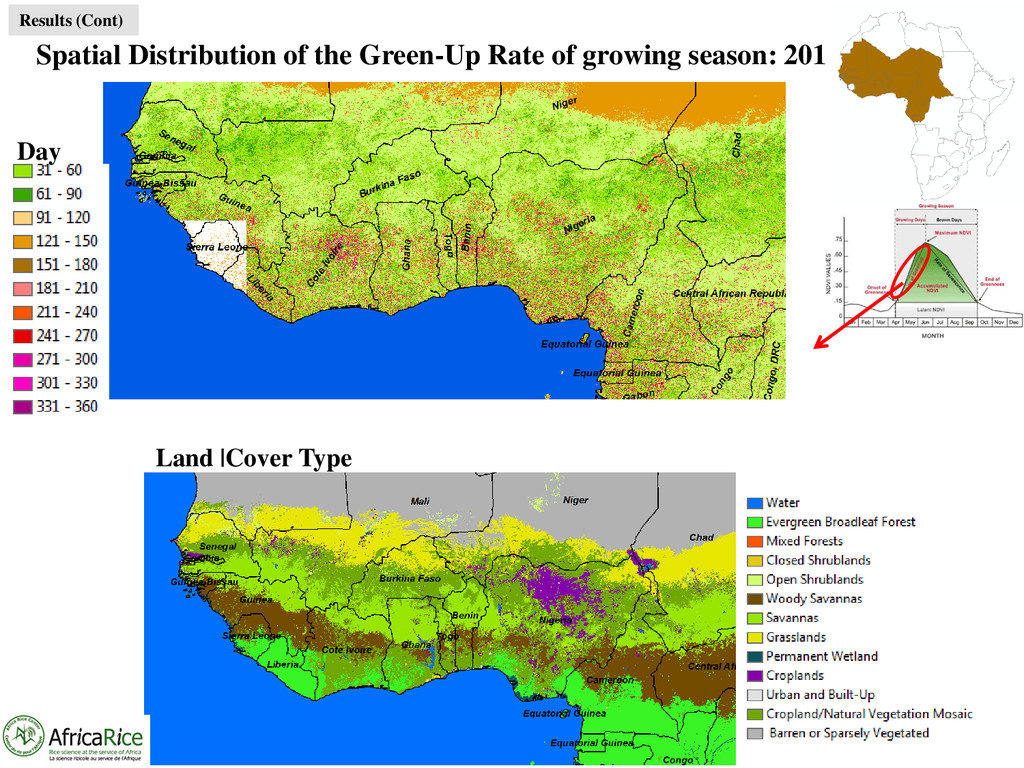
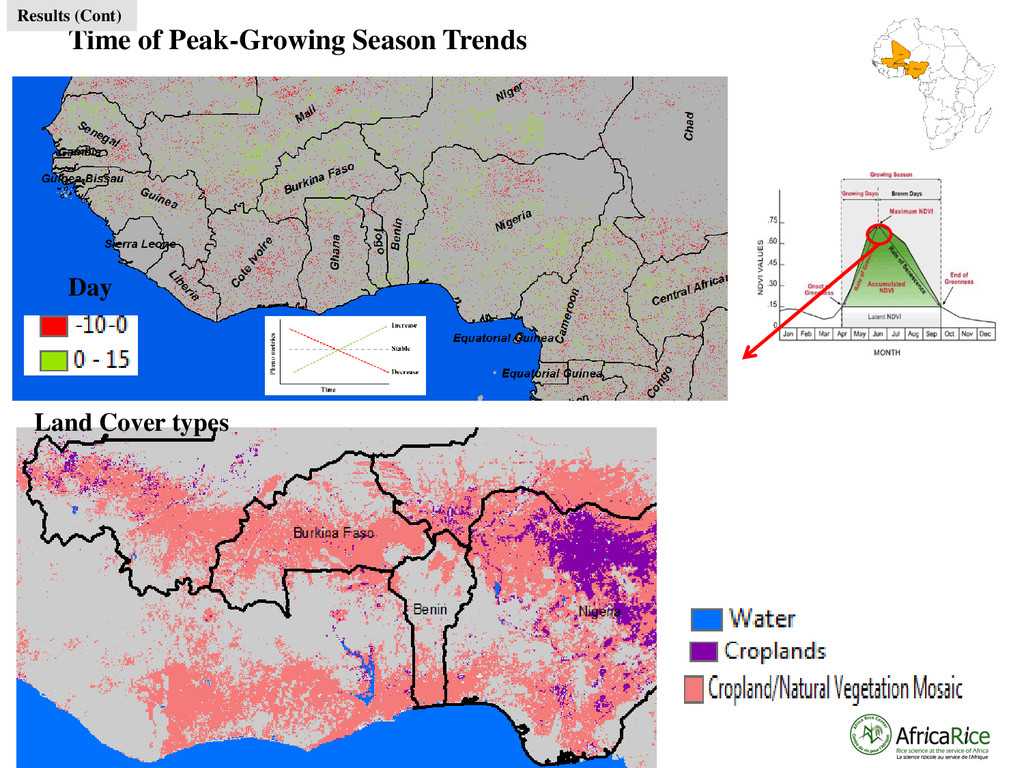
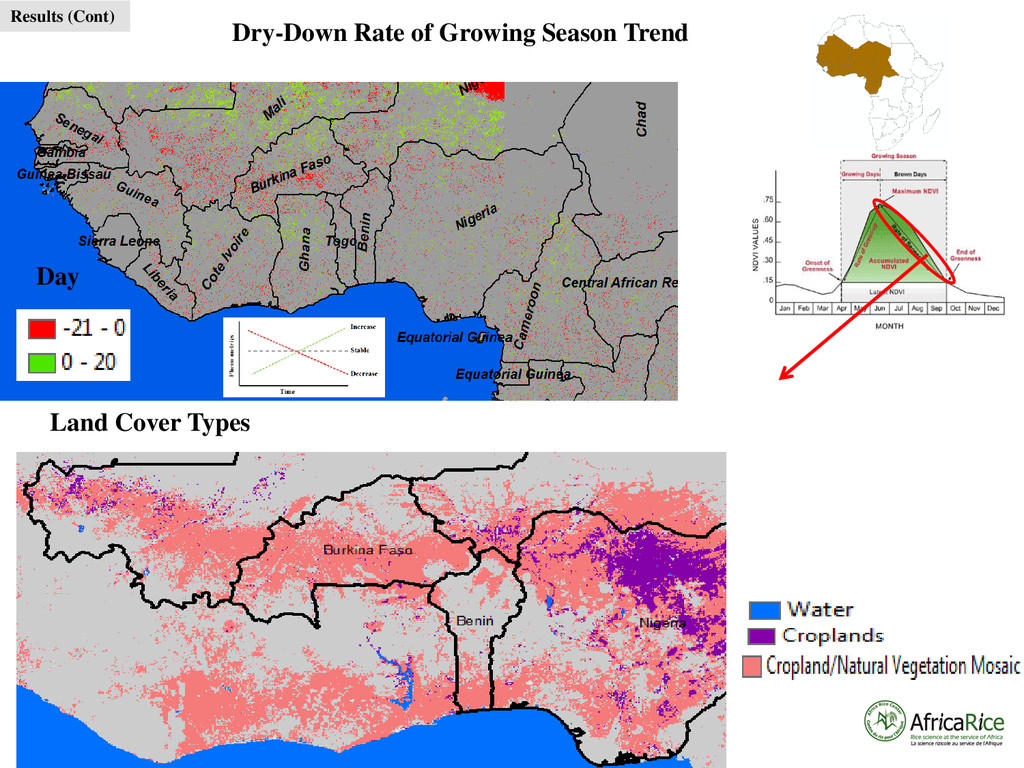
Season:2013 The start of growing season is generally function of precipitation, elevation gradient, and agro-ecological zones . Land |Cover Type 150 160 170 180 190 200 2001 2002 2003 2004 2005 2006 2007 2008 2009 2010 2011 2012 2013 DOY Year Results
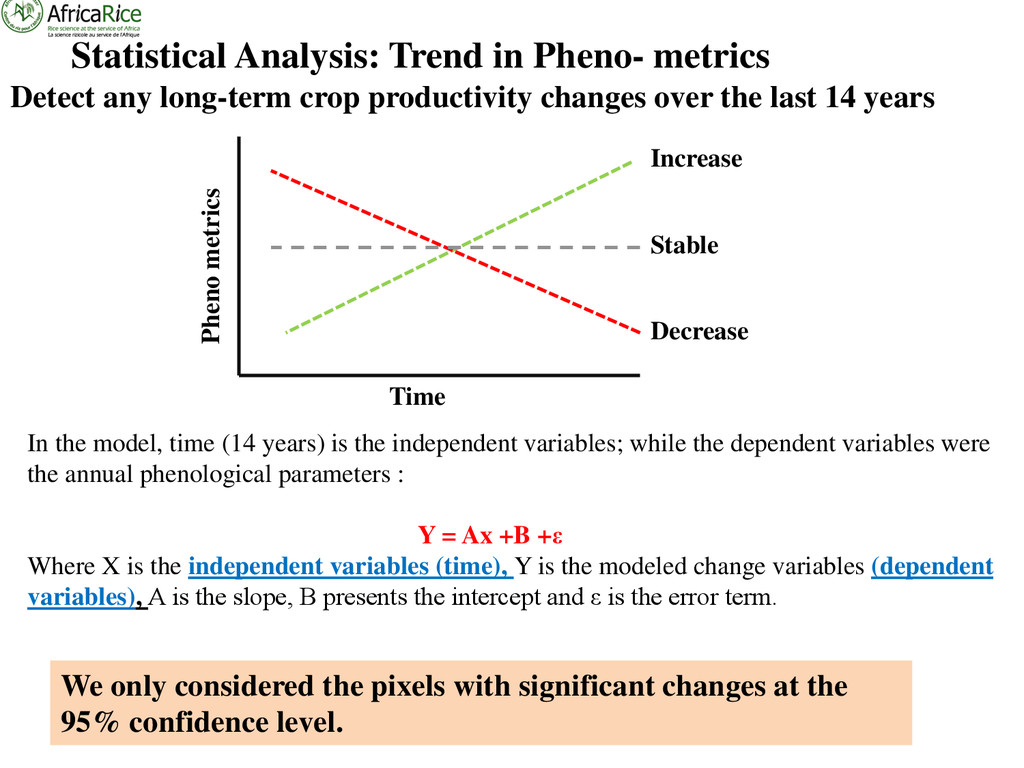
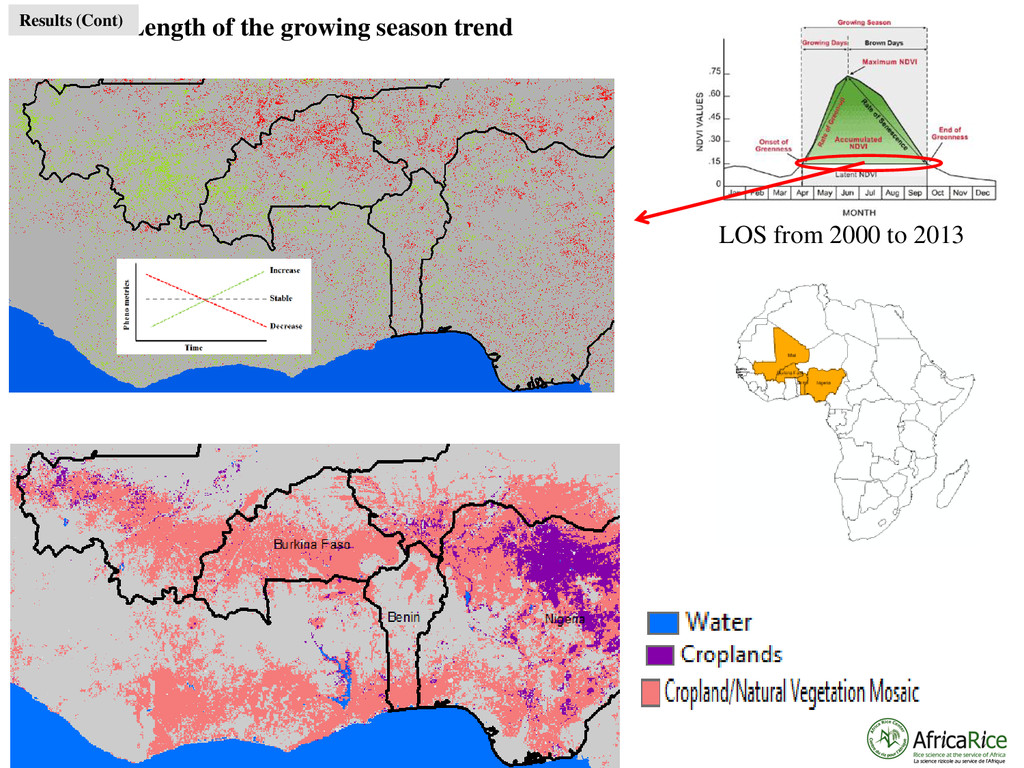
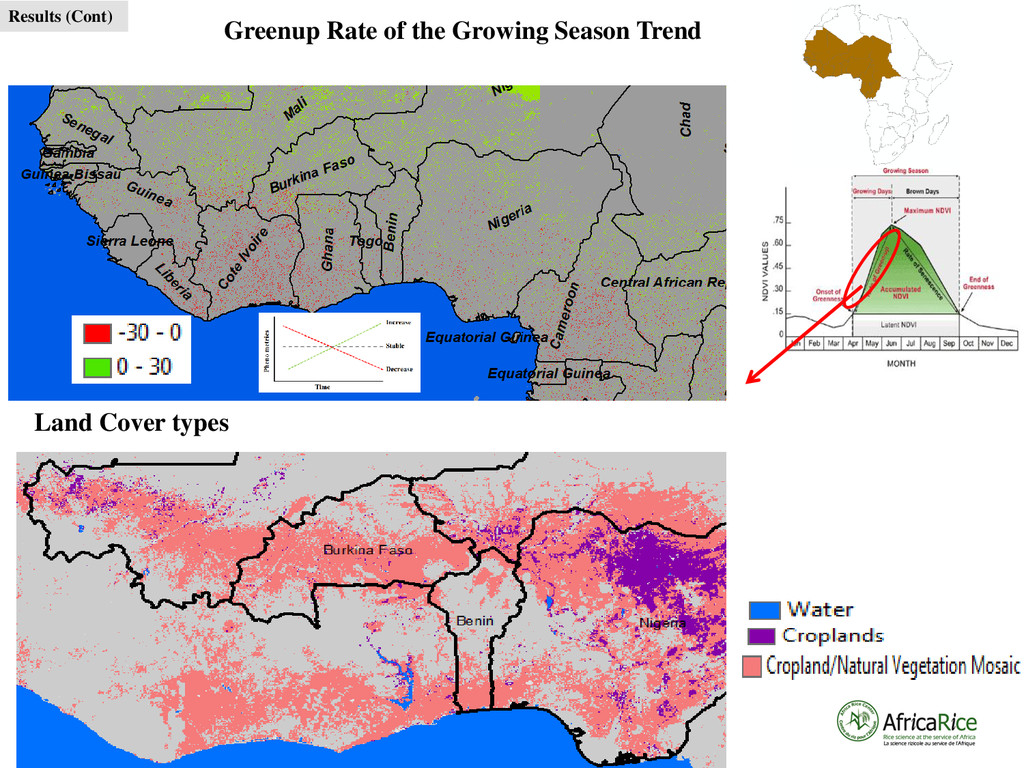
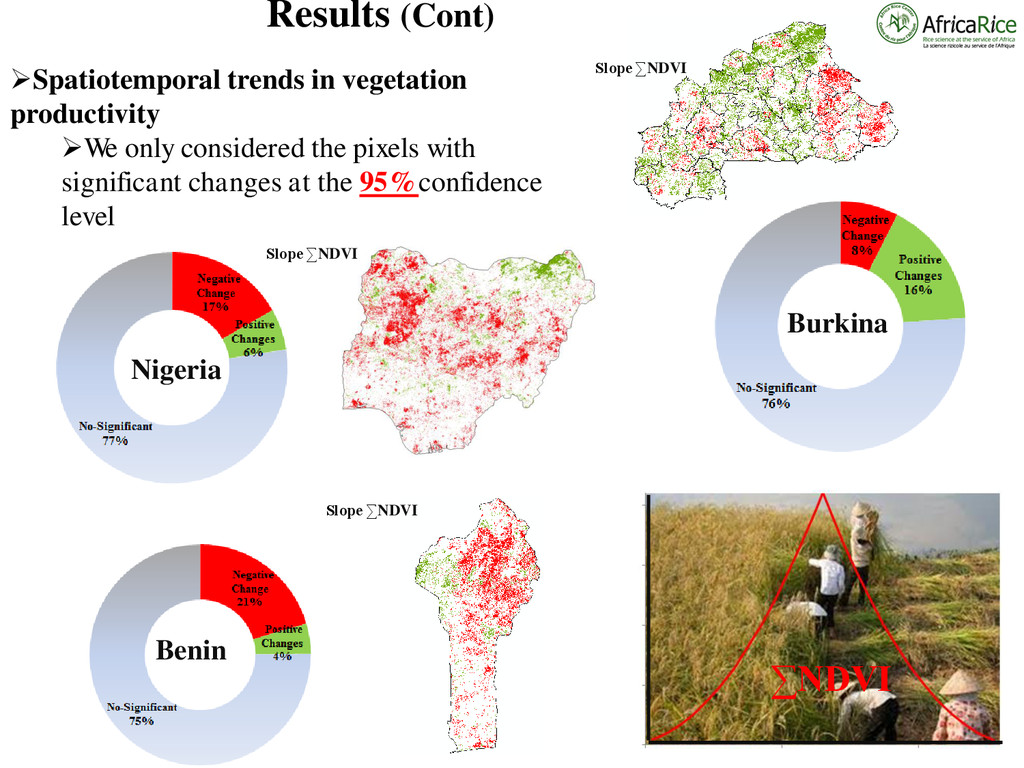
pixels with significant changes at the 95% confidence level. Detect any long-term crop productivity changes over the last 14 years In the model, time (14 years) is the independent variables; while the dependent variables were the annual phenological parameters : Y = Ax +B +ε Where X is the independent variables (time), Y is the modeled change variables (dependent variables), A is the slope, B presents the intercept and ε is the error term. Pheno metrics Time Increase Decrease Stable
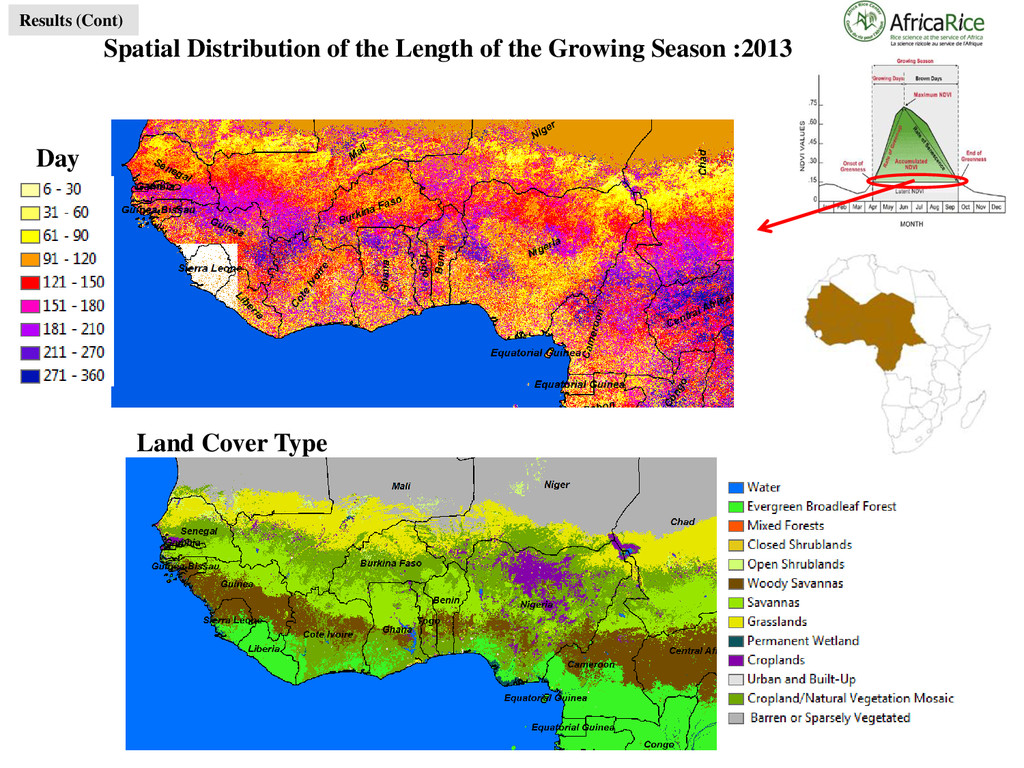
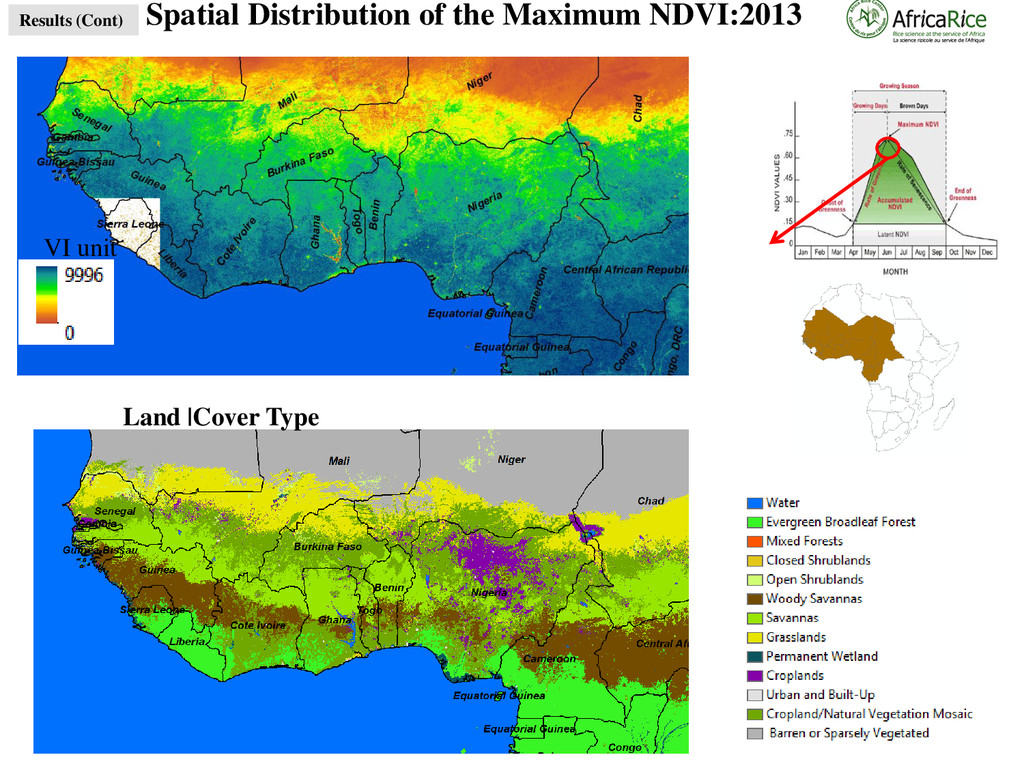
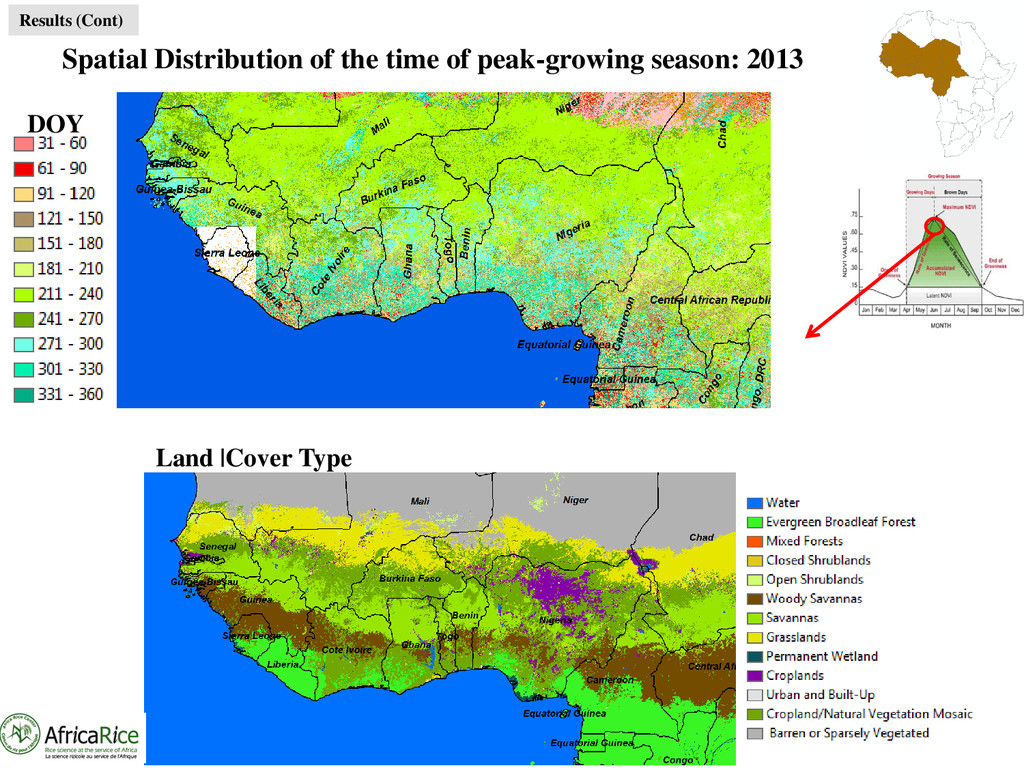
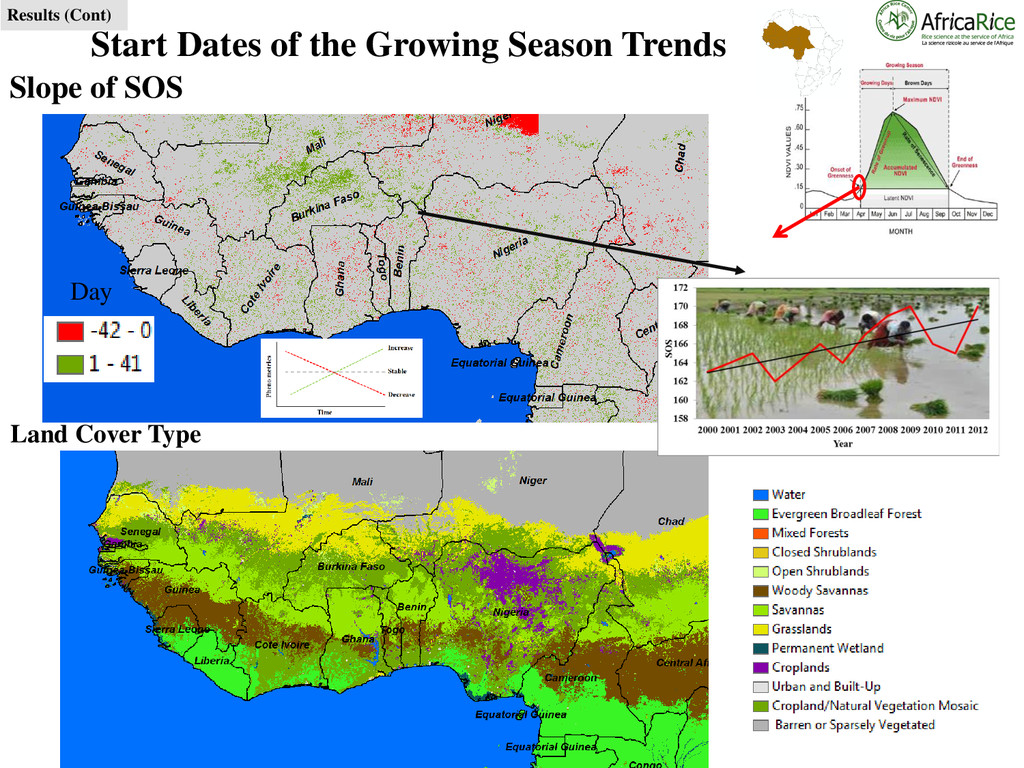
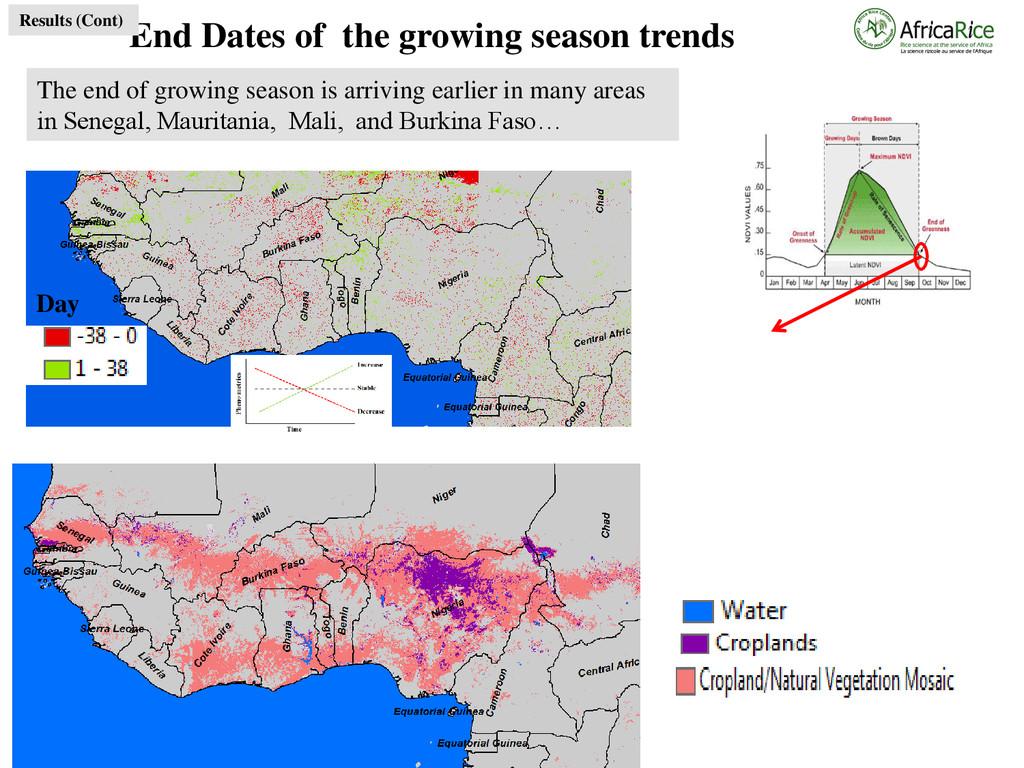
phenological information to monitor and assess vegetation (croplands) response to climate variability and change and disturbance events such as land use practices. The spatio-temporal phenological characterization utilizing MODIS time series data show distinctive vegetation(croplands) response patterns and trajectories The start dates of the growing season arrived later and has also expanded by 20– 41 days over the last 14 years in many countries. The end dates of growing season is arriving earlier in many places. The length of growing season is getting shorter Our results identify some key phenological dynamic for which the spatial temporal pattern may be pertinent in the studied area. Concluding Summary