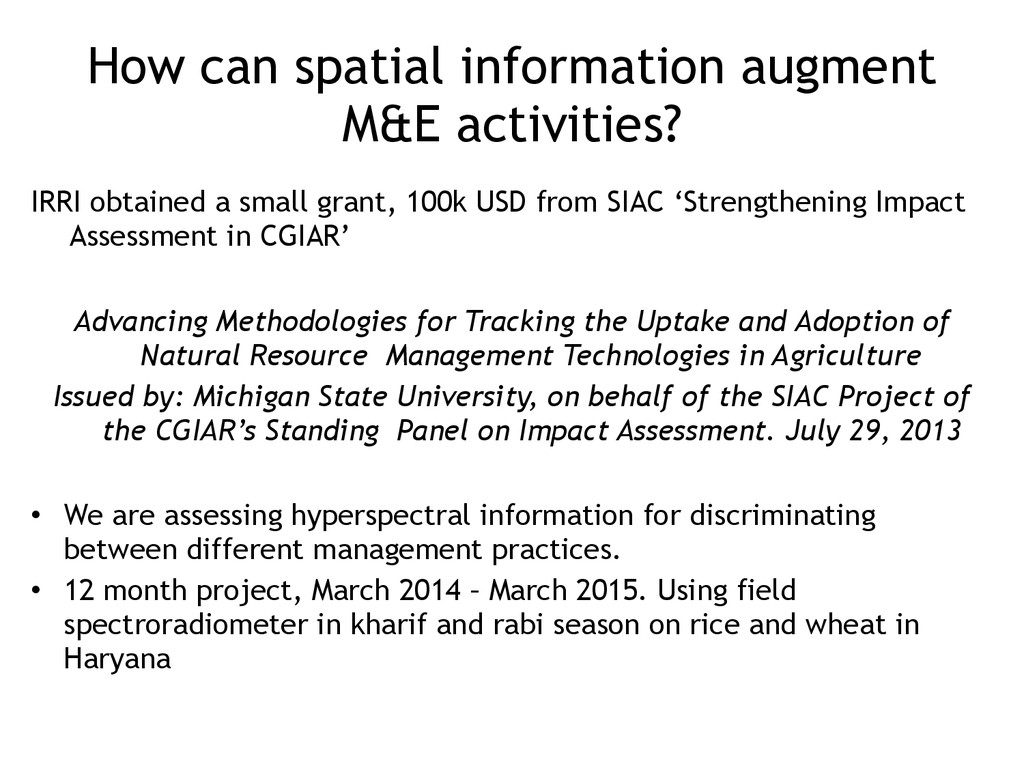
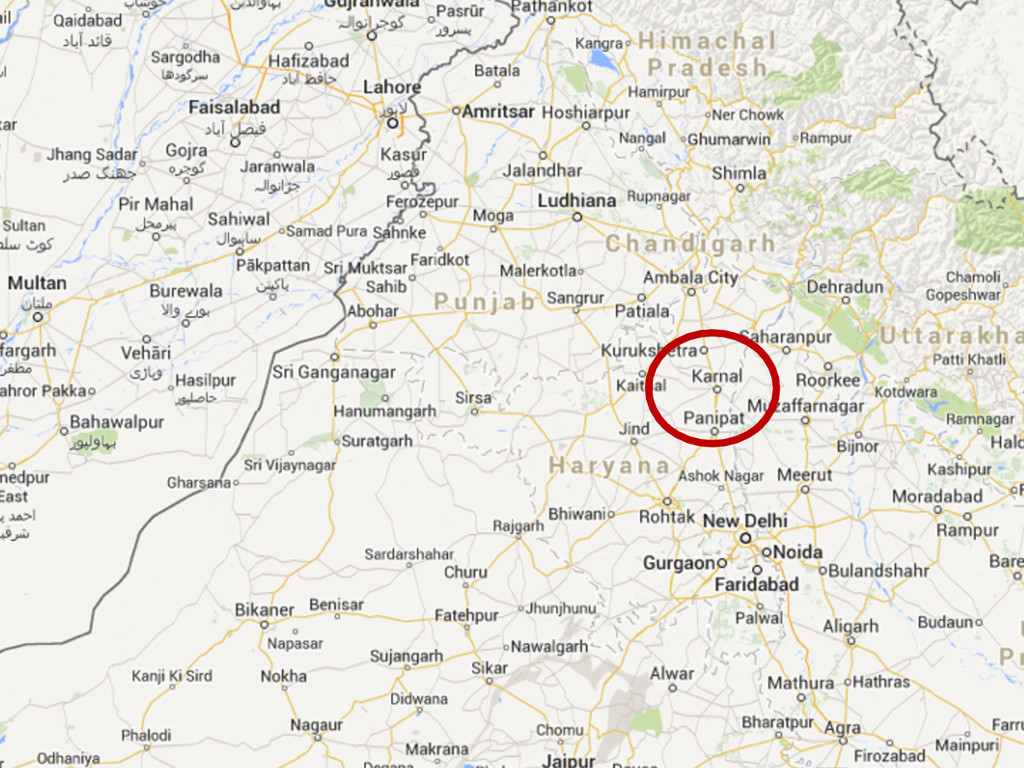
small grant, 100k USD from SIAC ‘Strengthening Impact Assessment in CGIAR’ ! Advancing Methodologies for Tracking the Uptake and Adoption of Natural Resource Management Technologies in Agriculture Issued by: Michigan State University, on behalf of the SIAC Project of the CGIAR’s Standing Panel on Impact Assessment. July 29, 2013 ! • We are assessing hyperspectral information for discriminating between different management practices. • 12 month project, March 2014 – March 2015. Using field spectroradiometer in kharif and rabi season on rice and wheat in Haryana
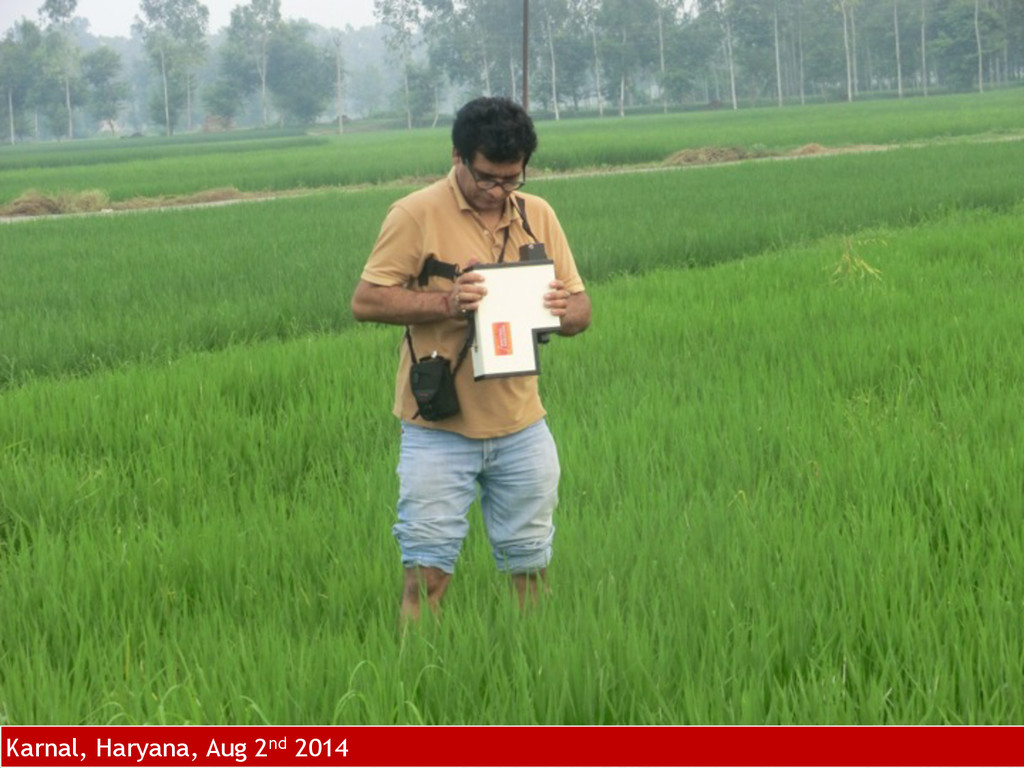
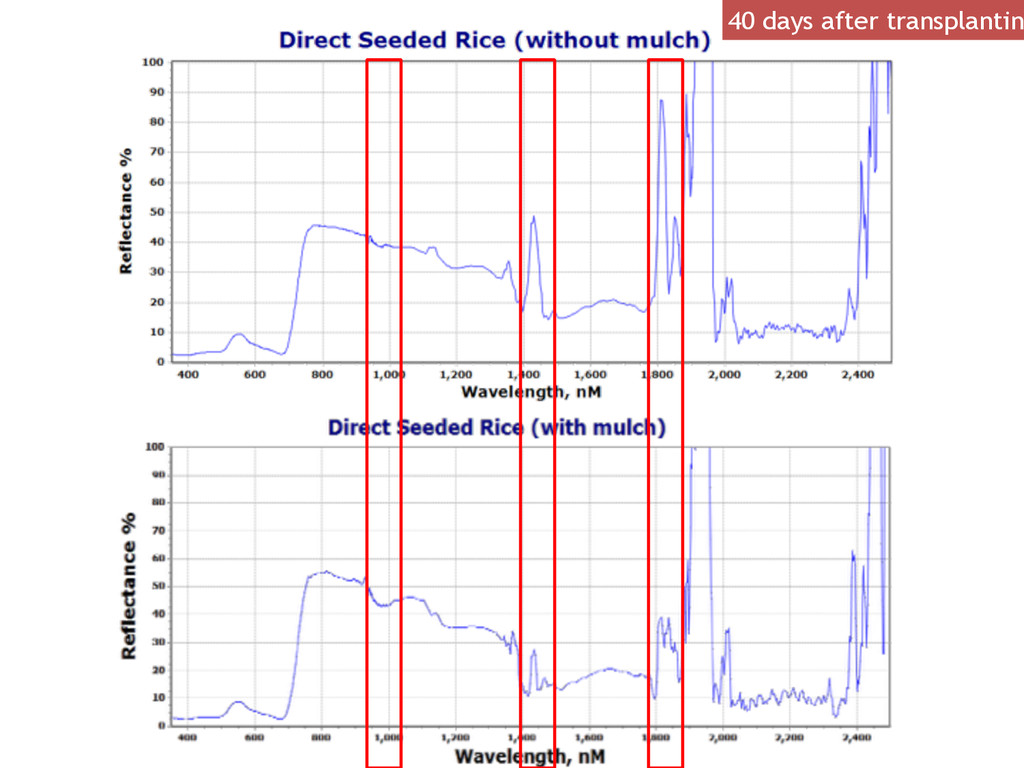
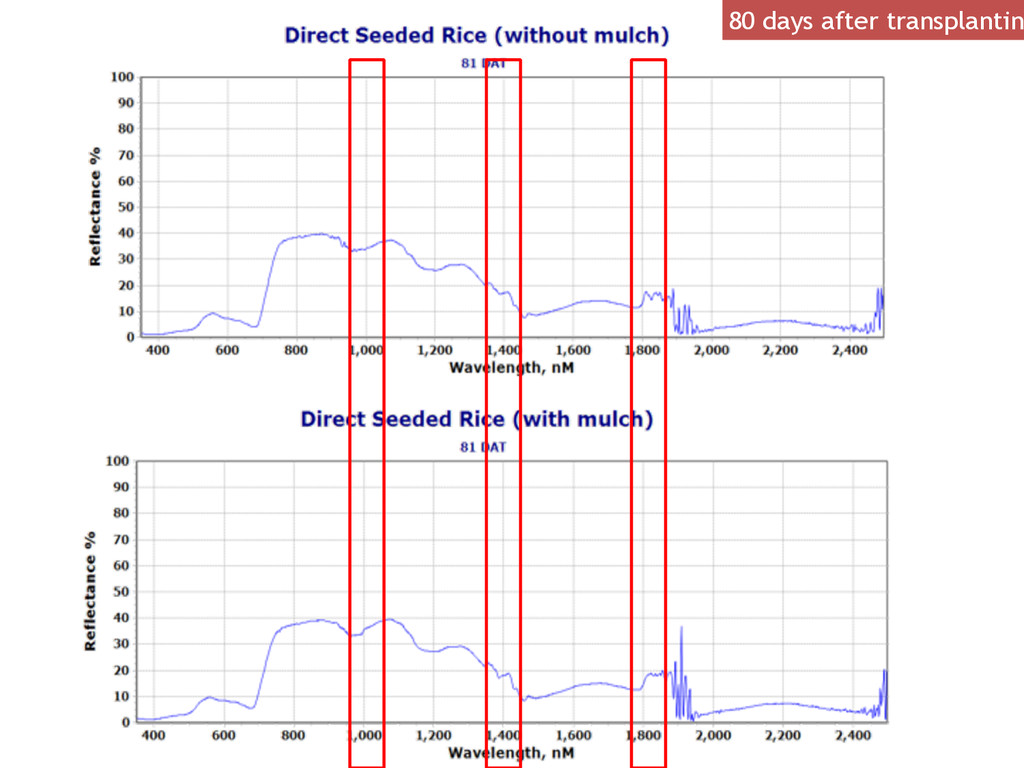
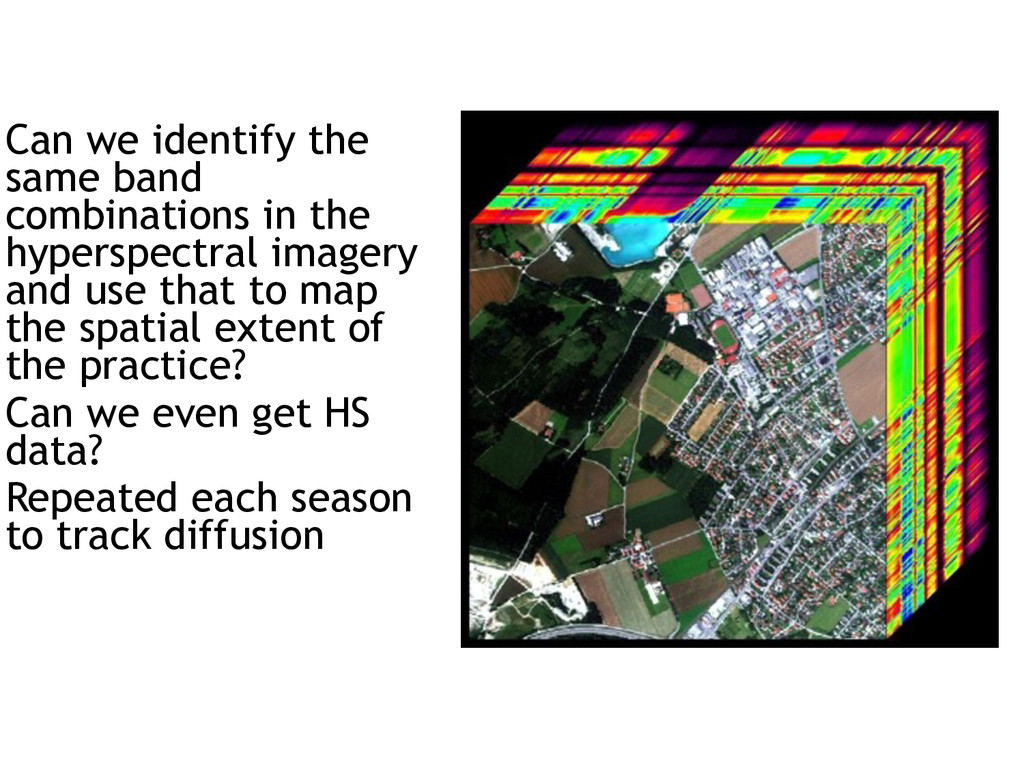
any hyperspectral imagery, we need to know what can be seen and in which part of the spectrum it can be seen. • Field work with a spectroradiometer to assess the spectral response of crops under different treatments.
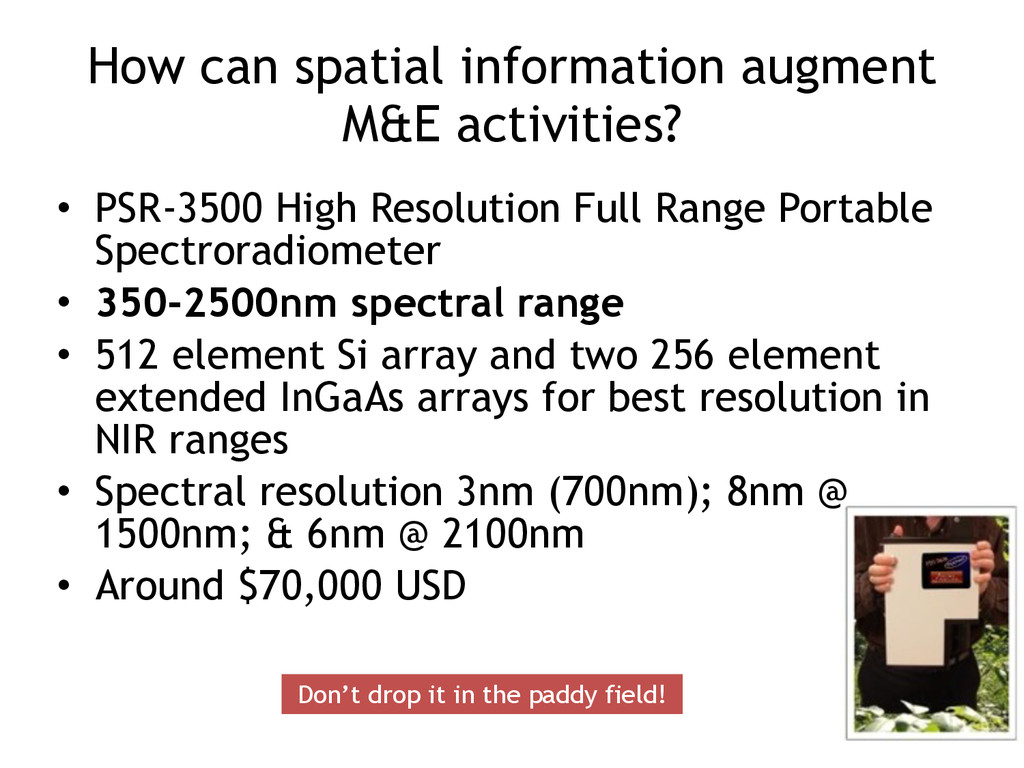
Resolution Full Range Portable Spectroradiometer • 350-2500nm spectral range • 512 element Si array and two 256 element extended InGaAs arrays for best resolution in NIR ranges • Spectral resolution 3nm (700nm); 8nm @ 1500nm; & 6nm @ 2100nm • Around $70,000 USD Don’t drop it in the paddy field!
weekly though the season on rice crops undergoing different treatments that compare traditional and innovative practices. • Detection of spectral band(s) and time of season that uniquely identify the practice. • How to scale up this information to map the spatial extent and diffusion of practices?
until Mar 2015 looking at resource conservation technologies. • Purchase imagery and assess feasibility. • Expand to varietal detection under BMGF project STRASA III • Investigate pest and disease signatures • Contribute to a spectral/temporal library.