Upgrade to Pro — share decks privately, control downloads, hide ads and more …

Geoinformatics in an integrated agro-ecosystems research

CGIAR-CSI
September 23, 2014
56

Geoinformatics in an integrated agro-ecosystems research

CGIAR-CSI

September 23, 2014
Tweet

Transcript

  1. improved algorithms, workflows, methods and datasets for cross-cutting themes Chandrashekhar

    Biradar, PhD Geoinformatics Unit CSI 2014, Sep 22-24, 2014 ITC, The Netherlands
  2. Gender Health Youth & Capacity Dev. Address social inequities, greater

    roles and priorities Engaging and empowering young gen. by creating opportunities Changing diet patterns, nutrition and health $ Total 122.7m Startup 35.47m 156 Remote sensing missions in orbit Sensors potential in CRPs/IRPs, etc. 41% Drylands Earth‘s land area 2.5b Live in Drylands People 1) The West African Sahel and dry savannas , 2) East and Southern Africa , 3) North Africa and West Asia 4) Central Asia , and 5) South Asia. Regions Food Security Livelihoods Improved Ensuring increased Livestock 5 Depend on Drylands 1.5b Red. Vul. Sus. Int. A/Ss TAs A/Ss TAs Spatial enrichment and its role in food security, risk mitigation, & sustainability  Food production potential sources Agricultural Intensification Cropping Intensity Increase in Arable Land 72% 21% 7% >12 >6 are free Biodiversity Integrated Ag. Production Systems for Improving Food Security and Livelihoods in Dry Areas Efficiency Productivity Role of Geospatial Science, Technology and Applications (GeSTA) in Agro-Ecosystems Integrated agro- ecosystems: innovative approaches and methods for sustainable agriculture, while safeguarding the environment Cooperative Research and Partnerships Specific mutual-interaction & synergies between plant and animal species and management practices Quantification of existing agricultural production systems Characterization of vulnerable areas for increasing resilience and assist in identifying mitigation pathways with biophysical, socioeconomic and stakeholder feedback as well as specific needs & constraints Mapping present, emerging & future land use /land cover dynamics, cropping patterns, forage, intensities, water use, pest & diseases, climate change & impacts Characteristics of agricultural and livestock production in small holder farming systems and rural livelihoods Delineation of potential, suitable areas for sustainable intensification, and diversification of ag. Innovation production systems Status & trends of existing production systems Assessment of present, emerging & future droughts, floods, pests & diseases, extreme events, infrastructure, migration Mapping the extent of existing & traditional practices, indigenous knowledge, diversity, potential areas for modern & improved, productive, profitable, and diversified dryland agriculture, & linkages to markets Assessing the impact of outcomes in Action Sites, post-project implementation, & M&E Measuring the impact at spatial scales, rate, magnitude, synergy among the systems, CRPs, cross-regional synthesis Geospatial commons , KM sharing, stakeholder feedback Farmers, stakeholders, policymakers, mobilization, & marketing
  3. Multi-sensor and multi-scale observations of carbon (biomass, yield), water (WUE,

    footprint), and surface energy fluxes at pixel to landscape scales Productivity of Croplands and Grasslands Land Degradation and Desertification Extreme Events and Climate Change Integrated Earth Observation System Thematic foci
  4. Multi-sensor and multi-scale observations of carbon (biomass, yield), water (WUE,

    footprint), and surface energy fluxes at pixel to landscape scales Productivity of Croplands and Grasslands Land Degradation and Desertification Extreme Events and Climate Change Integrated Earth Observation System Thematic foci
  5. Multi-sensor and multi-scale observations of carbon (biomass, yield), water (WUE,

    footprint), and surface energy fluxes at pixel to landscape scales Productivity of Croplands and Grasslands Land Degradation and Desertification Extreme Events and Climate Change Integrated Earth Observation System Thematic foci
  6. Micro- Hyperspec (0.79 kg) IBP, HTP, OFTs, BPBS Hyperspectral Thermal

    Infrared Integrated Earth Observation System BaySpec OCI 1000 and 2000 FLIR Tau Thermal Imaging
  7. Spectral Reflectance Models for Characterizing Genotypes for Various Traits In

    review; Agronomy Journal Models developed for LAI, Grain Yield, Biomass and WUE using the absolute and first derivative reflectance under irrigated (a-c) and dryland (d-f) conditions‡. Wheat for drought/heat tolerance
  8. Improved time-series processing algorithms Without considering quality flags cloudmask With

    considering quality flags cloudmask Start or end date of growing season: the threshold value is equal to 20% of the seasonal amplitude. 2000 to current -15days VIs, LSTs, Phenology, etc. 21 products) TIMESAT
  9. Site1 More Productive 49.345293 N 73.305316 E -30 -25 -20

    -15 -10 -5 0 5 10 15 20 -0.6 -0.4 -0.2 0 0.2 0.4 0.6 0.8 1 01/01/09 01/25/09 02/18/09 03/14/09 04/07/09 05/01/09 05/25/09 06/18/09 07/12/09 08/05/09 08/29/09 09/22/09 10/16/09 11/09/09 12/03/09 12/27/09 01/17/10 02/10/10 03/06/10 03/30/10 04/23/10 05/17/10 06/10/10 07/04/10 07/28/10 08/21/10 09/14/10 10/08/10 11/01/10 11/25/10 12/19/10 01/09/11 02/02/11 02/26/11 03/22/11 04/15/11 05/09/11 06/02/11 06/26/11 07/20/11 08/13/11 09/06/11 09/30/11 10/24/11 11/17/11 12/11/11 Temperature (°C) VI Date Grassland_1 LST NDVI EVI LSWI Bad observation Time-series Spectral Profiles of Agro-Ecosystems Seasonal and Annual Dynamics
  10. -30 -25 -20 -15 -10 -5 0 5 10 15

    20 -0.6 -0.1 0.4 0.9 1.4 1.9 01/01/09 01/25/09 02/18/09 03/14/09 04/07/09 05/01/09 05/25/09 06/18/09 07/12/09 08/05/09 08/29/09 09/22/09 10/16/09 11/09/09 12/03/09 12/27/09 01/17/10 02/10/10 03/06/10 03/30/10 04/23/10 05/17/10 06/10/10 07/04/10 07/28/10 08/21/10 09/14/10 10/08/10 11/01/10 11/25/10 12/19/10 01/09/11 02/02/11 02/26/11 03/22/11 04/15/11 05/09/11 06/02/11 06/26/11 07/20/11 08/13/11 09/06/11 09/30/11 10/24/11 11/17/11 12/11/11 Temperature (°C) VI Date Grassland_2 LST NDVI EVI LSWI Bad observation Site2 Less Productive 49.321334 N, 72.948339 E Seasonal and Annual Dynamics Time-series Spectral Profiles of Agro-Ecosystems
  11. 8-day 0 1 2 3 4 5 6 7 8

    910 11 12 13 14 15 16 17 18 19 20 21 22 23 24 25 26 27 28 29 30 31 32 33 34 35 36 37 38 39 40 41 42 43 44 45 46 Start date of LSWI>=0 during LST-5 based growing season End date of LSWI>=0 during LST-5 based growing season Length of LSWI>=0 during LST-5 based growing season Length of LSWI<0 during LST-5 based growing season Quantification of Spatial-patterns and CC VI and LST based Phenology
  12. Satellite-based Production Efficiency Models (PEMs) Time (8-day periods) Dec Jan

    Feb Mar Apr May Jun Jul Aug Sep Oct Nov Dec Jan LSWI -0.3 -0.2 -0.1 0.0 0.1 0.2 0.3 Control 2000-13 Burned 2000-13 Burned 2006 a) El Reno Control Time (8-day periods) Mar Apr May Jun Jul Aug Sep Oct Nov Dec Jan Feb Mar Apr May Jun Jul Aug Sep Oct Nov Carbon flux (g C m-2 day-1) 0 3 6 9 12 15 GPP VPM GPP EC b) El Reno Burned Time (8-day periods) Apr May Jun Jul Aug Sep Oct Nov Dec Jan Feb Mar Apr May Jun Jul Aug Sep Oct Nov Carbon flux (g C m-2 day-1) 0 3 6 9 12 15 18 2005 2006 2005 2006 c) Fermi Prairie Time (8-day periods) Apr May Jun Jul Aug Sep Oct Nov Dec Jan Feb Mar Apr May Jun Jul Aug Sep Oct Nov Carbon flux (g C m-2 day-1) 0 3 6 9 12 15 2005 2007 Vegetation types Satellite-based vegetation indices and phenology Climate (T, P, PAR) Gross and net primary production (NPP/GPP) Seasonal and annual dynamics of land productivity and degradation Vegetation Photosynthesis and Transpiration Models (VPM/VTMs) In-situ Web Apps and Tools geogaro.icarda.org (Wagle et al 2014, Dong et al 2014, Xiao et al., 2012, 2013, Kalfas et al., 2011)
  13. 8-day 0 1 2 3 4 5 6 7 8

    910 11 12 13 14 15 16 17 18 19 20 21 22 23 24 25 26 27 28 29 30 31 32 33 34 35 36 37 38 39 40 41 42 43 44 45 46 Drought Year 2001 Grasslands Croplands (Irrigated) Inter and intra annual variability VI and LST based Phenology Croplands (Irrigated/ Rainfed) Leaf Chlorophyll EVI Leaf Area Index NDVI Leaf Water LSWI
  14. Normal Year 2002 8-day 0 1 2 3 4 5

    6 7 8 910 11 12 13 14 15 16 17 18 19 20 21 22 23 24 25 26 27 28 29 30 31 32 33 34 35 36 37 38 39 40 41 42 43 44 45 46 Croplands (Irrigated/ Rainfed) Grasslands Croplands (Irrigated) VI and LST based Phenology Inter and intra annual variability Leaf Chlorophyll EVI Leaf Area Index NDVI Leaf Water LSWI
  15. Vegetation Dynamics: CC and Extreme Events Land Degradation and Desertification

    0.00 0.20 0.40 0.60 0.80 1.00 1.20 2000 2001 2002 2003 2004 2005 2006 2007 2008 2009 2010 2011 2012 2013 Enhanced Vegetation Index (EVI) 8-days interval from 2000-2013 Water deficit years (droughts) Water surplus years (good years) MODIS Time-Series Spectral Profile for Drylands Vegetation (2000-2013)
  16. Crop Calendar: Starting and Ending dates, length of growing season,

    duration of crop fallows, etc. Days --- 64 80 96 112 128 144 160 An example of duration of the crop fallows between two crops in Indo-Gangetic Plains for identifying suitable areas for crop diversification and intensification (legumes and oilseeds) (on going) LST Based Phenology MODIS @ 500m
  17. crop-fallows for crop diversification and Intensification (E & EE) Characterization

    of Crop Fallows specific crop breeding: early and extra -early varieties, moisture stress, etc. Source: Esri, DigitalGlobe, GeoEye, i-cubed, USDA, USGS, AEX, Getmapping, Aerogrid, IGN, IGP, swisstopo, and the GIS User Community Landsat @ 30m
  18. Development of new datasets and algorithms for predictions of CC

    related traits and phenology alignment to capture climate-induced shifts; Testing and analysing sub-setting and FIGS subsets evaluation procedures with the aim to reduce further the FIGS subset size; Development of new subsets. FIGS Research The search for useful traits in genebanks (T&R to heat, drought, frost, P&D resistance, etc.) 0.0 0.2 0.4 0.6 0.8 1.0 0 1 2 3 4 Probability predictions of resistance to Stripe rust in wheat Susceptibility Resistance Predicted probability Density Barley sub-setting for heat tolerance Focused Identification of Germplasm Strategy Climate data ECMWF (1979-2013) -0.25 and 1km surfaces -daily, weekly, monthly RS Data -phenology -pattern, intensity (Bari et al, 2014)
  19. Decadal LCLUC (1980s-2014) e.g., National LULUC for Jordan Degrading Landscapes:

    e.g., Syria Impact of civil unrest on Ag. (work in progress) West Africa (KKM and WBS), Central Asia (Fergana Valley)
  20. © ICARDA Geoinformatics 2014 ¯ Field Sites / IP Community

    LCLUC Characterization at Farm Scales
  21. LCLUC Characterization at Farm Scales Field Sites / IP Community

    Olives Orchards Grasslands Croplands Mixed Systems Settlements with Home Gardens 1 2 3 4 5 1 2 3 4 5
  22. Probability of grain yield increase of simulating different sowing dates,

    short or long terms, actual transpirable soil water, phenology, etc. Crop Modeling (Physiology based simulations) Production potential of Lentil Grain yield to different sowing dates (Michel et al., Agricultural Systems, in review)
  23. Vulnerability Index Low High Stripe Rust in Wheat Pest and

    Disease Risk Mapping Climate and Biophysical similarities and Disease Triangle (Biradar et al 2014)
  24. Mapping and Monitoring (distribution, condition, residue, productivity) 10 Research Trails

    20 Farmers Trails 500 Extension Trials 5000+ Adaptation Impact Assessment Tracking Adoption of Conservation Agriculture CANA, North Africa
  25. Tools Short Description GeoAgro Portal part of ICARDA Geoinformatics Unit

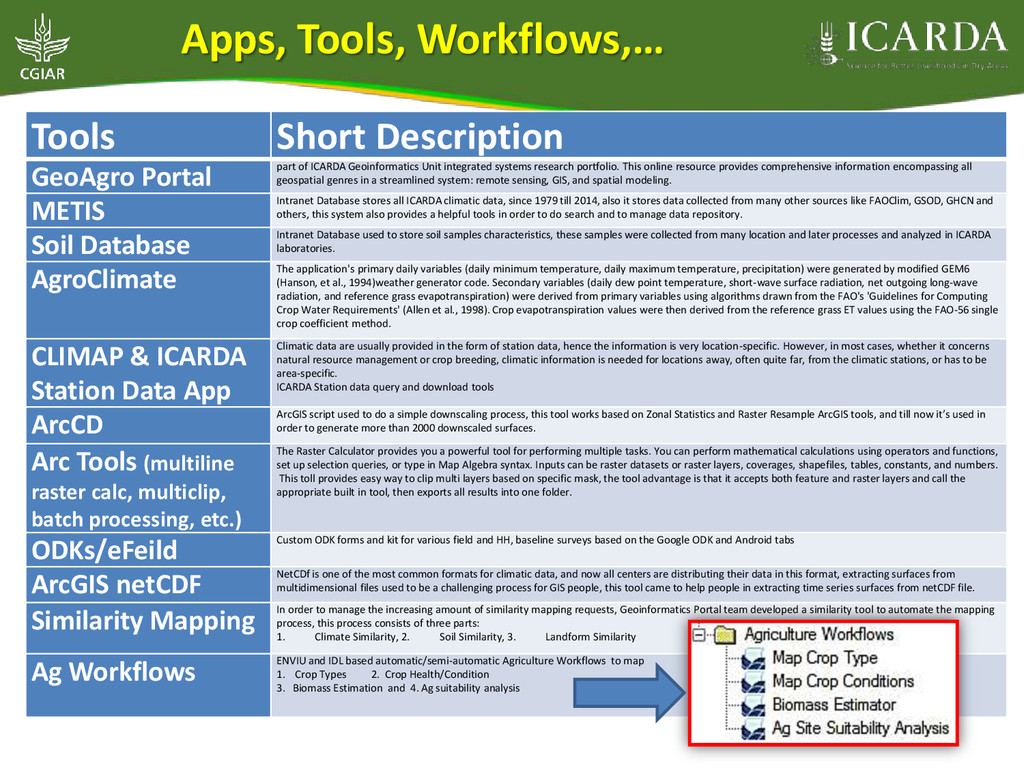
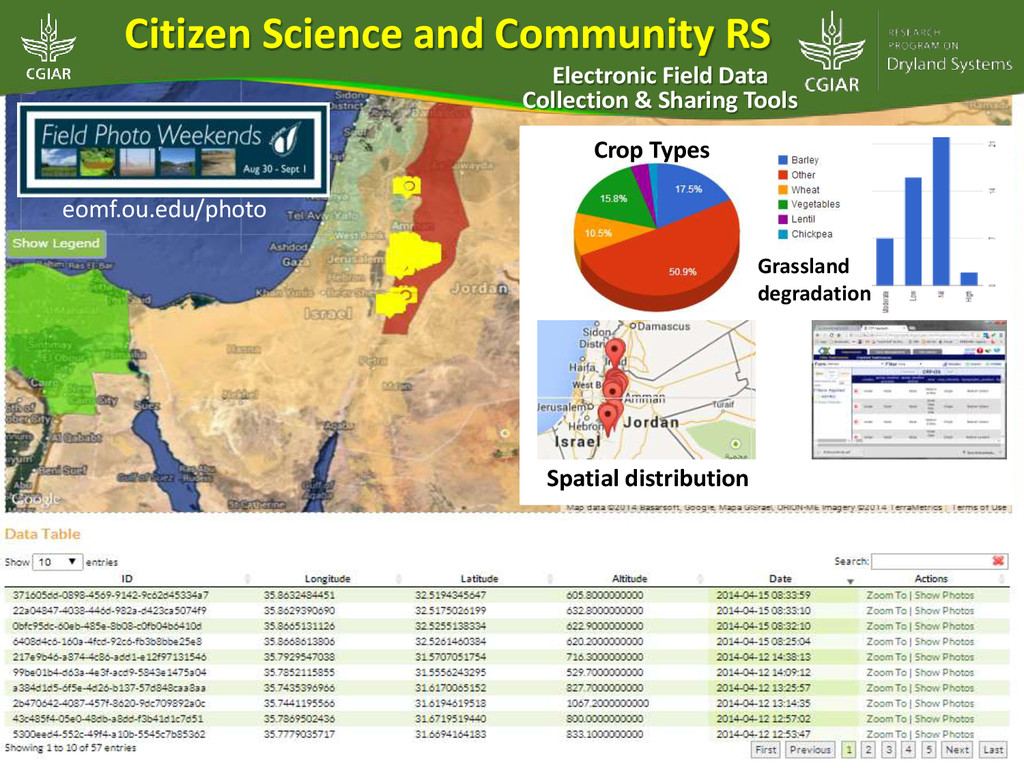
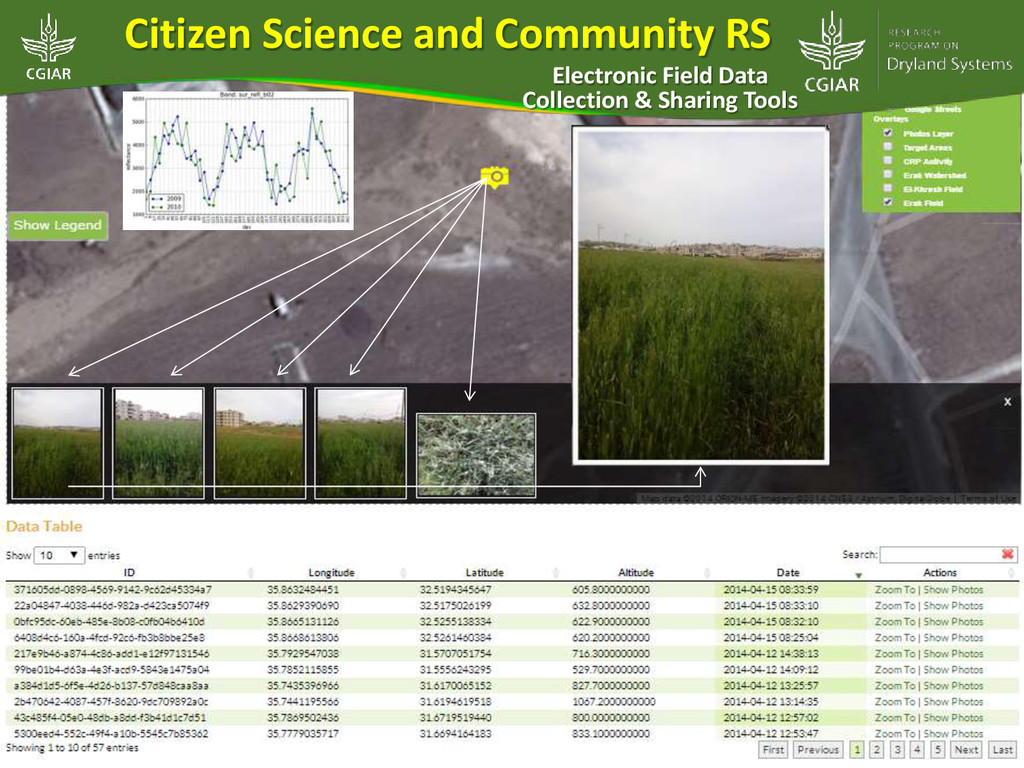
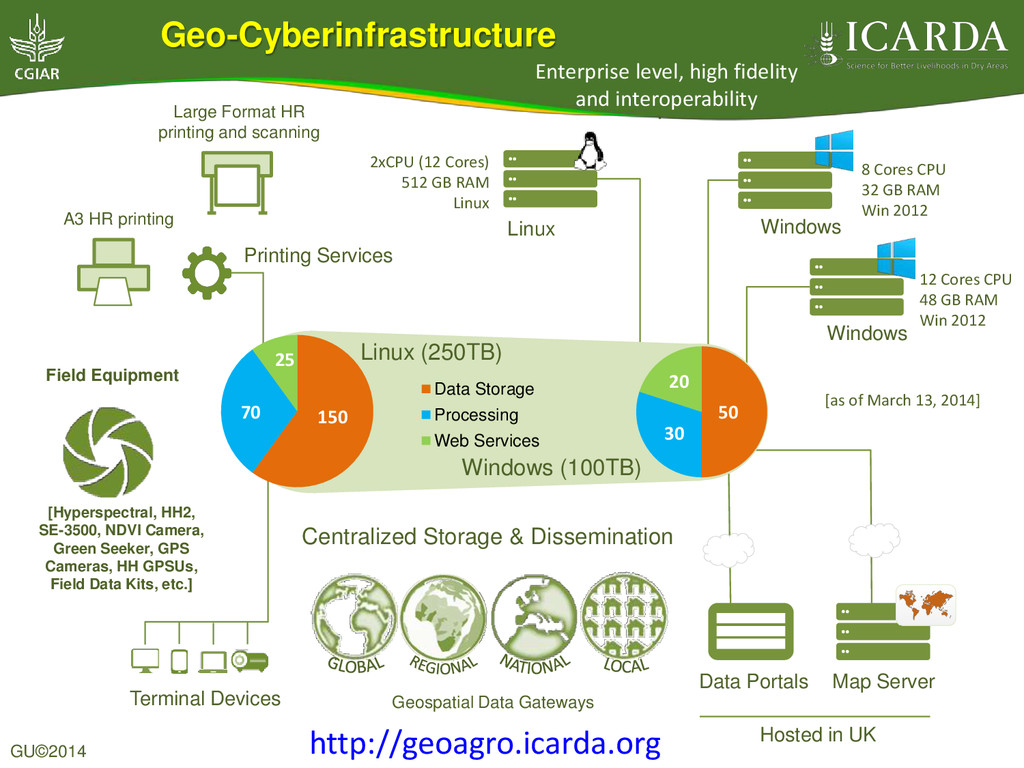
    integrated systems research portfolio. This online resource provides comprehensive information encompassing all geospatial genres in a streamlined system: remote sensing, GIS, and spatial modeling. METIS Intranet Database stores all ICARDA climatic data, since 1979 till 2014, also it stores data collected from many other sources like FAOClim, GSOD, GHCN and others, this system also provides a helpful tools in order to do search and to manage data repository. Soil Database Intranet Database used to store soil samples characteristics, these samples were collected from many location and later processes and analyzed in ICARDA laboratories. AgroClimate The application's primary daily variables (daily minimum temperature, daily maximum temperature, precipitation) were generated by modified GEM6 (Hanson, et al., 1994)weather generator code. Secondary variables (daily dew point temperature, short-wave surface radiation, net outgoing long-wave radiation, and reference grass evapotranspiration) were derived from primary variables using algorithms drawn from the FAO's 'Guidelines for Computing Crop Water Requirements' (Allen et al., 1998). Crop evapotranspiration values were then derived from the reference grass ET values using the FAO-56 single crop coefficient method. CLIMAP & ICARDA Station Data App Climatic data are usually provided in the form of station data, hence the information is very location-specific. However, in most cases, whether it concerns natural resource management or crop breeding, climatic information is needed for locations away, often quite far, from the climatic stations, or has to be area-specific. ICARDA Station data query and download tools ArcCD ArcGIS script used to do a simple downscaling process, this tool works based on Zonal Statistics and Raster Resample ArcGIS tools, and till now it’s used in order to generate more than 2000 downscaled surfaces. Arc Tools (multiline raster calc, multiclip, batch processing, etc.) The Raster Calculator provides you a powerful tool for performing multiple tasks. You can perform mathematical calculations using operators and functions, set up selection queries, or type in Map Algebra syntax. Inputs can be raster datasets or raster layers, coverages, shapefiles, tables, constants, and numbers. This toll provides easy way to clip multi layers based on specific mask, the tool advantage is that it accepts both feature and raster layers and call the appropriate built in tool, then exports all results into one folder. ODKs/eFeild Custom ODK forms and kit for various field and HH, baseline surveys based on the Google ODK and Android tabs ArcGIS netCDF NetCDf is one of the most common formats for climatic data, and now all centers are distributing their data in this format, extracting surfaces from multidimensional files used to be a challenging process for GIS people, this tool came to help people in extracting time series surfaces from netCDF file. Similarity Mapping In order to manage the increasing amount of similarity mapping requests, Geoinformatics Portal team developed a similarity tool to automate the mapping process, this process consists of three parts: 1. Climate Similarity, 2. Soil Similarity, 3. Landform Similarity Ag Workflows ENVIU and IDL based automatic/semi-automatic Agriculture Workflows to map 1. Crop Types 2. Crop Health/Condition 3. Biomass Estimation and 4. Ag suitability analysis Apps, Tools, Workflows,…
  26. Grassland degradation Crop Types Spatial distribution Citizen Science and Community

    RS Electronic Field Data Collection & Sharing Tools eomf.ou.edu/photo
  27. Data Storage Processing Web Services Linux (250TB) Windows (100TB) 150

    70 25 50 20 30 Centralized Storage & Dissemination Map Server Data Portals Terminal Devices Windows Windows Linux 12 Cores CPU 48 GB RAM Win 2012 8 Cores CPU 32 GB RAM Win 2012 2xCPU (12 Cores) 512 GB RAM Linux Hosted in UK Computing Servers Printing Services Large Format HR printing and scanning A3 HR printing GU©2014 Field Equipment [Hyperspectral, HH2, SE-3500, NDVI Camera, Green Seeker, GPS Cameras, HH GPSUs, Field Data Kits, etc.] Geo-Cyberinfrastructure Geospatial Data Gateways Enterprise level, high fidelity and interoperability [as of March 13, 2014] http://geoagro.icarda.org