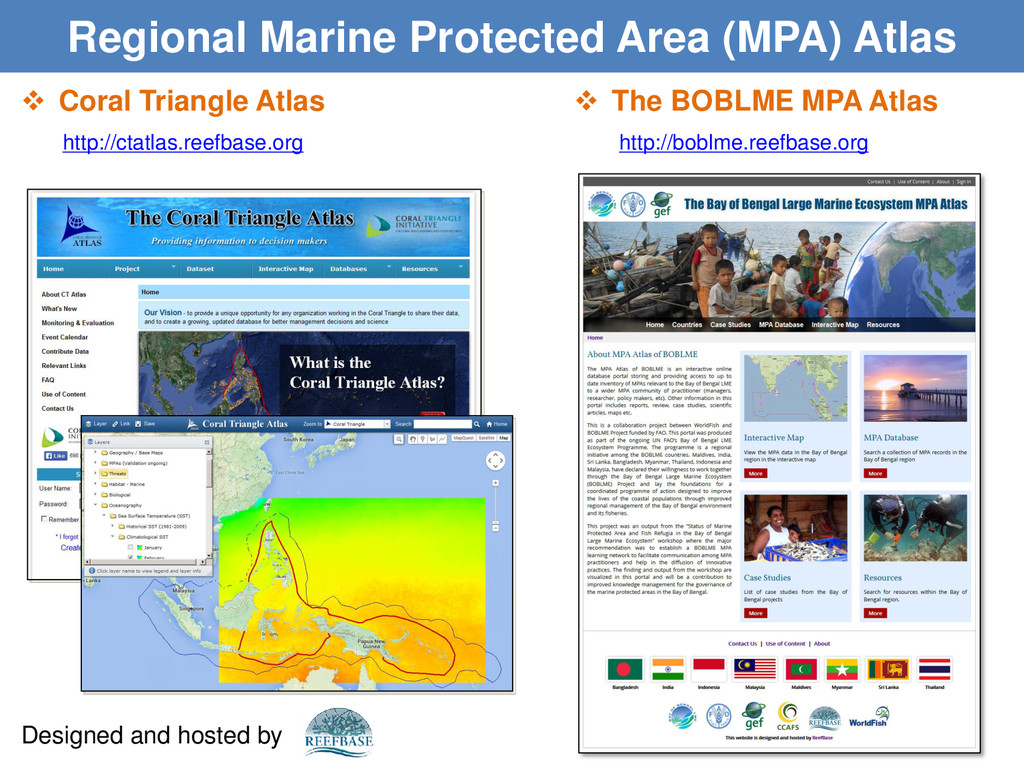
GIS (PGIS) GIS Modeling for Sustainable Aquaculture Development Planning in Timor-Leste Catchment Water Allocation Tool (CaWAT) Regional Marine Protected Area (MPA) Atlas
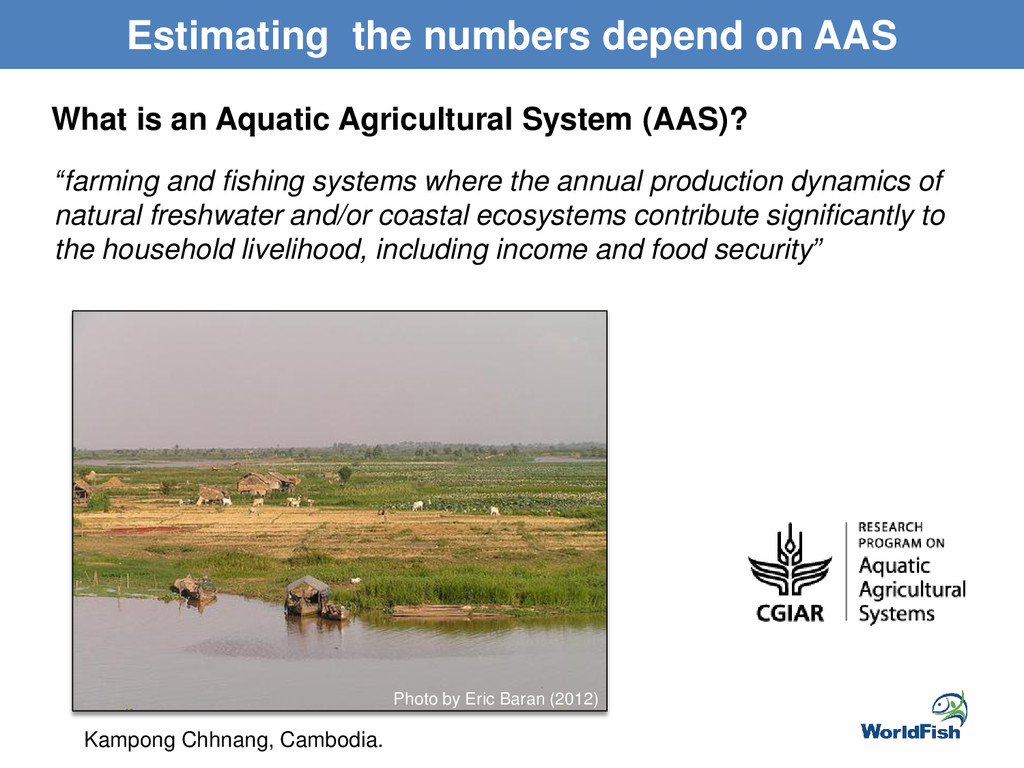
natural freshwater and/or coastal ecosystems contribute significantly to the household livelihood, including income and food security” Estimating the numbers depend on AAS What is an Aquatic Agricultural System (AAS)? Kampong Chhnang, Cambodia. Photo by Eric Baran (2012)
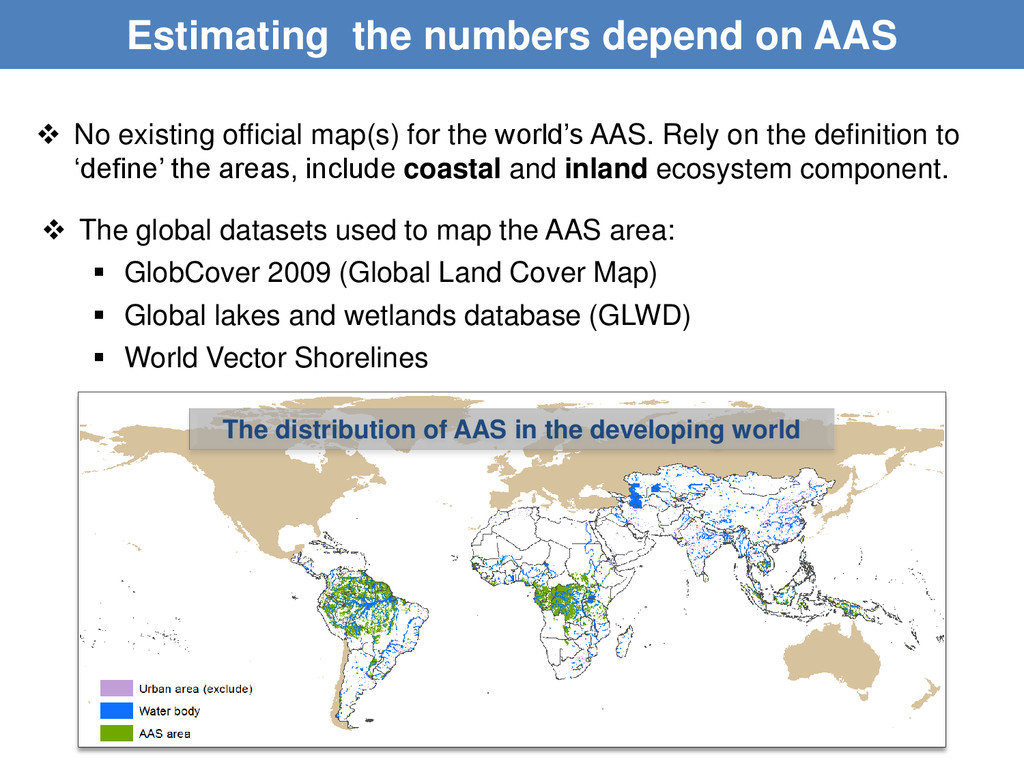
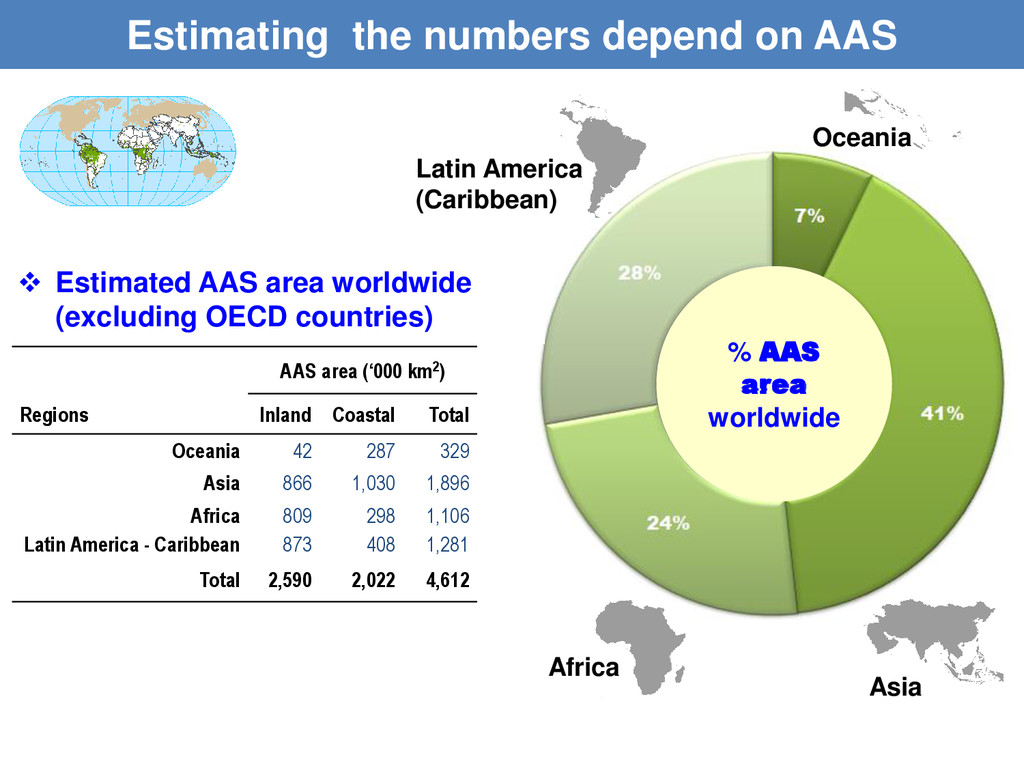
in the developing world No existing official map(s) for the world’s AAS. Rely on the definition to ‘define’ the areas, include coastal and inland ecosystem component. The global datasets used to map the AAS area: GlobCover 2009 (Global Land Cover Map) Global lakes and wetlands database (GLWD) World Vector Shorelines
287 329 Asia 866 1,030 1,896 Africa 809 298 1,106 Latin America - Caribbean 873 408 1,281 Total 2,590 2,022 4,612 Estimating the numbers depend on AAS Oceania Asia Africa Latin America (Caribbean) % AAS area worldwide Estimated AAS area worldwide (excluding OECD countries)
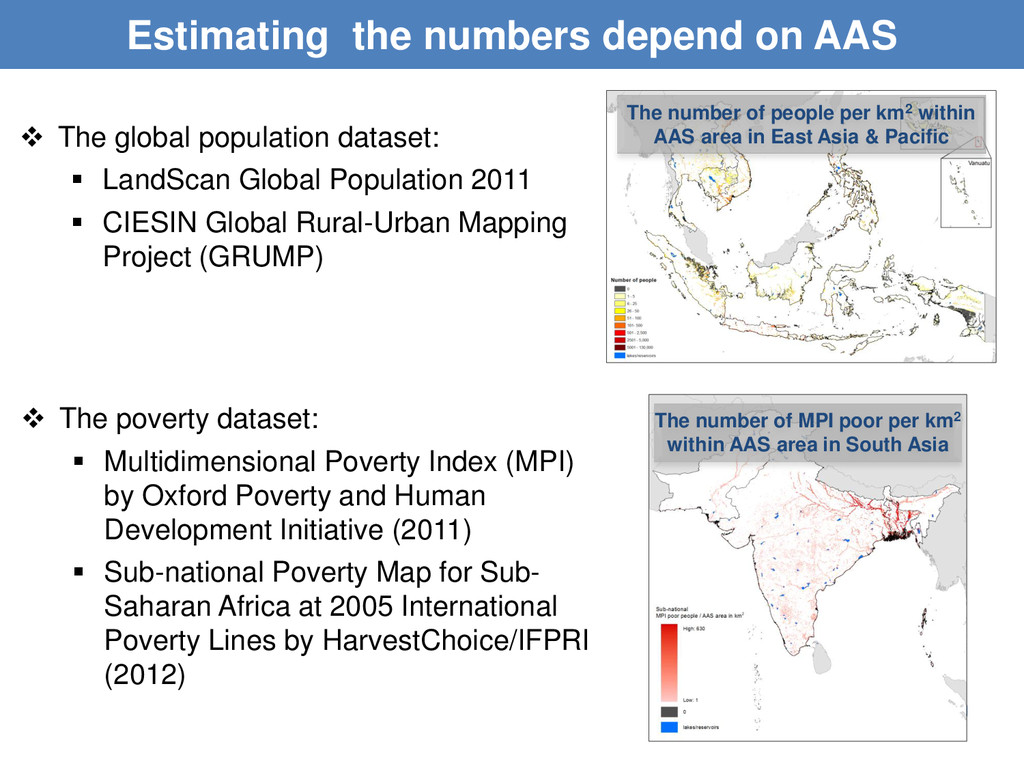
dataset: LandScan Global Population 2011 CIESIN Global Rural-Urban Mapping Project (GRUMP) The poverty dataset: Multidimensional Poverty Index (MPI) by Oxford Poverty and Human Development Initiative (2011) Sub-national Poverty Map for Sub- Saharan Africa at 2005 International Poverty Lines by HarvestChoice/IFPRI (2012) The number of MPI poor per km2 within AAS area in South Asia The number of people per km2 within AAS area in East Asia & Pacific
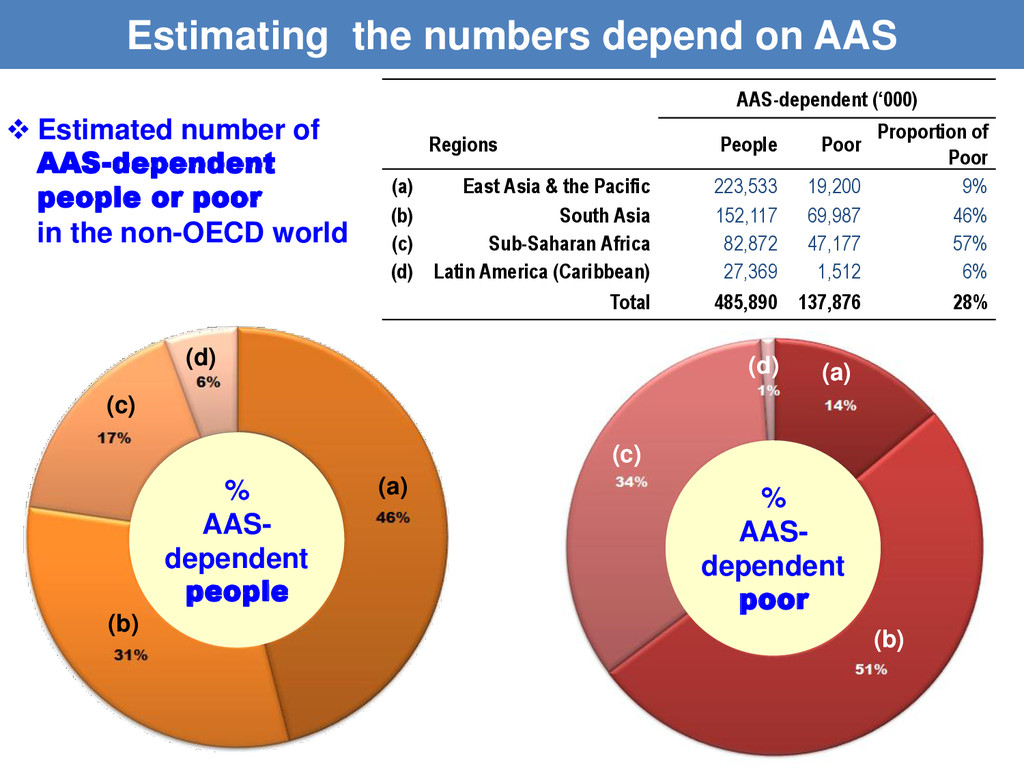
Asia & the Pacific 223,533 19,200 9% (b) South Asia 152,117 69,987 46% (c) Sub-Saharan Africa 82,872 47,177 57% (d) Latin America (Caribbean) 27,369 1,512 6% Total 485,890 137,876 28% % AAS- dependent people % AAS- dependent poor Estimating the numbers depend on AAS (b) (a) (c) Estimated number of AAS-dependent people or poor in the non-OECD world (d) (a) (b) (c) (d)
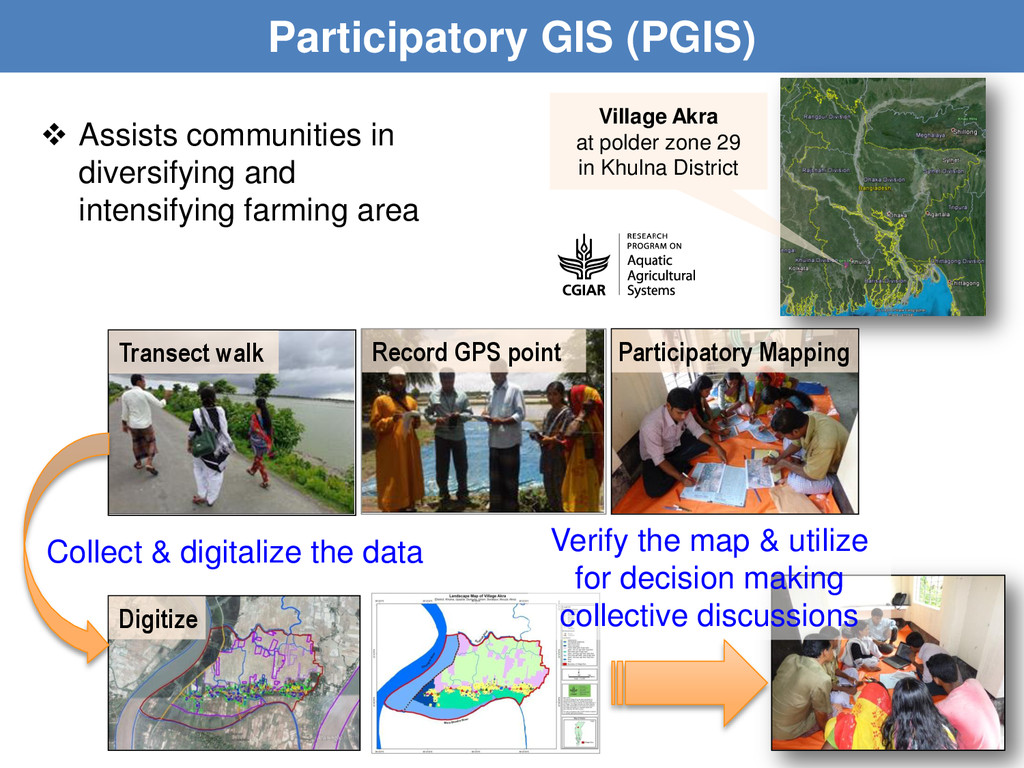
farming area Village Akra at polder zone 29 in Khulna District Transect walk Record GPS point Participatory Mapping Collect & digitalize the data Verify the map & utilize for decision making collective discussions Digitize
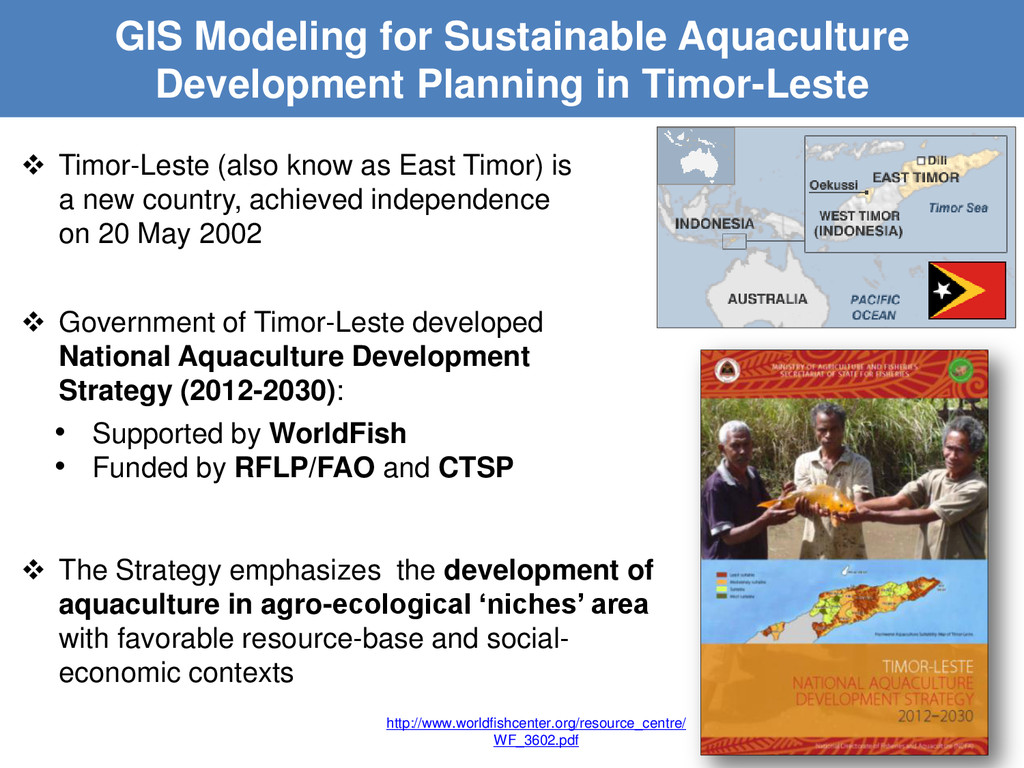
WF_3602.pdf Timor-Leste (also know as East Timor) is a new country, achieved independence on 20 May 2002 Government of Timor-Leste developed National Aquaculture Development Strategy (2012-2030): • Supported by WorldFish • Funded by RFLP/FAO and CTSP The Strategy emphasizes the development of aquaculture in agro-ecological ‘niches’ area with favorable resource-base and social- economic contexts
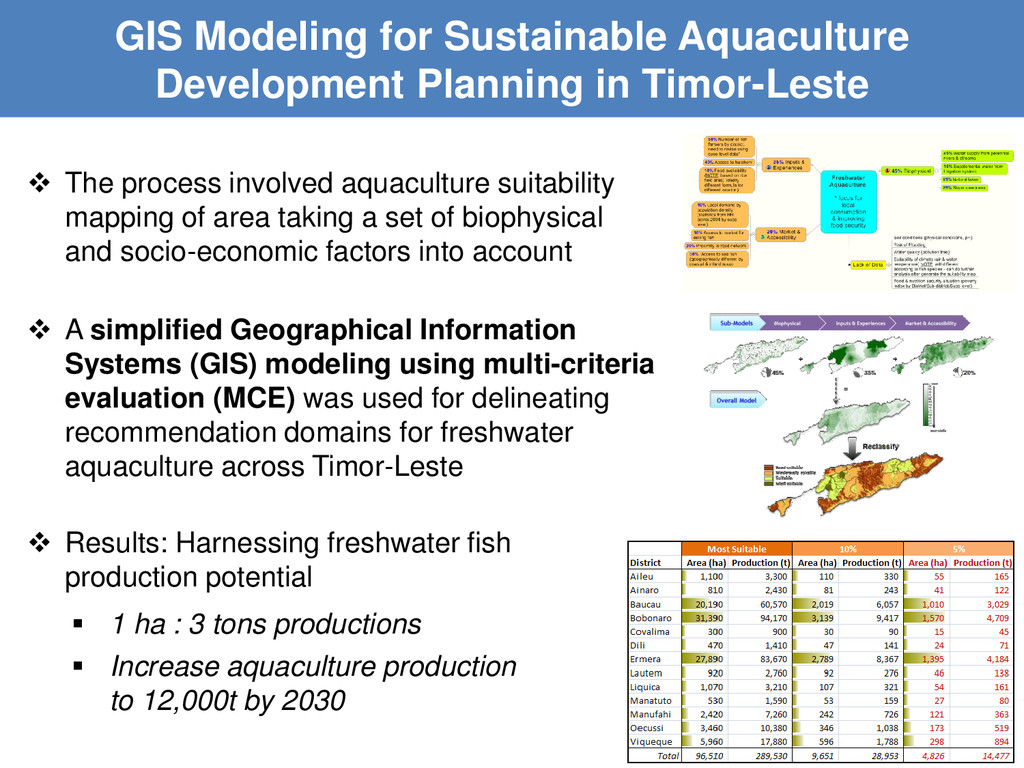
a set of biophysical and socio-economic factors into account GIS Modeling for Sustainable Aquaculture Development Planning in Timor-Leste 1 ha : 3 tons productions Increase aquaculture production to 12,000t by 2030 Results: Harnessing freshwater fish production potential A simplified Geographical Information Systems (GIS) modeling using multi-criteria evaluation (MCE) was used for delineating recommendation domains for freshwater aquaculture across Timor-Leste
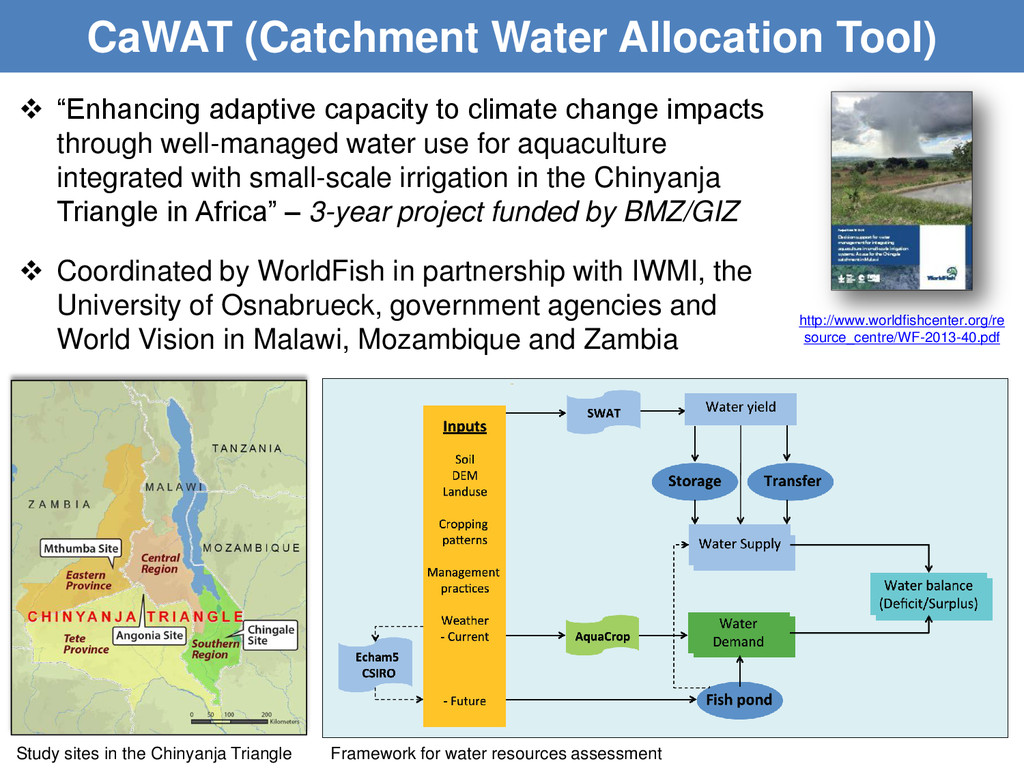
climate change impacts through well-managed water use for aquaculture integrated with small-scale irrigation in the Chinyanja Triangle in Africa” – 3-year project funded by BMZ/GIZ Coordinated by WorldFish in partnership with IWMI, the University of Osnabrueck, government agencies and World Vision in Malawi, Mozambique and Zambia Study sites in the Chinyanja Triangle Framework for water resources assessment http://www.worldfishcenter.org/re source_centre/WF-2013-40.pdf
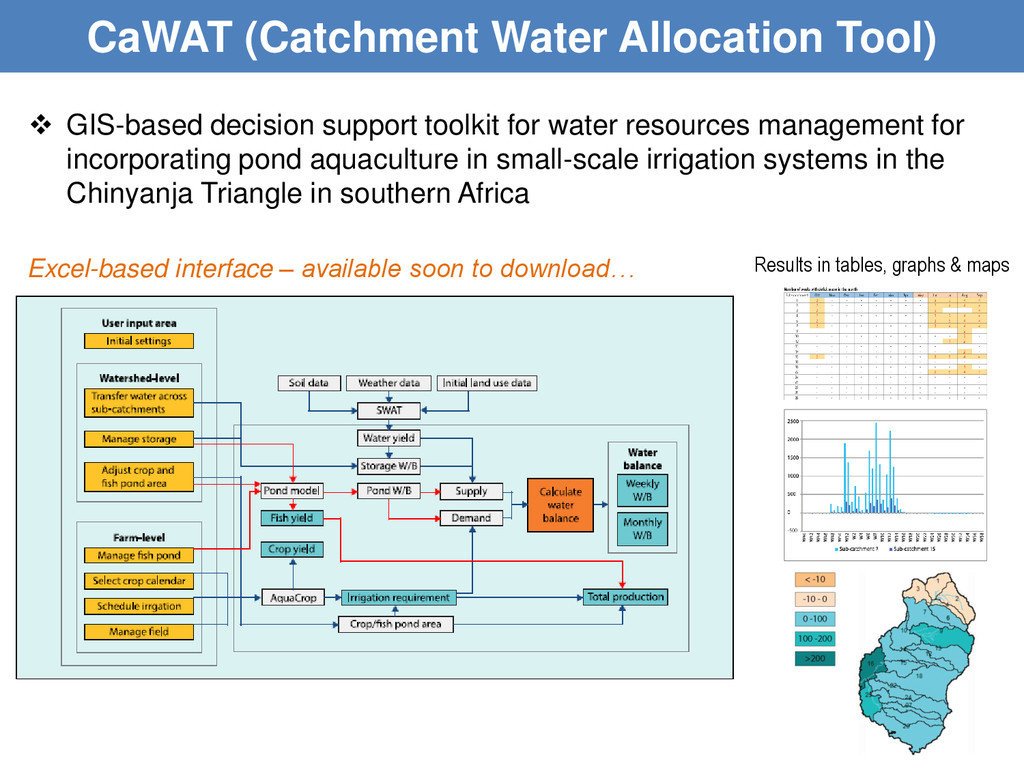
for water resources management for incorporating pond aquaculture in small-scale irrigation systems in the Chinyanja Triangle in southern Africa Excel-based interface – available soon to download… Results in tables, graphs & maps
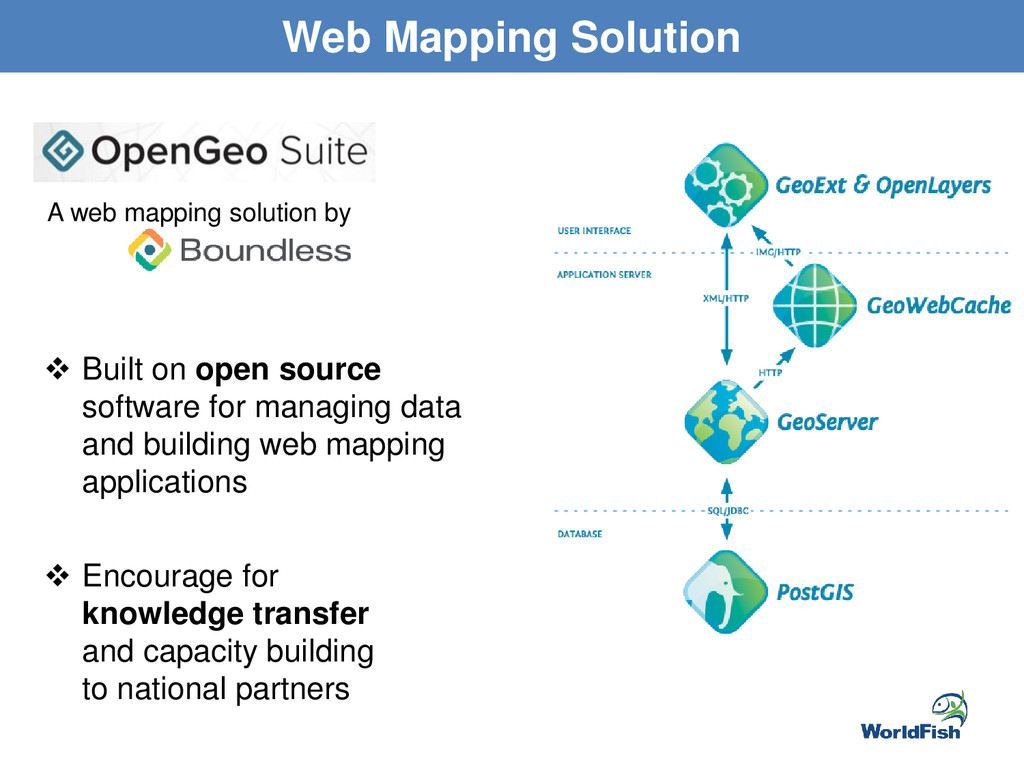
on open source software for managing data and building web mapping applications Encourage for knowledge transfer and capacity building to national partners
![Thank You Shwu Jiau TEOH [email protected]](https://files.speakerdeck.com/presentations/41715530255a01326e4b064769dcc1c7/slide_14.jpg)