Upgrade to Pro — share decks privately, control downloads, hide ads and more …

Education and Pedagogy of Domain-Specific Learning Materials Using Learning Personas

Education and Pedagogy of Domain-Specific Learning Materials Using Learning Personas

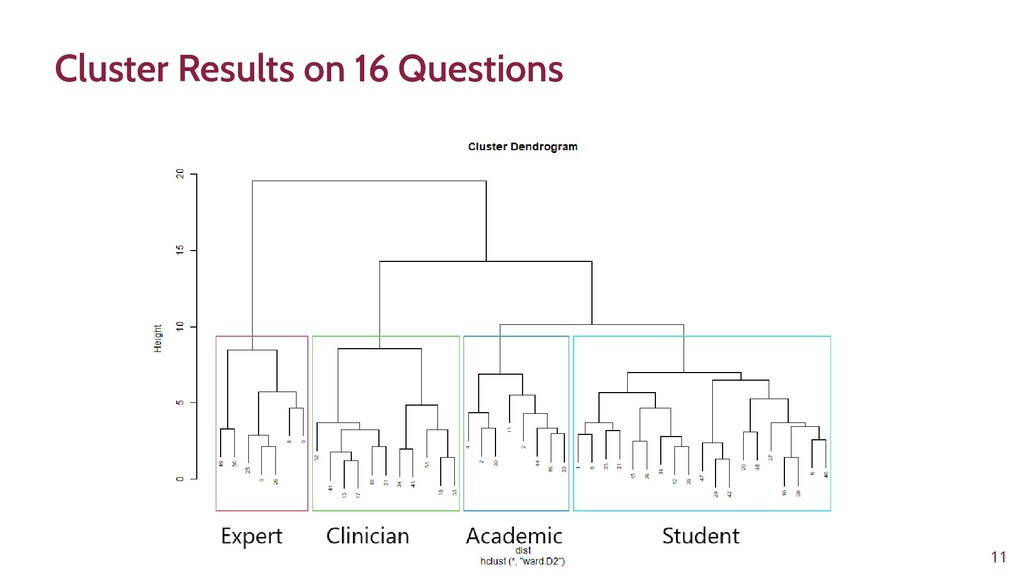
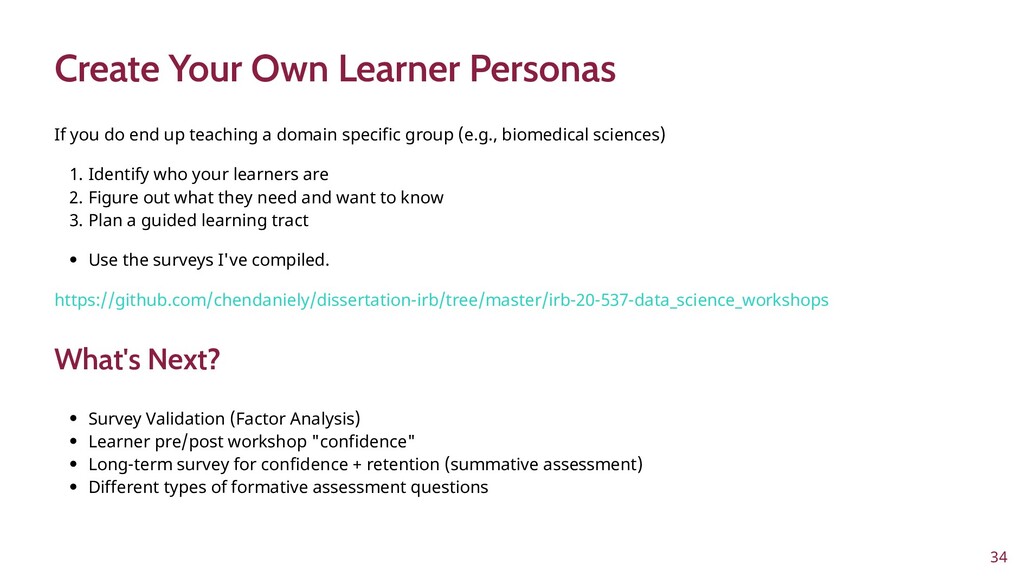
To improve learner engagement, it is necessary to have teaching and learning materials that resonate, are relevant, and are at the appropriate level for learners to motivate and support their learning in a difficult skill. A self-assessment survey was created to identify learner personas in biomedical data science and establish knowledge baseline and knowledge gaps in a population of learners. Hierarchical clustering was used to identify 4 personas: Experts, Clinicians, Academics, and Students. These personas and survey results were validated and used to create a content series on biomedical data science, which were evaluated to see if there was an improvement in learner's confidence in completing and meeting learning objectives. This work seeks to fill a technical skill gap, along with workforce development, and promote multidisciplinary collaborative teams by teaching the skills and jargon used in data science. This work also seeks to provide future educators with a roadmap of creating learner personas when creating new bodies of teaching materials relevant to data science.

Daniel Chen

August 11, 2021
Tweet

More Decks by Daniel Chen

Other Decks in Education

Transcript

  1. Education and Pedagogy of Domain-Specific Learning Materials Using Learning Personas

    JSM 2021: Classroom Teaching and Pedagogy Session Daniel Chen, MPH Anne Brown, PhD 2021-08-11
  2. Assistant Professor Biochemistry and Data Science Molecular Modeling & Drug

    Design Applied Data Science & Education Bevan Brown Lab + DataBridge Committee Chair: Anne Brown, PhD 2
  3. PhD Candidate: Virginia Tech (Winter 2021) Data Science education &

    pedagogy Medical, Biomedical, Health Sciences Inten at RStudio, 2019 gradethis Code grader for learnr documents The Carpentries Instructor, 2014 Trainer, 2020 Community Maintainer Lead, 2020 Workshop Instructor R + Python! Hello! 3
  4. Data Science education is a commodity Content is not an

    issue Domain experts can help learners improve data literacy Kross, S., Peng, R. D., Caffo, B. S., Gooding, I., and Leek, J. T. (2020). The Democratization of Data Science Education. The American Statistician, 74(1), 1–7. https://doi.org/10.1080/00031305.2019.1668849 6
  5. Why Domain Specificity? Democratization of data science education enables more

    domain specific learning materials You learn better when things are more relevant Internal factors for motivation Create feedback loops for learning Self-directed learners Koch, C., and Wilson, G. (2016). Software carpentry: Instructor Training. https://doi.org/10.5281/zenodo.57571 Kross, S., Peng, R. D., Caffo, B. S., Gooding, I., and Leek, J. T. (2020). The Democratization of Data Science Education. The American Statistician, 74(1), 1–7. https://doi.org/10.1080/00031305.2019.1668849 Wilson, G. (2019). Teaching tech together: How to make your lessons work and build a teaching community around them. CRC Press. 7
  6. Concept Maps Can also use "task deconstruction" Dreyfus model of

    skill acquisition Novice, Competent, Proficient, Expert, Master What Do Our Learners Know? Dreyfus, S. E., and Dreyfus, H. L. (1980). A five-stage model of the mental activities involved in directed skill acquisition. California Univ Berkeley Operations Research Center. Koch, C., and Wilson, G. (2016). Software carpentry: Instructor Training. https://doi.org/10.5281/zenodo.57571 Wilson, G. (2019). Teaching tech together: How to make your lessons work and build a teaching community around them. CRC Press. 9
  7. Identify Learners: Learner Self-Assessment Survey VT IRB-20-537 Surveys: https://github.com/chendaniely/dissertation-irb/tree/master/irb-20-537-data_science_workshops Currently

    working on survey validation Combination of: The Carpentries surveys: https://carpentries.org/assessment/ "How Learning Works: Seven Research-Based Principles for Smart Teaching" by Susan A. Ambrose, Michael W. Bridges, Michele DiPietro, Marsha C. Lovett, Marie K. Norman "Teaching Tech Together" by Greg Wilson 1. Demographics (6) 2. Programs Used in the Past (1) 3. Programming Experience (6) 4. Data Cleaning and Processing Experience (4) 5. Project and Data Management (2) 6. Statistics (4) 7. Workshop Framing and Motivation (3) 8. Summary Likert (7) 10
  8. The Personas Clare Clinician, Samir Student, Patricia Programmer, Alex Academic

    https://ds4biomed.tech/who-is-this-book-for.html#the-personas 12
  9. 13

  10. Planning the Learning Materials Learning objectives: 1. Name the features

    of a tidy/clean dataset 2. Transform data for analysis 3. Identify when spreadsheets are useful 4. Assess when a task should not be done in a spreadsheet software 5. Break down data processing into smaller individual (and more manageable) steps 6. Construct a plot and table for exploratory data analysis 7. Build a data processing pipeline that can be used in multiple programs 8. Calculate, interpret, and communicate an appropriate statistical analysis of the data 15
  11. Anderson, L. W., Bloom, B. S., and others. (2001). A

    taxonomy for learning, teaching, and assessing: A revision of Bloom’s taxonomy of educational objectives. Longman,. 16
  12. Wickham, H. (2014). Tidy Data. Journal of Statistical Software, 59(1),

    1–23. https://doi.org/10.18637/jss.v059.i10 19
  13. Wickham, H. (2014). Tidy Data. Journal of Statistical Software, 59(1),

    1–23. https://doi.org/10.18637/jss.v059.i10 20
  14. Example Data Science Problem post_Q5.1: Cytomegalovirus (CMV) is a common

    virus that normally does not cause any problems in the body. However, it can be of concern for those who are pregnant or immunocompromised. Suppose you have the following Cytomegalovirus dataset of CMV reactivation among patients after Allogenetic Hematopoietic Stem Cell Transplant (HSCT) in an Excel sheet (first 10 rows shown below): It is believed that the donor activating KIR genotype is a contributing factor for CMV reactivation after myeloablastive allogenetic HSCT. What variables are associated with CMV reactivation? Data from: Peter Higgins (2021). medicaldata: Data package for Medical Datasets. R package version 0.1.0. https://github.com/higgi13425/medicaldata 22
  15. Q1 Load the excel sheet # load library library(tidyverse) library(readxl)

    # use a library function # know about paths # variable assignment # function arguments dat <- read_excel("./data/cmv.xlsx") 23
  16. Q2 Filter the data for individuals over the age of

    65 # pipes, data filtering, boolean conditions dat %>% filter(age > 65) Q3 Save filtered dataset as an Excel file to send to a colleague # saving intermediates for data pipelines subset <- dat %>% filter(age > 65) # using functions/methods library(writexl) subset %>% write_xlsx("./data/cmv_65.xlsx") 24
  17. Dirty Tidy Q4 Tidy the dataset so we have a

    donor CMV status and a patient CMV status in separate columns # lists/vectors/selecting # tidy data and recognize a melt/pivot_longer operation # keyword arguments tidy_dat <- dat %>% pivot_longer(starts_with("donor"), names_to = "donor_status", values_to = "recipient_status") %>% drop_na() 25
  18. Q5 Plot a histogram of the age distribution of our

    data library(ggplot2) # plotting syntax # layering ggplot(tidy_dat, aes(x = age)) + geom_histogram() 26
  19. Q6 Fit a model (e.g., logistic regression) to see which

    variables are associated with patient CMV reactivation. # formula syntax model <- glm(cmv ~ age + prior_radiation + aKIRs + donor_status, data = tidy_dat, family = "binomial") # look at model results summary(model) # dataframe of coefficients library(broom) tidy(model) 27
  20. Canterbury QuestionBank Suppose you try to perform a binary search

    on a 5-element array sorted in the reverse order of what the binary search algorithm expects. How many of the items in this array will be found if they are searched for? A. 5 B. 0 C. 1 D. 2 E. 3 Explanation: C: Only the middle element will be found. The remaining elements will not be contained in the subranges that we narrow our search to. Software engineering, with some ventures into software architecture and computing education: https://neverworkintheory.org/ 29
  21. R for Data Science 1. Welcome Introduction 2. Explore Introduction

    3. Data visualisation 4. Workflow: basics 5. Data transformation 6. Workflow: scripts 7. Exploratory Data Analysis 8. Workflow: projects 9. Wrangle Introduction 10. Tibbles 11. Data import 12. Tidy data ... Ch 21. iteration Data Science for JavaScript 1. Introduction 2. Basic Features 3. Callbacks 4. Objects and Classes 5. HTML and CSS 6. Manipulating Pages 7. Dynamic Pages 8. Visualizing Data 9. Promises 10. Interactive Sites 11. Managing Data 12. Creating a Server 13. Testing 14. Using Data-Forge 15. Capstone Project OpenIntro Statistics 1. Introduction to Data 2. Summarizing data 3. Probability 4. Distributions of random variables 5. Foundations of inference 6. Inference for categorical data 7. Inference for numerical data 8. Introduction to linear regression 9. Multiple and logistic regression Existing Data Science Book TOC: R + JS + Stats 31
  22. Python for Data Analysis 1. Preliminaries 2. Introductory Examples 3.

    IPython: An Interactive Computing and Development Environment 4. NumPy Basics: Arrays and Vectorized Computation 5. Getting Started with pandas 6. Data Loading, Storage, and File Formats 7. Data Wrangling: Clean, Transform, Merge, Reshape 8. Plotting and Visualization 9. Data Aggregation and Group Operations 10. Time Series 11. Financial and Economic Data Applications 12. Advanced NumPy Appendix: Python Language Essentials Learning the Pandas Library 1. Introduction 2. Installation 3. Data Structures 4. Series 5. Series CRUD 6. Series Indexing 7. Series Methods 8. Series Plotting 9. Another Series Example 10. DataFrames 11. Data Frame Example 12. Data Frame Methods 13. Data Frame Statistics 14. Grouping, Pivoting, and Reshaping 15. Dealing With Missing Data 16. Joining Data Frames 17. Avalanche Analysis and Plotting Existing Data Science Book TOC: Python 32
  23. Pandas for Everyone 1. Pandas DataFrame Basics 2. Pandas Data

    Structures 3. Introduction to Plotting 4. Data Assembly 5. Missing Data 6. Tidy Data 7. Data Types 8. Strings and Text Data 9. Apply 10. Groupby Operations: Split–Apply– Combine 11. The datetime Data Type 12. Linear Models 13. Generalized Linear Models 14. Model Diagnostics 15. Regularization 16. Clustering ds4biomed 1. Introduction 2. Spreadsheets 3. R + RStudio 4. Load Data 5. Descriptive Calculations 6. Clean Data (Tidy) 7. Visualization (Intro) 8. Analysis (Intro) 9. Additional Resources Conference Workshop 1. Introduction 2. Tidy Data 3. Functions 4. Plotting/Modeling Existing Data Science Book TOC: My Own Work 33
  24. Create Your Own Learner Personas If you do end up

    teaching a domain specific group (e.g., biomedical sciences) 1. Identify who your learners are 2. Figure out what they need and want to know 3. Plan a guided learning tract Use the surveys I've compiled. https://github.com/chendaniely/dissertation-irb/tree/master/irb-20-537-data_science_workshops What's Next? Survey Validation (Factor Analysis) Learner pre/post workshop "confidence" Long-term survey for confidence + retention (summative assessment) Different types of formative assessment questions 34
  25. Dave Higdon Statistics Department Head Alex Hanlon Statistics CBHDS iTHRIV

    BERD Nikki Lewis Honors College Computational Research Grant Rest of the Committee 35
  26. Additional Resources Data Organization in Spreadsheets, Karl W. Broman &

    Kara H. Woo https://www.tandfonline.com/doi/full/10.1080/00031305.2017.1375989 Examples of other learner personas Rstudio Learner Personas: https://rstudio-education.github.io/learner-personas/ The Carpentries Learner Profiles: https://software-carpentry.org/audience/ Creating your own personas Zagallo, Patricia, Jill McCourt, Robert Idsardi, Michelle K Smith, Mark Urban-Lurain, Tessa C Andrews, Kevin Haudek, et al. 2019. “Through the Eyes of Faculty: Using Personas as a Tool for Learner-Centered Professional Development.” CBE—Life Sciences Education 18 (4): ar62. Bloom's Taxonomy Bloom's Taxonomy Verb Chart: https://tips.uark.edu/blooms-taxonomy-verb-chart/ Teach like a Champion Version 2.0's 62 Techniques: https://teachlikeachampion.com/wp-content/uploads/Teach-Like-a- Champion-2.0-Placemat-with-the-Nanango-Nine.pdf 36
  27. Joint departments Probability + Statistics Data Mining Programming Song, I.-Y.,

    and Zhu, Y. (2016). Big data and data science: What should we teach? Expert Systems, 33(4), 364–373. https://doi.org/10.1111/exsy.12130 39
  28. Representative Questions Q6.2: If you were given a dataset containing

    an individual's smoking status (binary variable) and whether or not they have hypertension (binary variable), would you know how to conduct a statistical analysis to see if smoking has in increased relative risk or odds of hypertension? Any type of model will suffice. 4 point scale If you don't know where to start, you may be a novice Q3.3: How familiar are you with interactive programming languages like Python or R? 7 point scale If you have at least installed it and done simple examples, you may be more of an expert Q4.4: Do you know what "long" and "wide" data are? 4 point scale If you have heard of the term you may be a student 40
  29. Summary Likert Questions 1. While working on a programming project,

    if I got stuck, I can find ways of overcoming the problem. 2. Using a programming language (like R or Python) can make my analysis easier to reproduce. 3. Using a programming language (like R or Python) can make me more efficient at working with data. 4. I know how to search for answers to my technical questions online 5. I can write a small program, script, or macro to address a problem in my own work. 6. I believe having access to the original, raw data is important to be able to repeat an analysis. 7. I am confident in my ability to make use of programming software to work with data. 41
  30. 42