Usability is a great way to enhance the effectiveness of your site, but in an age where an alternative option is only a click away, is it enough to keep your users engaged?
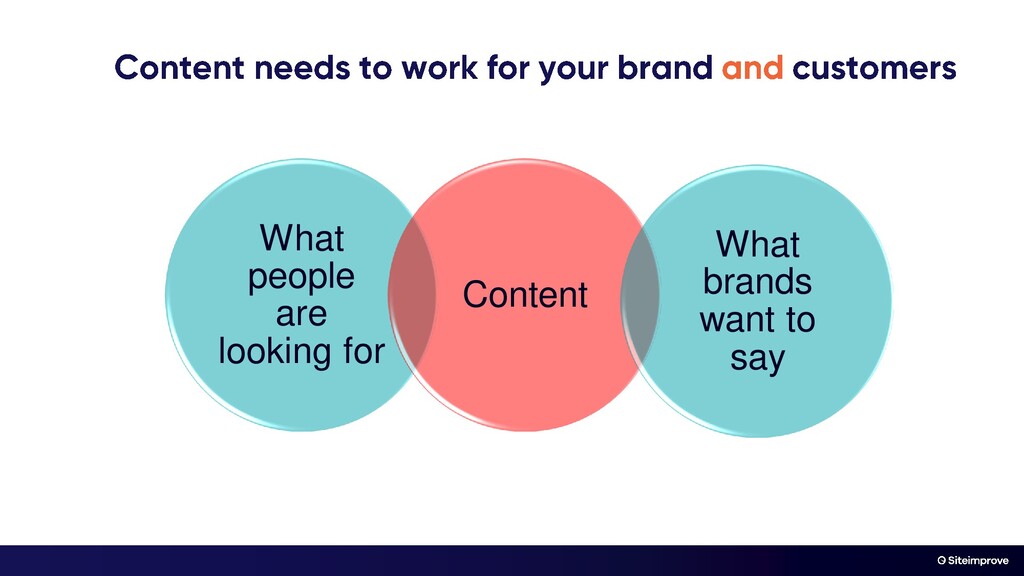
Great content is the foundation of your website. The content you produce plays a fundamental role in marketing campaigns and needs to work in tandem with both code and design. It's also what your customers want.
Chris and Dan will explain the fundamentals of creating persuasive design and impactful content, then share tips on how the two should work together for your business.
In this webinar you will learn:
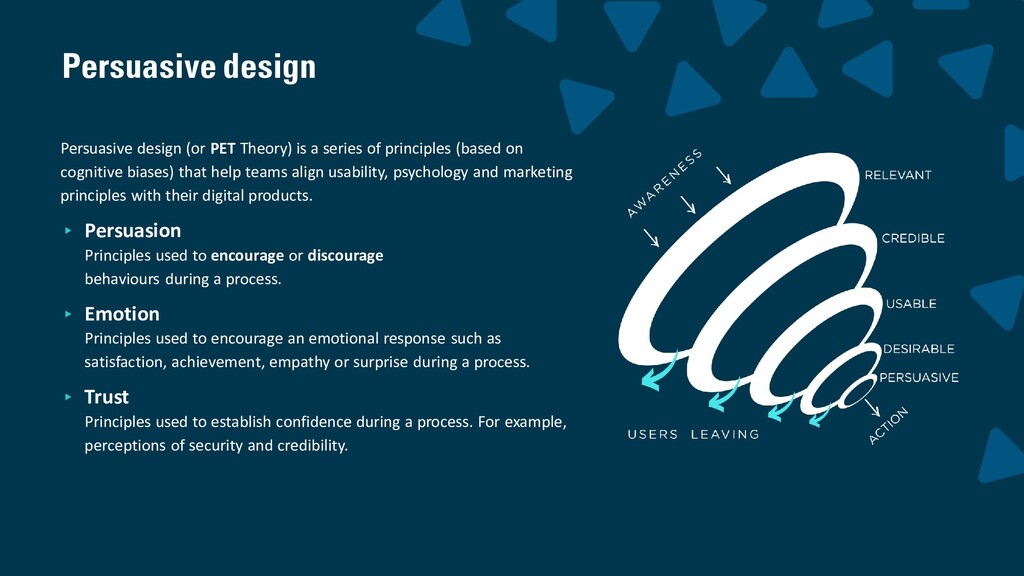
- Introduction to persuasive design
- How design can influence user behaviour
- The relationship between content and user experience
- How to define meaningful content
- Techniques to improve your website and services