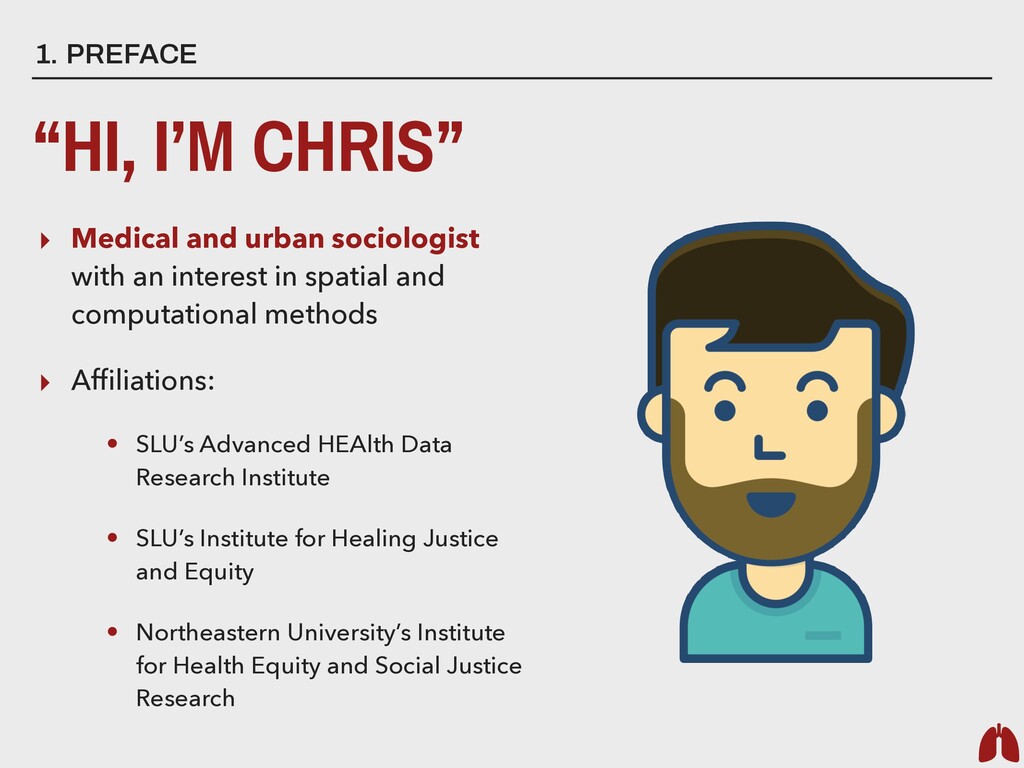
spatial and computational methods ▸ Af fi liations: • SLU’s Advanced HEAlth Data Research Institute • SLU’s Institute for Healing Justice and Equity • Northeastern University’s Institute for Health Equity and Social Justice Research 1. PREFACE “HI, I’M CHRIS”
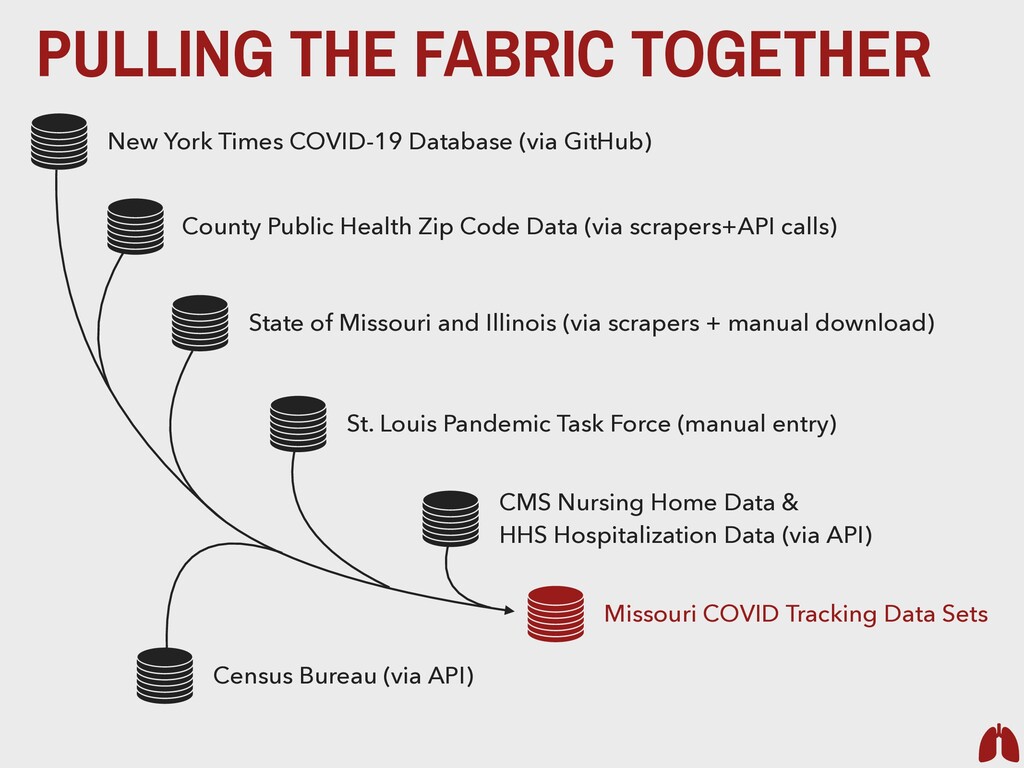
GitHub) State of Missouri and Illinois (via scrapers + manual download) Missouri COVID Tracking Data Sets St. Louis Pandemic Task Force (manual entry) CMS Nursing Home Data & HHS Hospitalization Data (via API) Census Bureau (via API) County Public Health Zip Code Data (via scrapers+API calls)
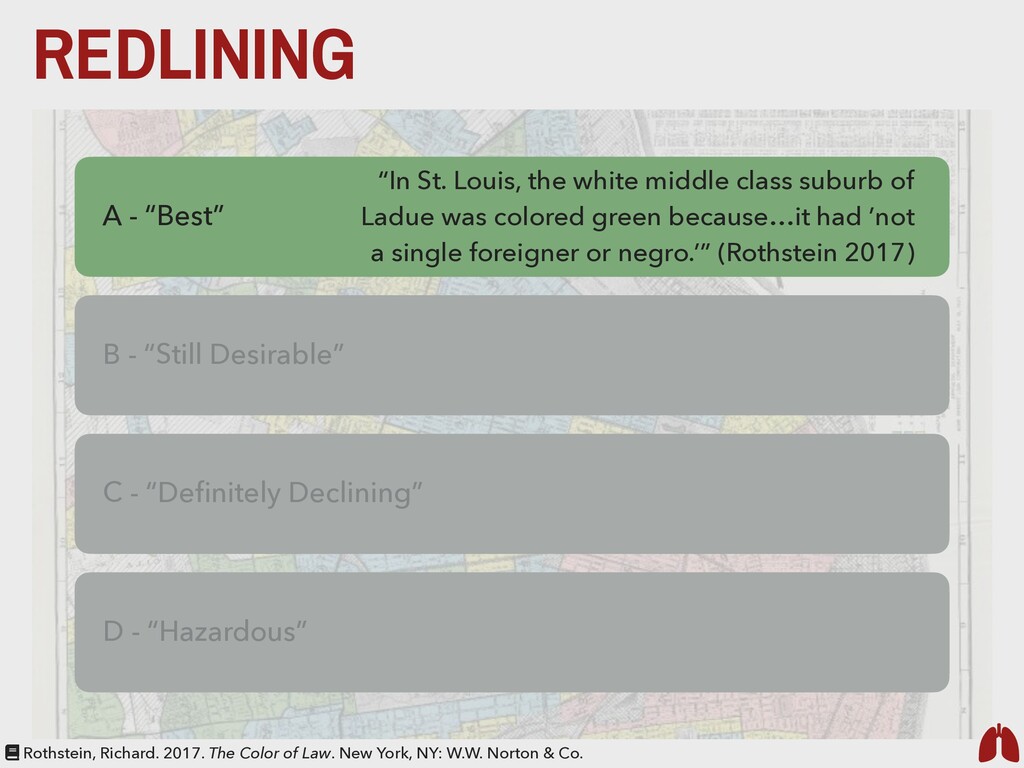
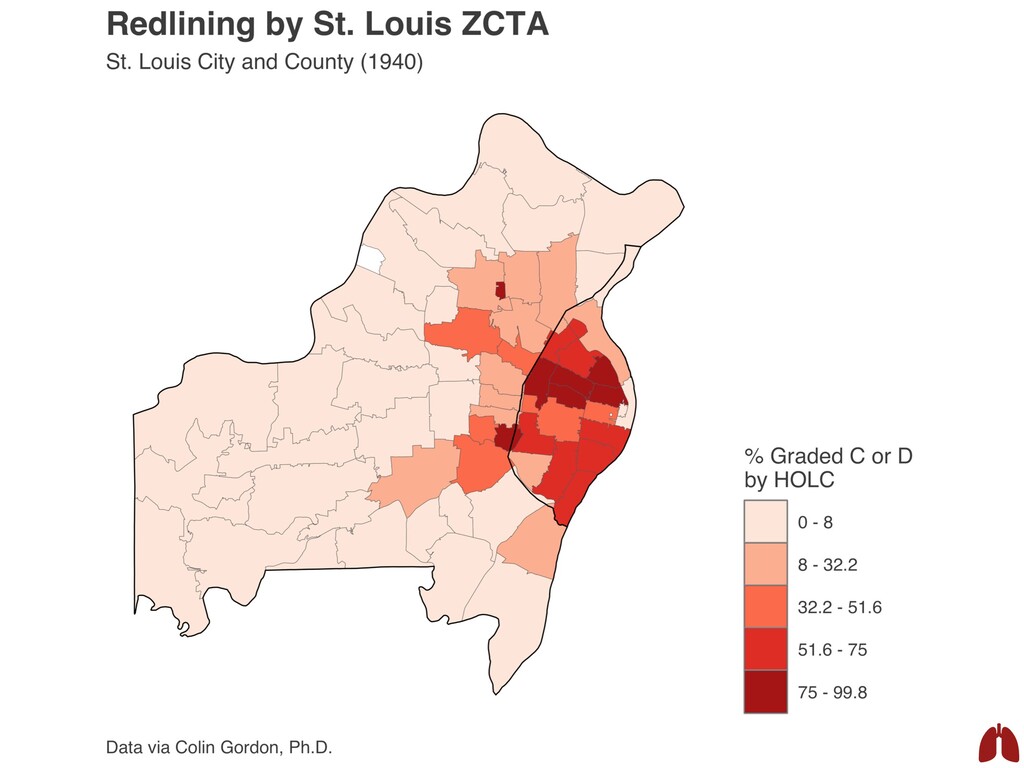
“De fi nitely Declining” D - “Hazardous” “In St. Louis, the white middle class suburb of Ladue was colored green because…it had ’not a single foreigner or negro.’” (Rothstein 2017) Rothstein, Richard. 2017. The Color of Law. New York, NY: W.W. Norton & Co.
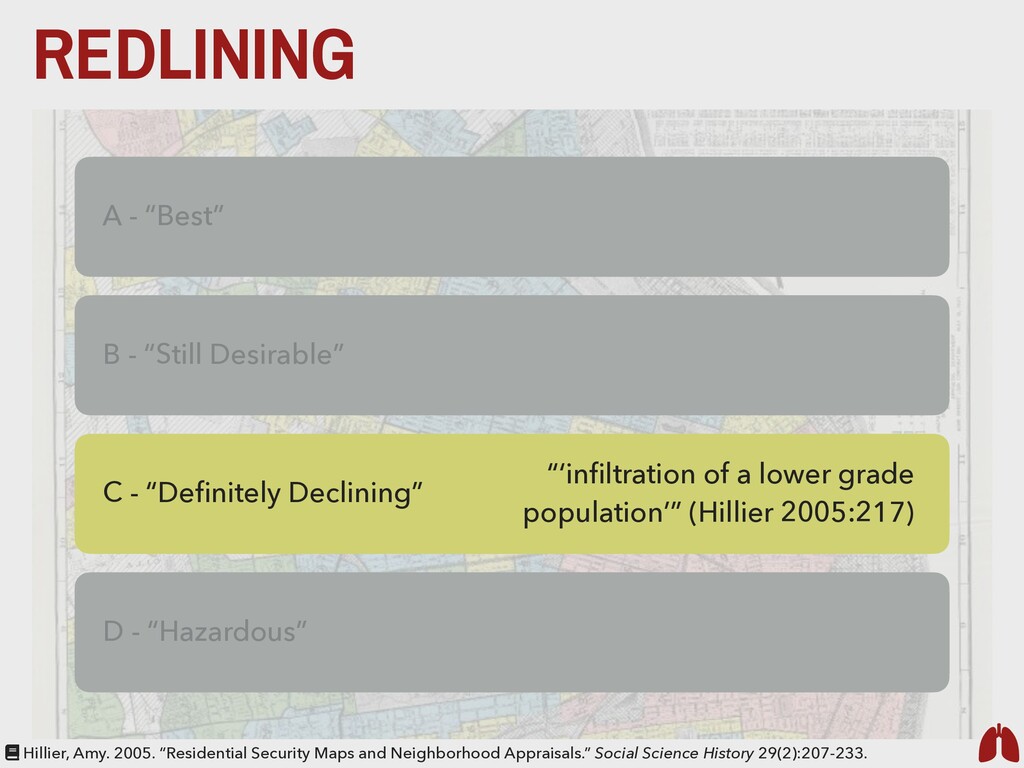
“Hazardous” C - “De fi nitely Declining” “‘in fi ltration of a lower grade population’” (Hillier 2005:217) Hillier, Amy. 2005. “Residential Security Maps and Neighborhood Appraisals.” Social Science History 29(2):207-233.
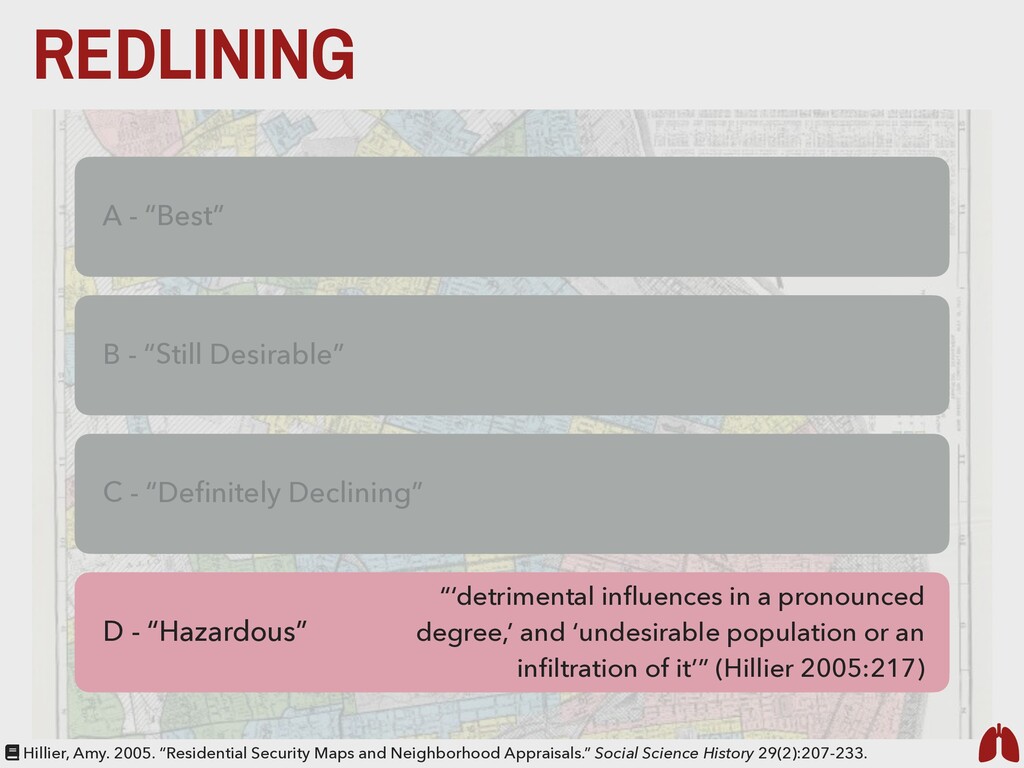
“De fi nitely Declining” D - “Hazardous” Hillier, Amy. 2005. “Residential Security Maps and Neighborhood Appraisals.” Social Science History 29(2):207-233. “‘detrimental in fl uences in a pronounced degree,’ and ‘undesirable population or an in fi ltration of it’” (Hillier 2005:217)
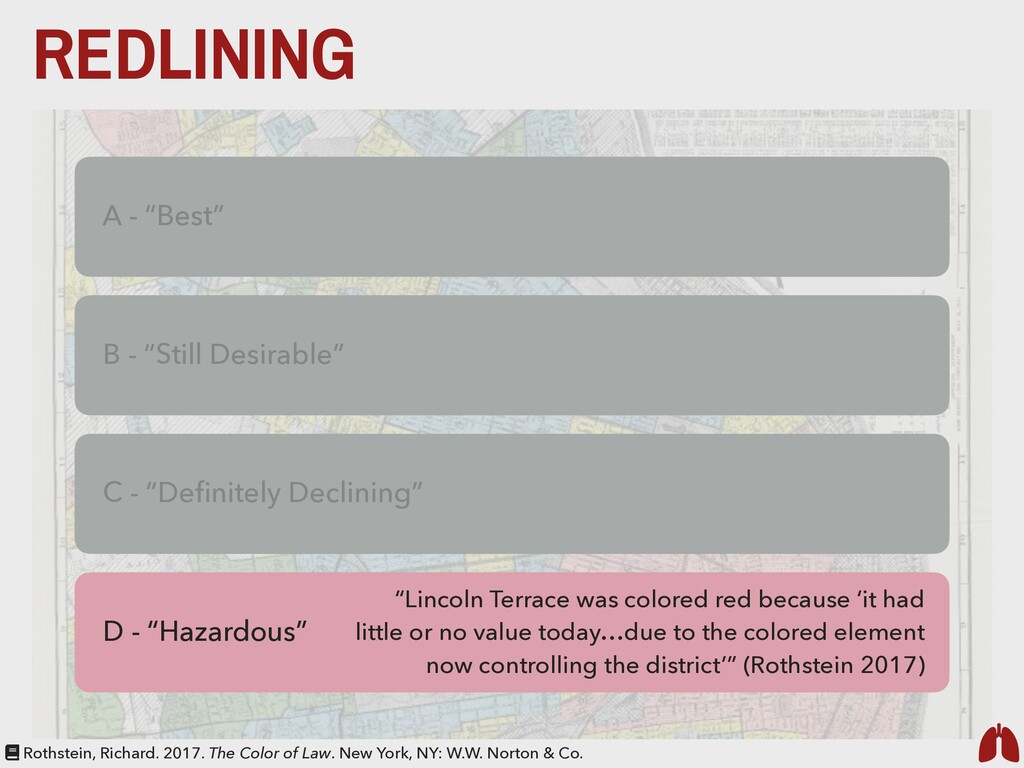
“De fi nitely Declining” D - “Hazardous” Rothstein, Richard. 2017. The Color of Law. New York, NY: W.W. Norton & Co. “Lincoln Terrace was colored red because ‘it had little or no value today…due to the colored element now controlling the district’” (Rothstein 2017)
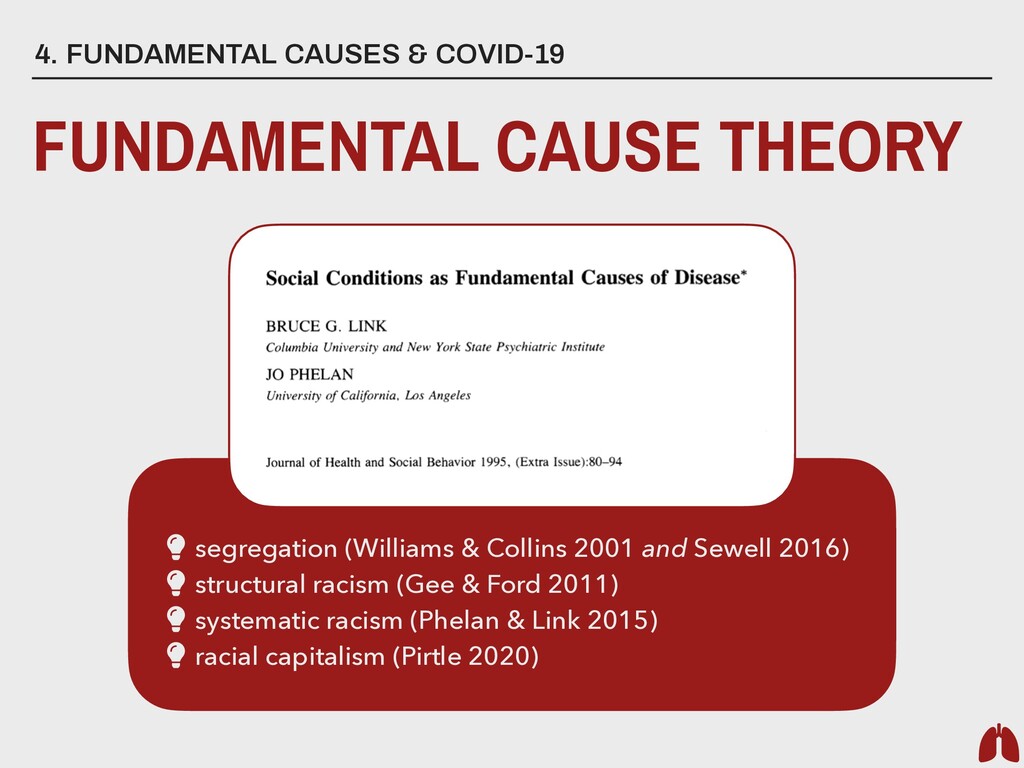
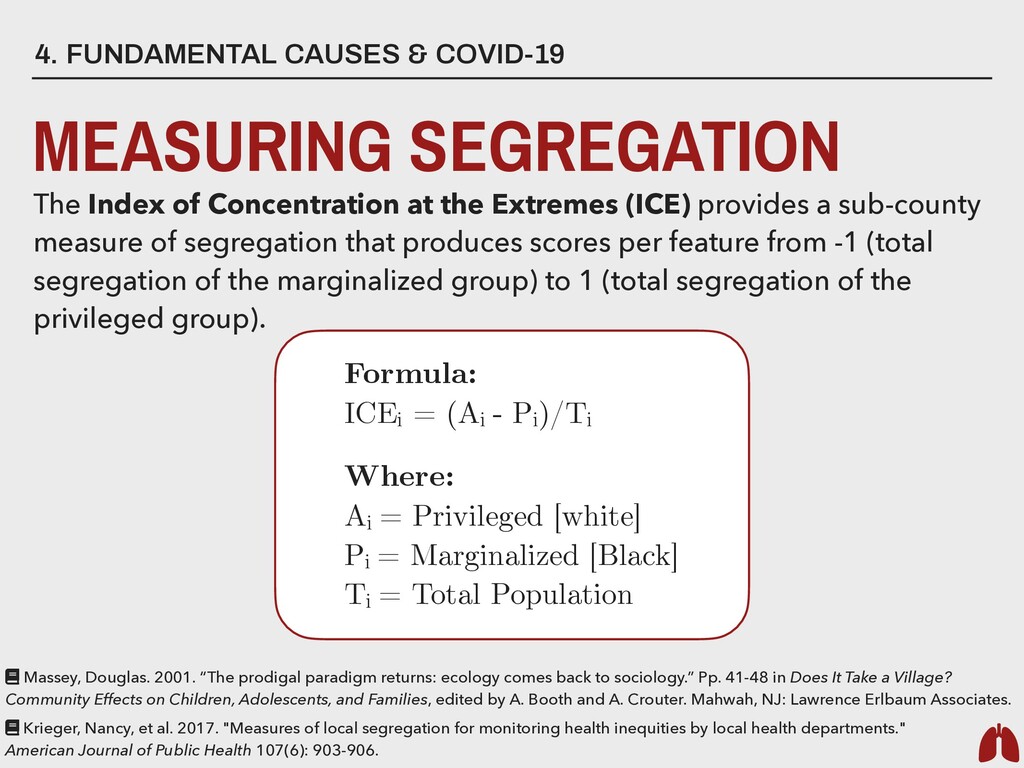
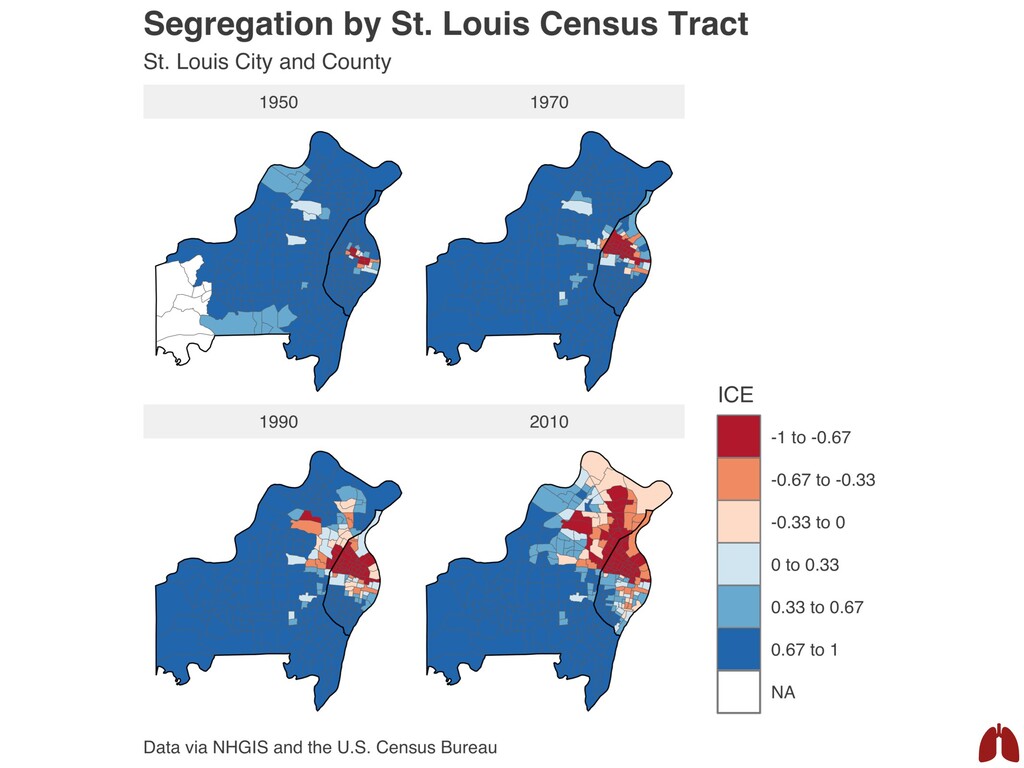
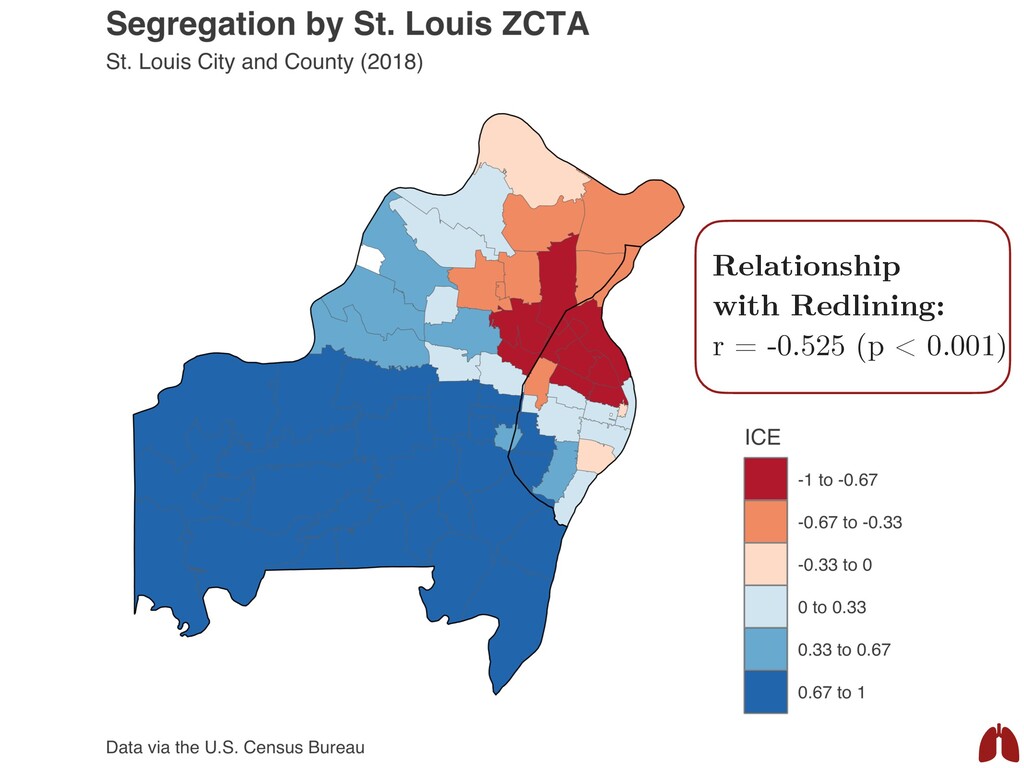
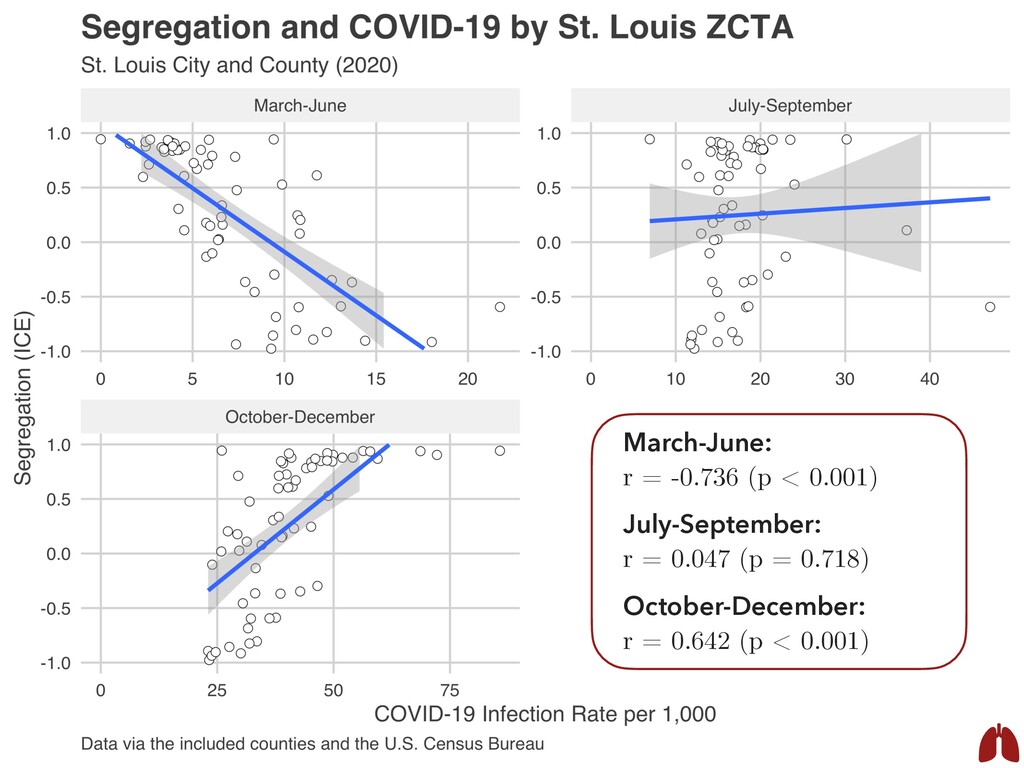
Concentration at the Extremes (ICE) provides a sub-county measure of segregation that produces scores per feature from -1 (total segregation of the marginalized group) to 1 (total segregation of the privileged group). Formula: ICEi = (Ai - Pi )/Ti Where: Ai = Privileged [white] Pi = Marginalized [Black] Ti = Total Population Massey, Douglas. 2001. “The prodigal paradigm returns: ecology comes back to sociology.” Pp. 41-48 in Does It Take a Village? Community Effects on Children, Adolescents, and Families, edited by A. Booth and A. Crouter. Mahwah, NJ: Lawrence Erlbaum Associates. Krieger, Nancy, et al. 2017. "Measures of local segregation for monitoring health inequities by local health departments." American Journal of Public Health 107(6): 903-906.
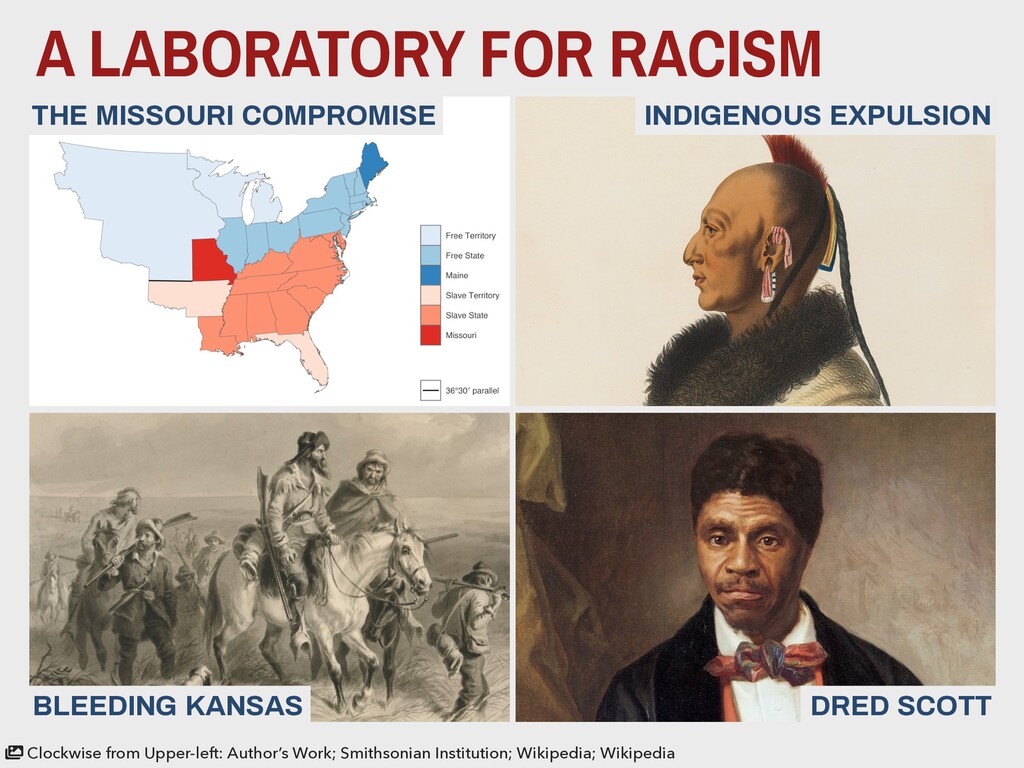
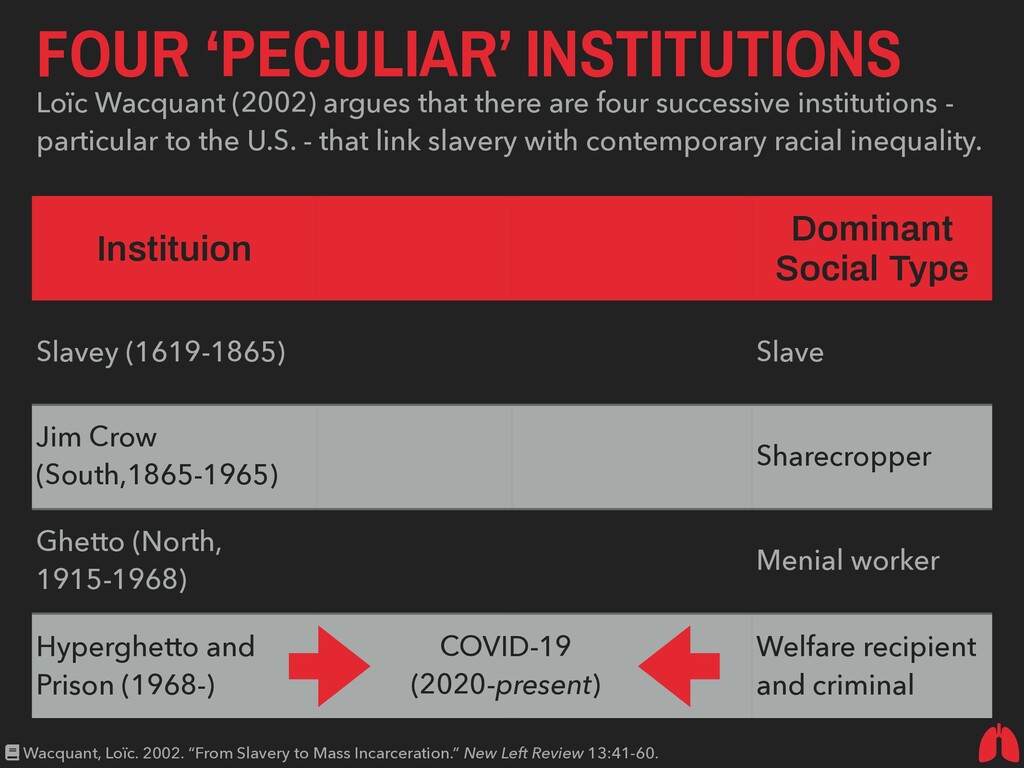
Dominant Social Type Slavey (1619-1865) Unfree fi xed labor Plantation Slave Jim Crow (South,1865-1965) Free fi xed labor Agrarian and extractive Sharecropper Ghetto (North, 1915-1968) Free mobile labor Industrial manufacturing Menial worker Hyperghetto and Prison (1968-) Fixed surplus labor Postindustrial services Welfare recipient and criminal Loïc Wacquant (2002) argues that there are four successive institutions - particular to the U.S. - that link slavery with contemporary racial inequality. COVID-19 (2020-present) Wacquant, Loïc. 2002. “From Slavery to Mass Incarceration.” New Left Review 13:41-60.
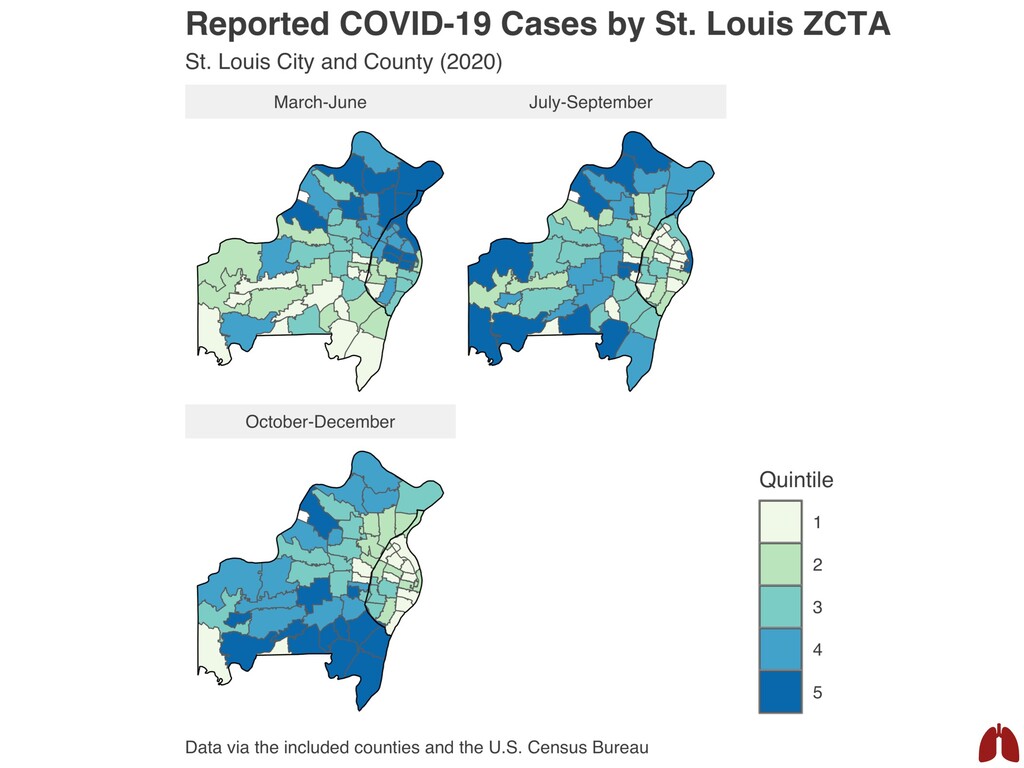
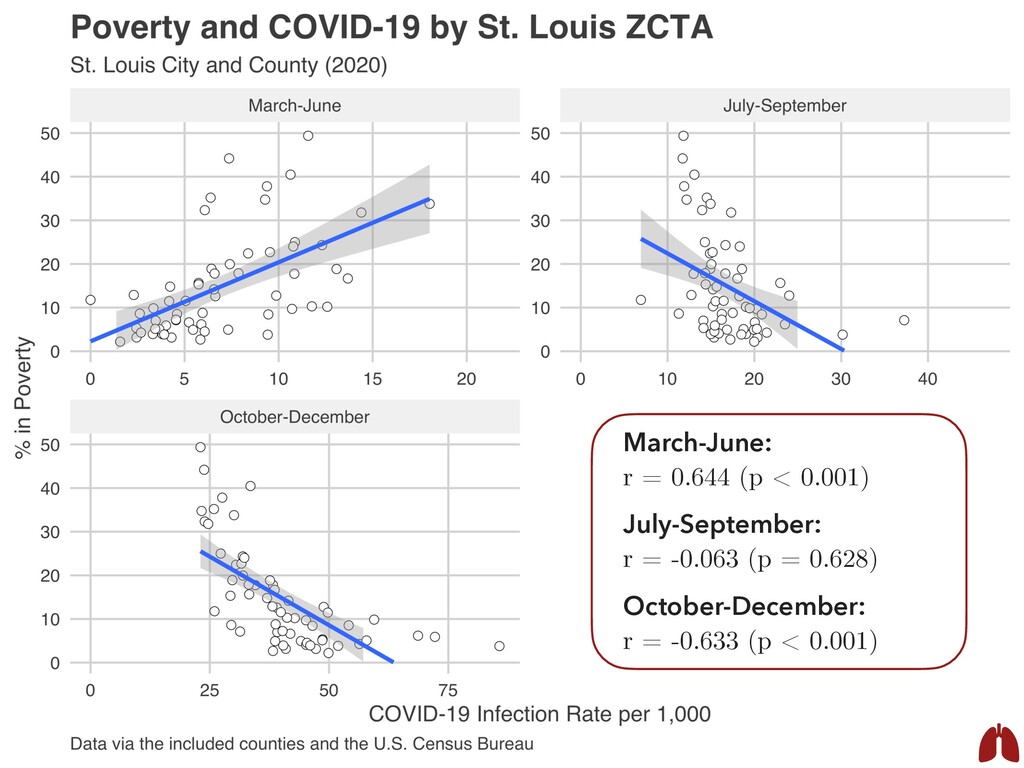
data, and communication have not been the most pressing concerns for local public health agencies in MO. ▸ Public science and public sociology can help cut through the most pressing issues we face right now - COVID, racism, poverty. ▸ COVID-19 patterns that appear durable as cross-sections have important period effects that we need to interrogate. ▸ We need to focus on how power relations in fl uence COVID risk. ▸ Iterating on analyses is not something we always get to do, but it is tremendously gratifying.
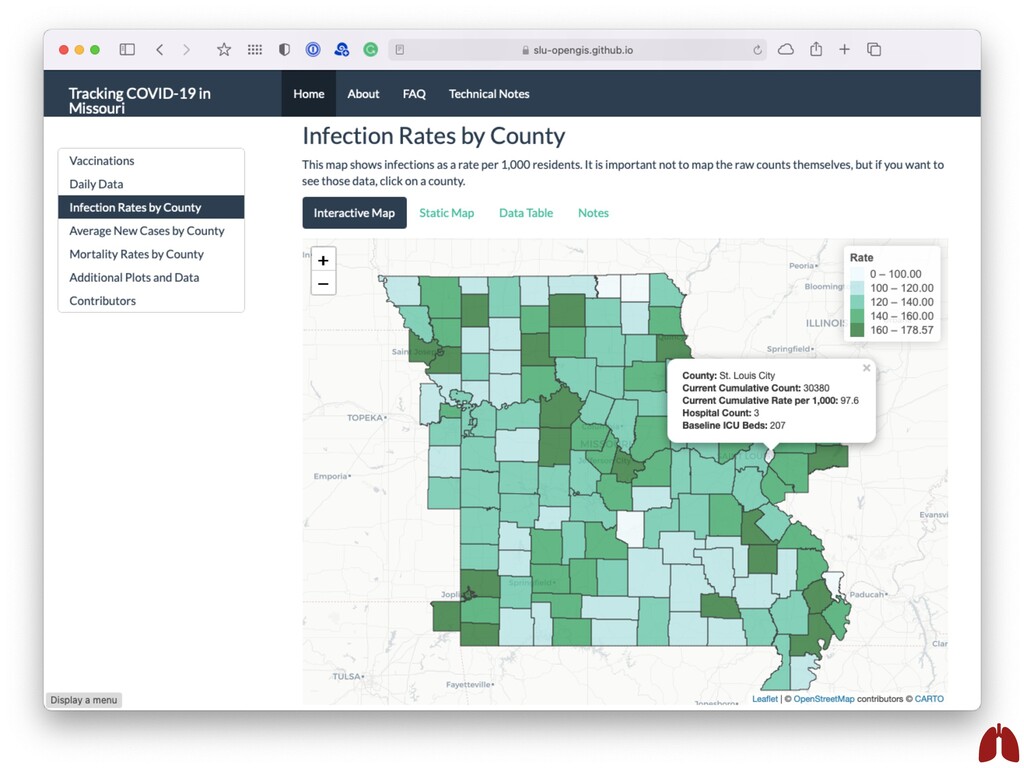
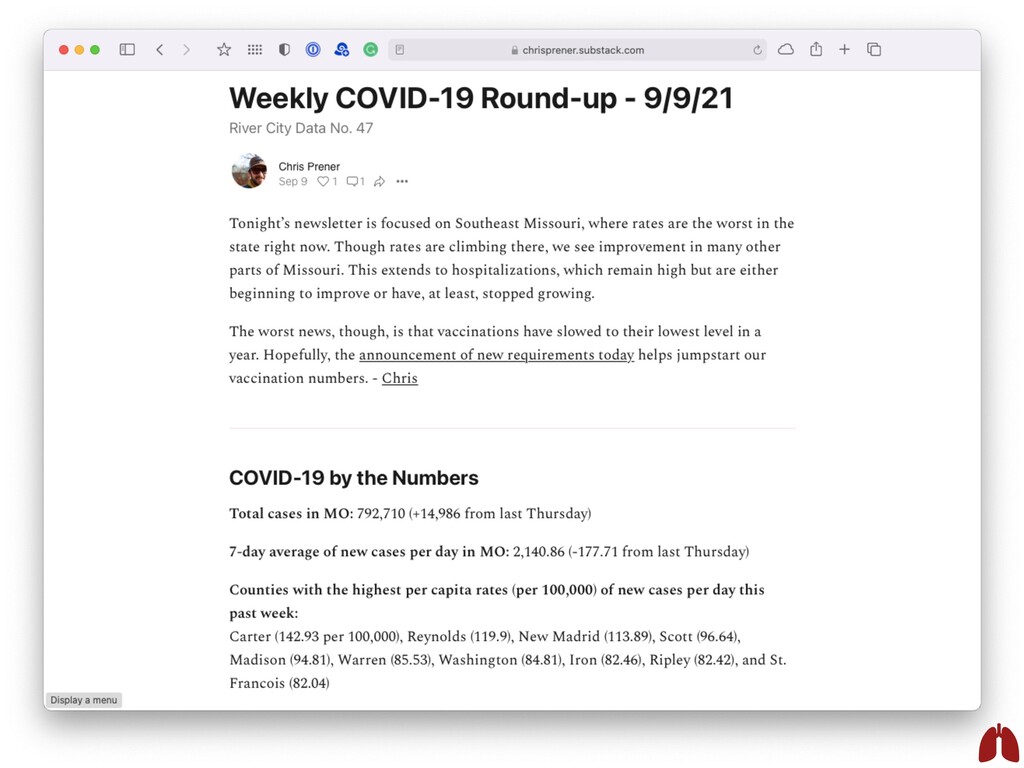
speakerdeck.com/chrisprener/ fundamental-causes-ances Raw data, code available via GitHub github.com/slu-openGIS/ MO_HEALTH_Covid_Tracking [email protected] chris-prener.github.io LEARN MORE THANKS FOR COMING! @chrisprener Visualization code available via GitHub github.com/slu-openGIS/ covid_daily_viz slu-opengis.github.io/ covid_daily_viz/ chrisprener.substack.com