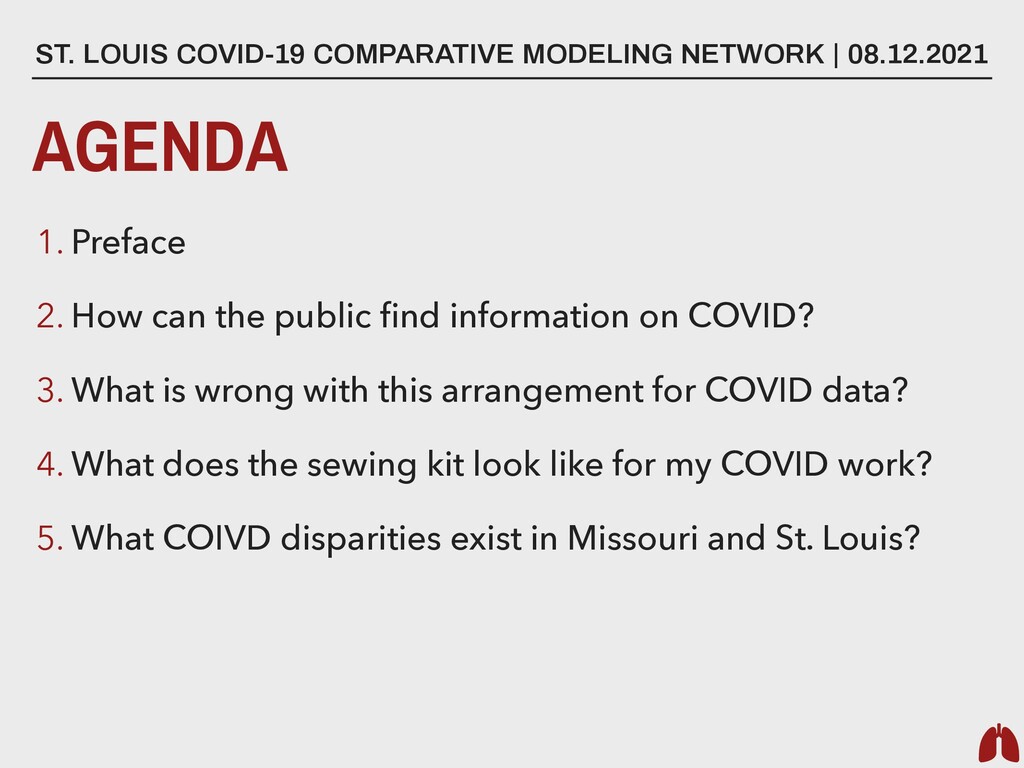
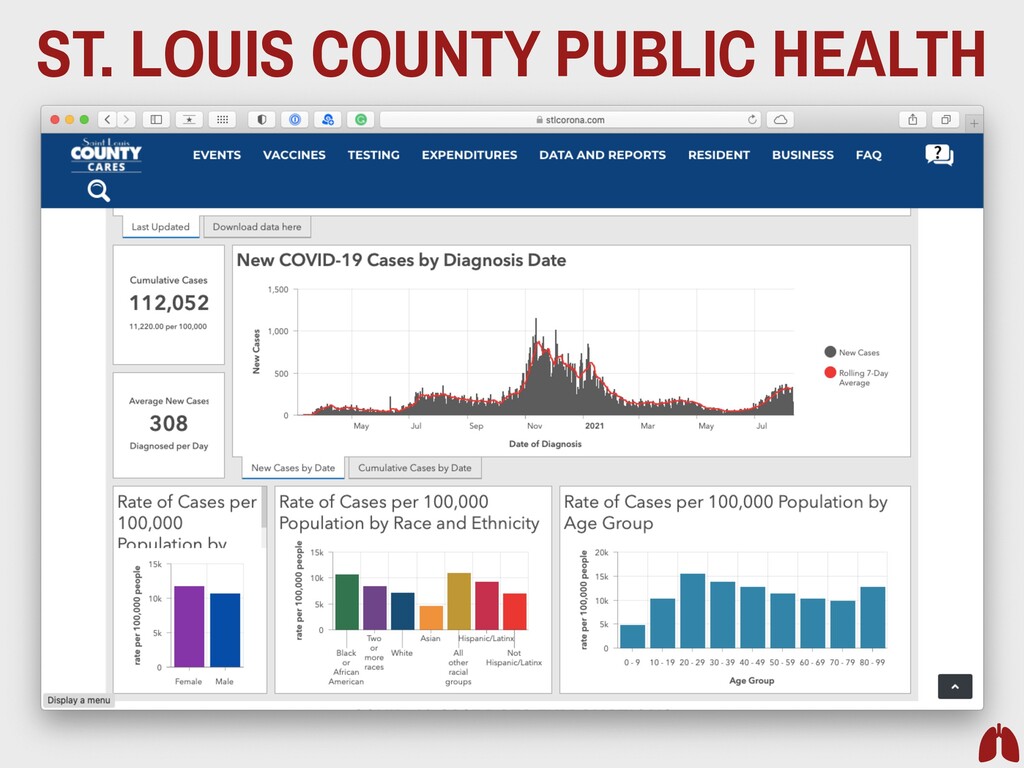
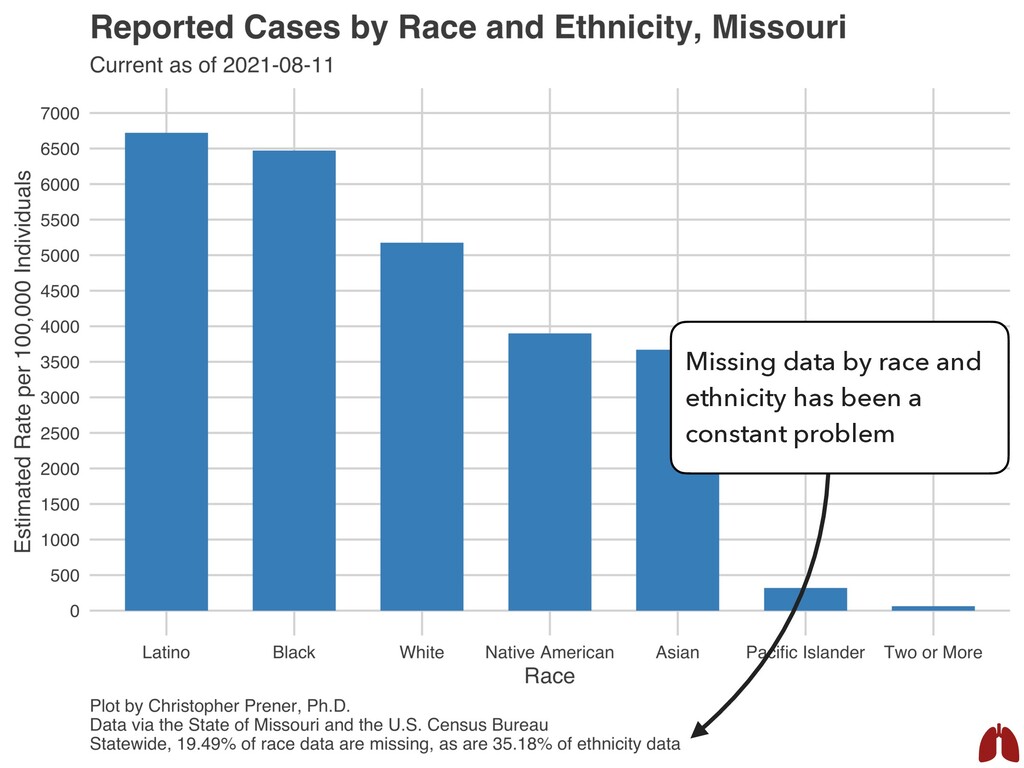
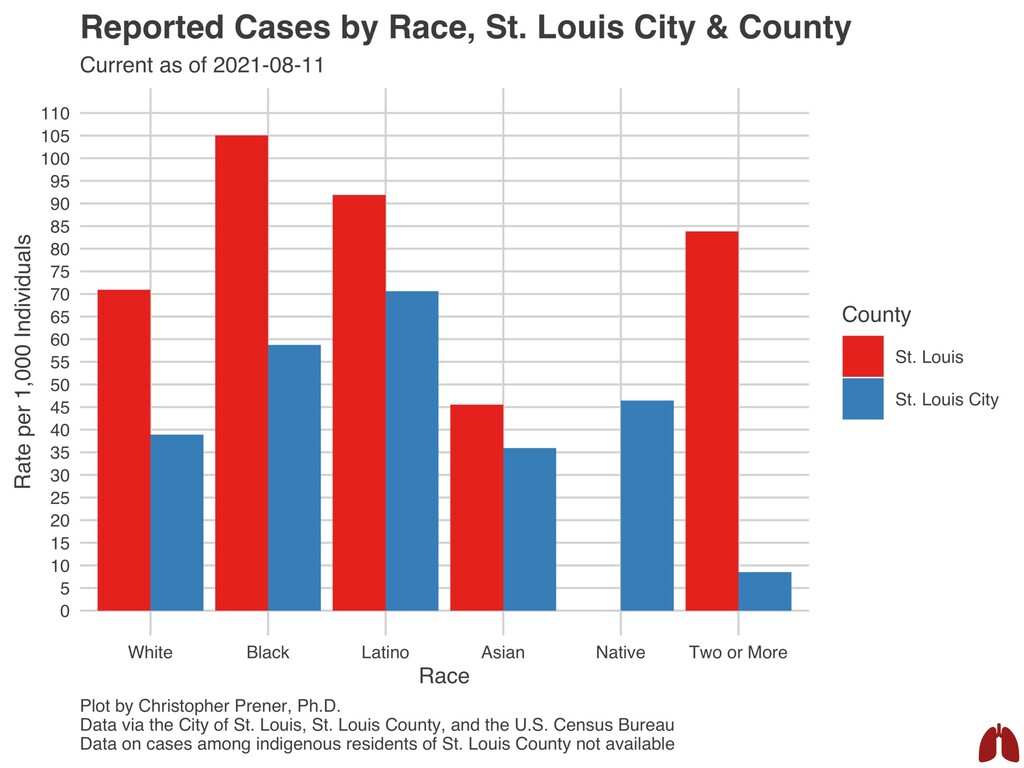
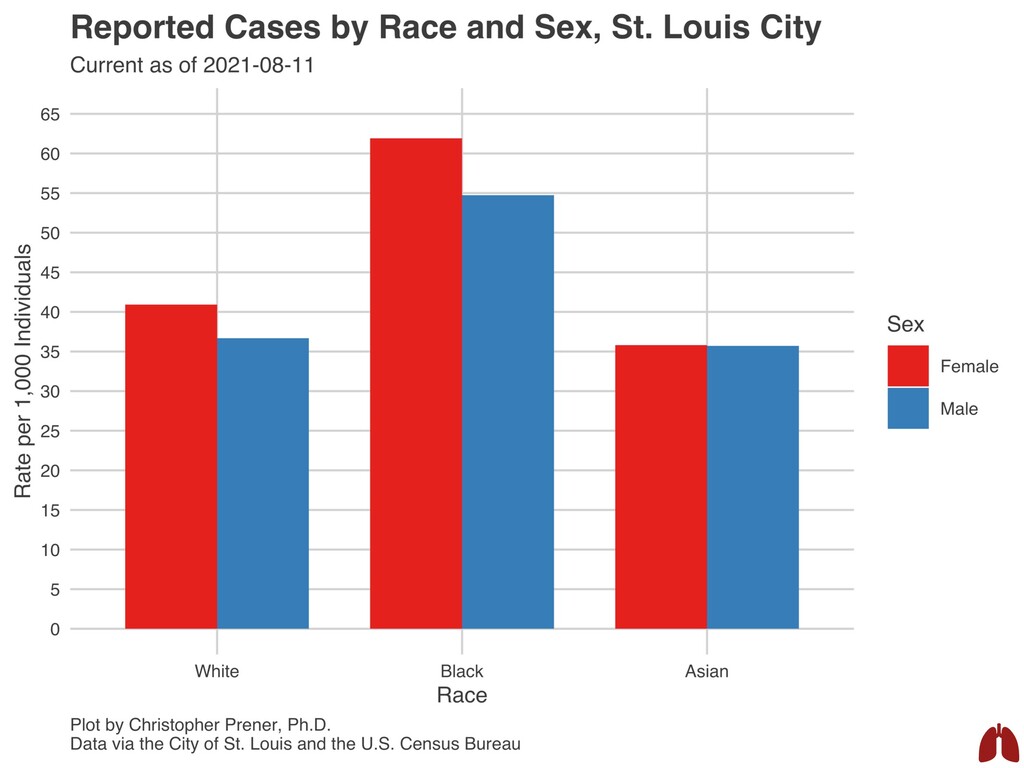
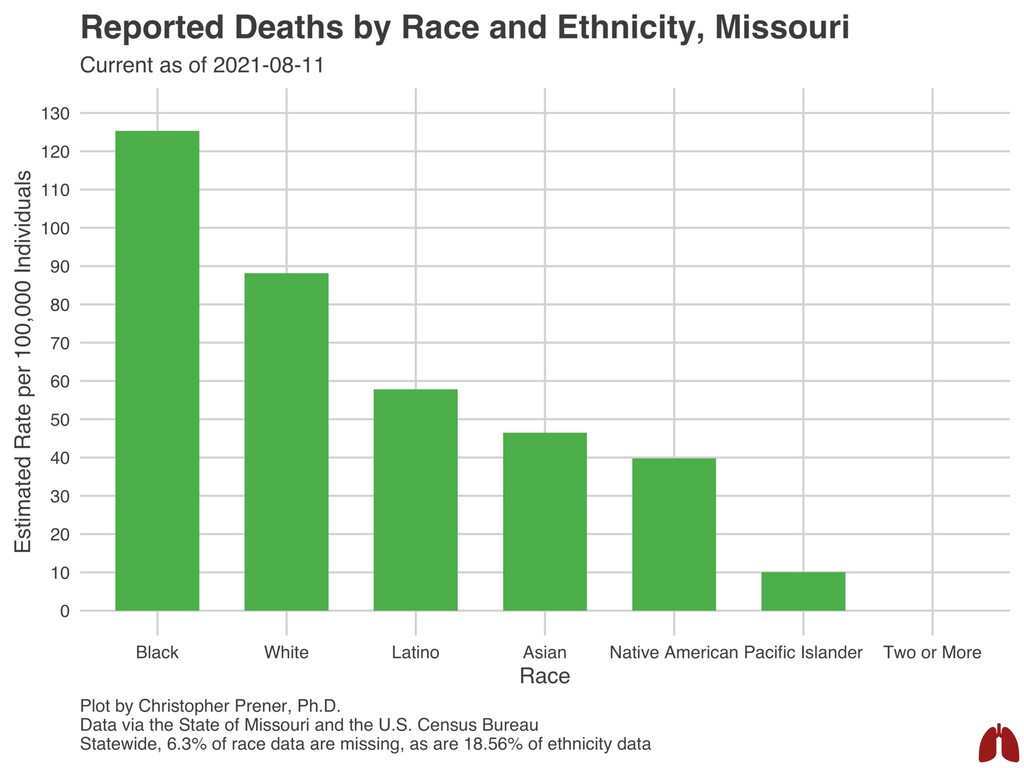
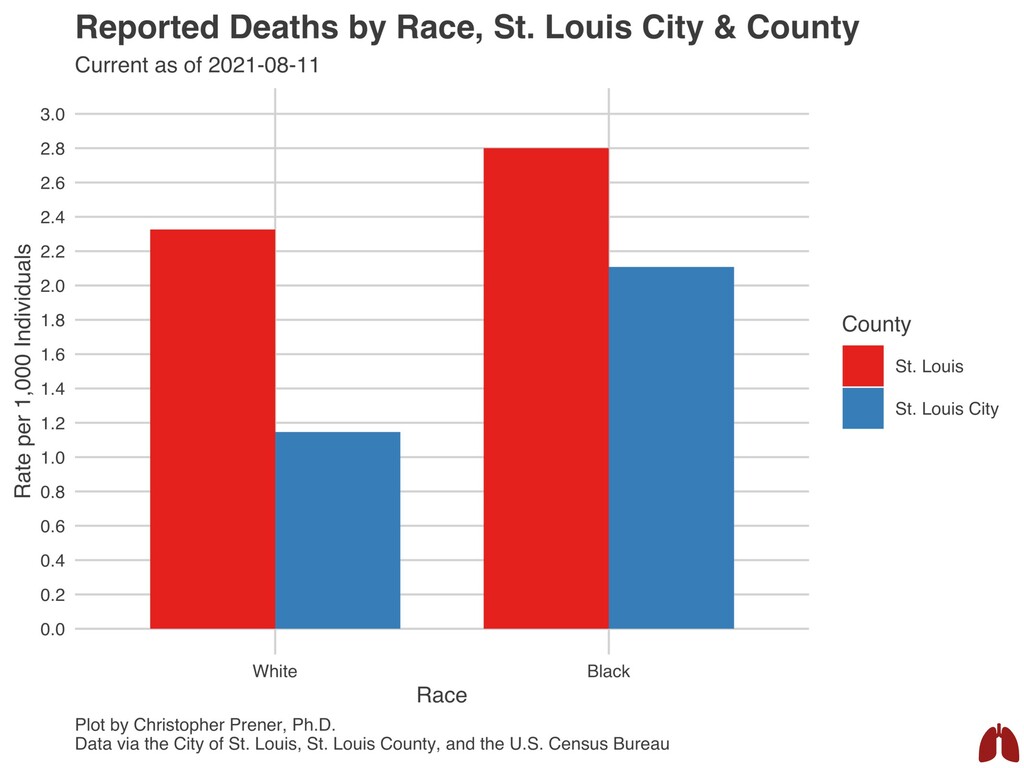
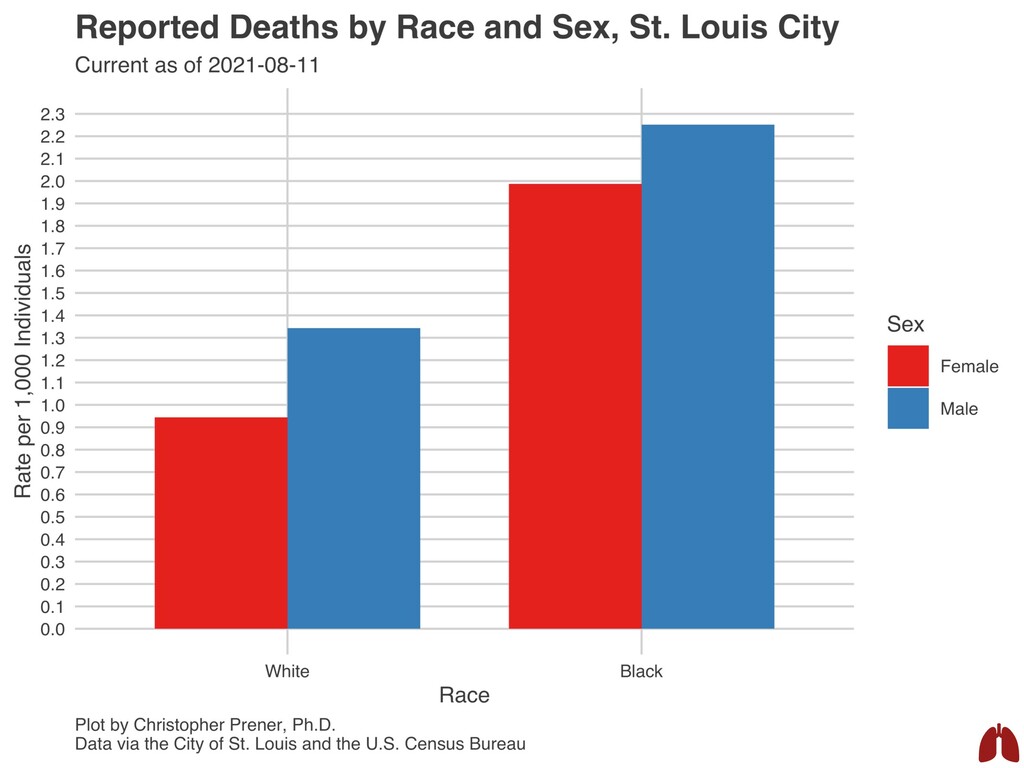
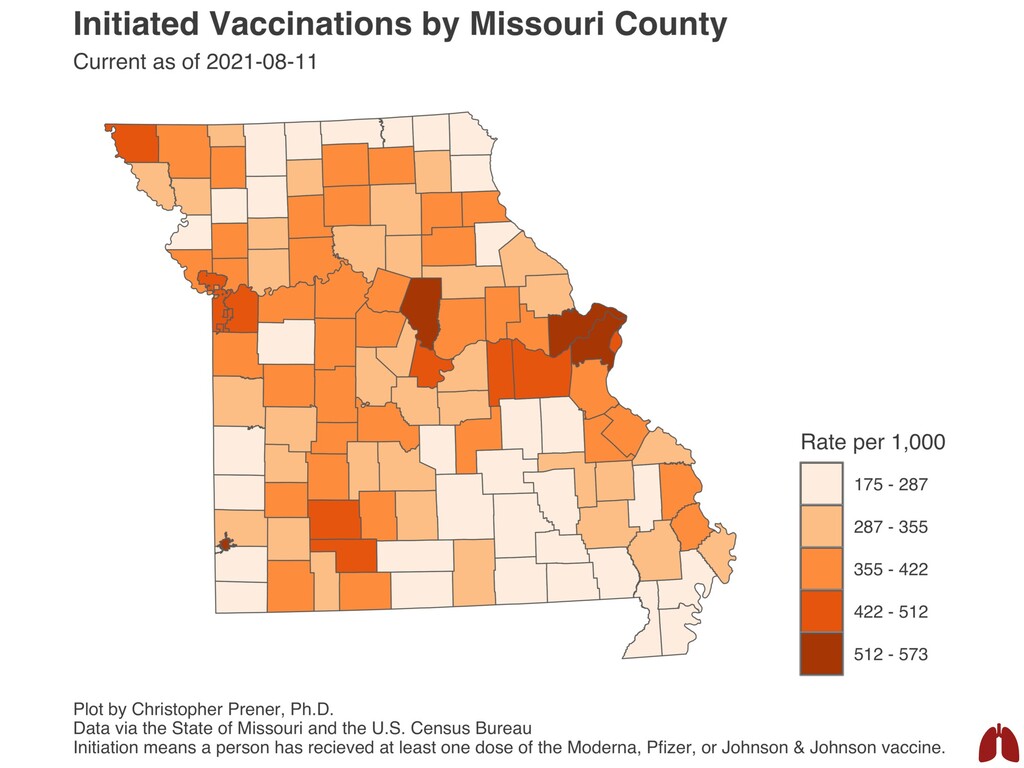
on COVID? 3. What is wrong with this arrangement for COVID data? 4. What does the sewing kit look like for my COVID work? 5. What COIVD disparities exist in Missouri and St. Louis? ST. LOUIS COVID-19 COMPARATIVE MODELING NETWORK | 08.12.2021
and computational methods ▸ Affiliations: • SLU’s Institute for Healing Justice and Equity • Northeastern University’s Institute for Health Equity and Social Justice Research • Core Faculty, SLU’s Advanced HEAlth Data Research Institute 1. PREFACE “HI, I’M CHRIS”
issues and improving patient health outcomes — especially those that disproportionally affect poor and underserved communities — in alignment with the University’s Jesuit mission. To achieve this commitment, the AHEAD Institute relies on health care data for its truly remarkable potential to create new efficiencies for physicians and more positive outcomes for patients. Leslie Hinyard, Ph.D., MSW Executive Director [email protected] Jeffrey Scherrer, Ph.D. Senior Director for Research [email protected]
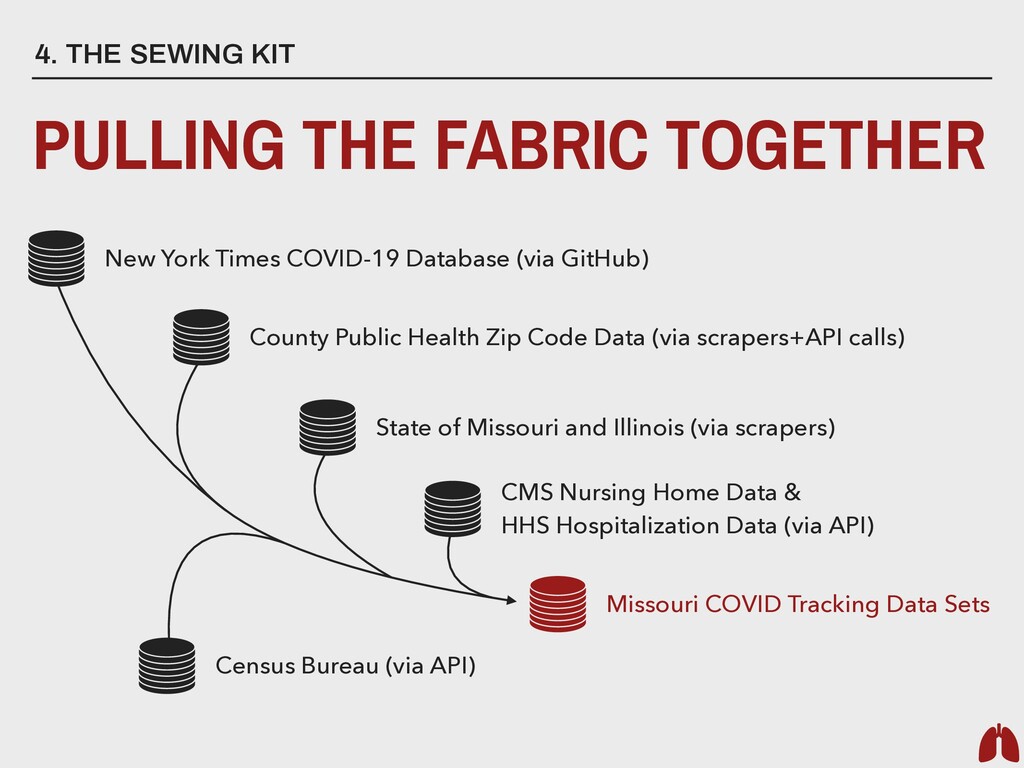
Times COVID-19 Database (via GitHub) County Public Health Zip Code Data (via scrapers+API calls) Missouri COVID Tracking Data Sets State of Missouri and Illinois (via scrapers) CMS Nursing Home Data & HHS Hospitalization Data (via API) Census Bureau (via API)
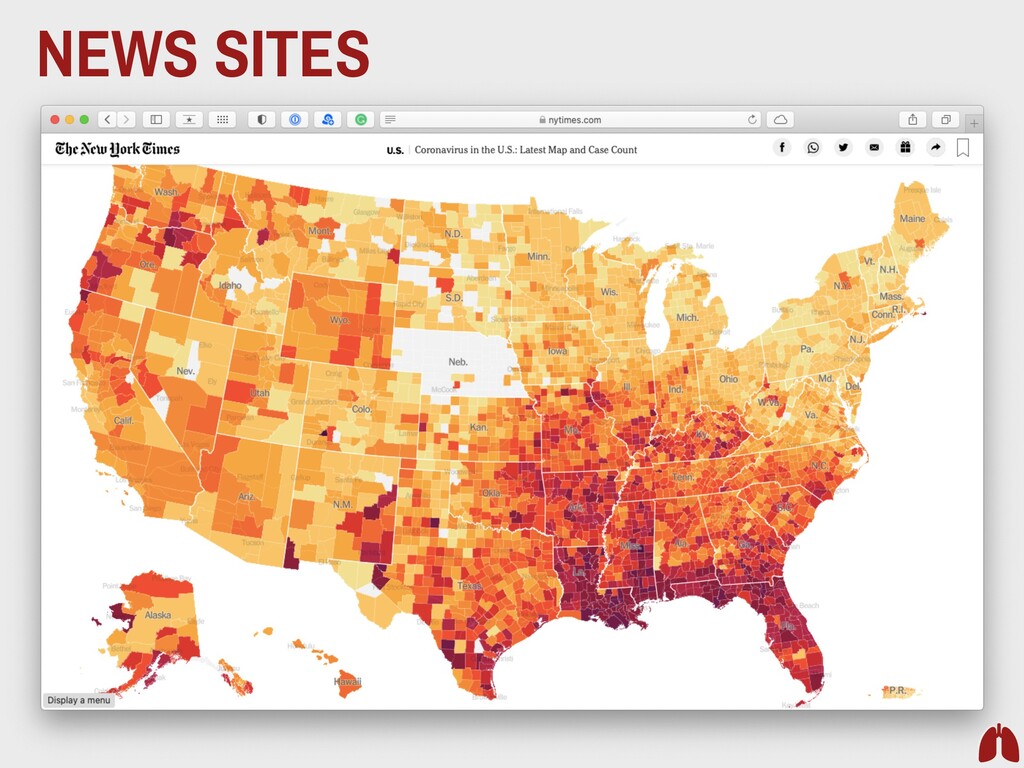
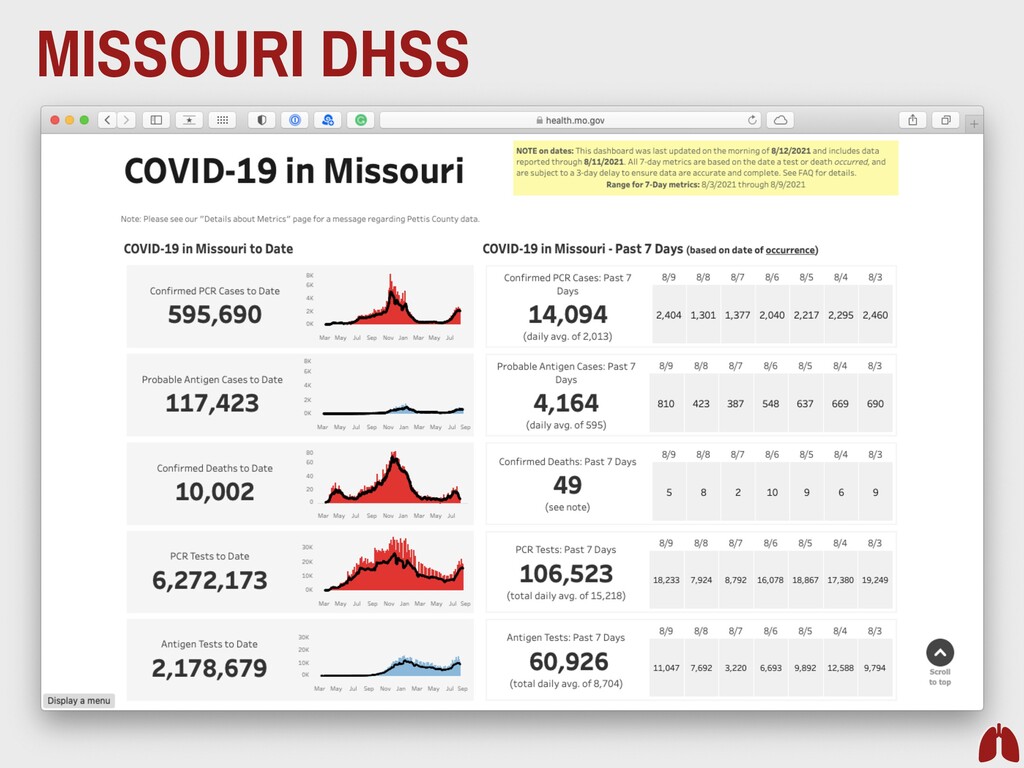
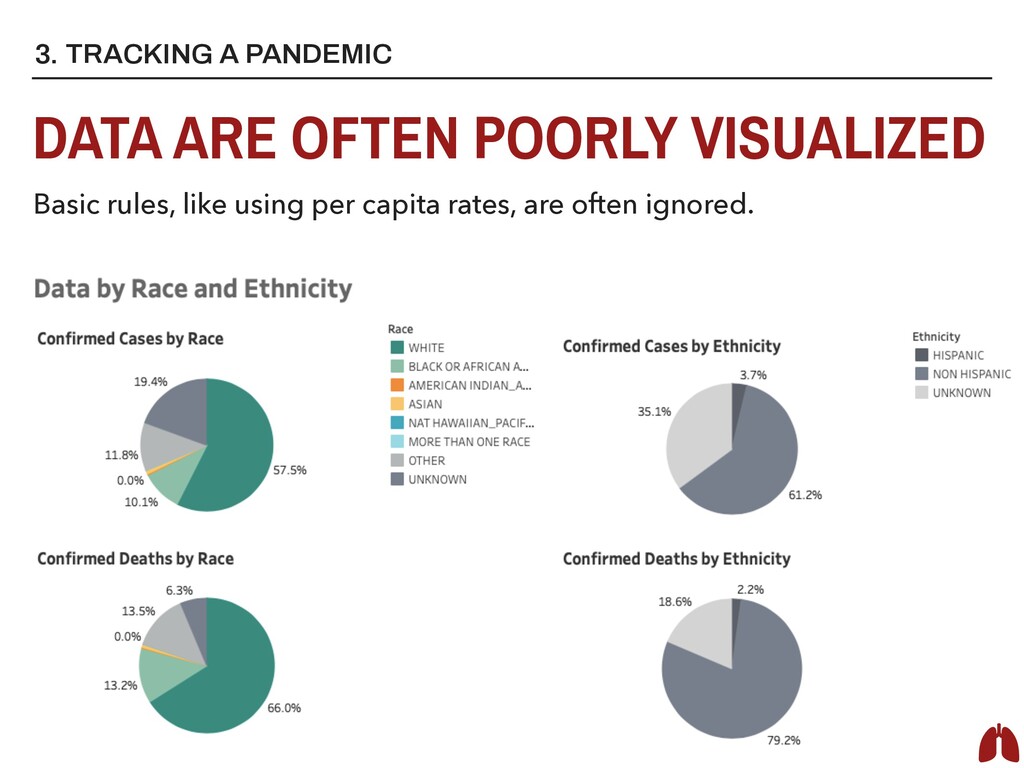
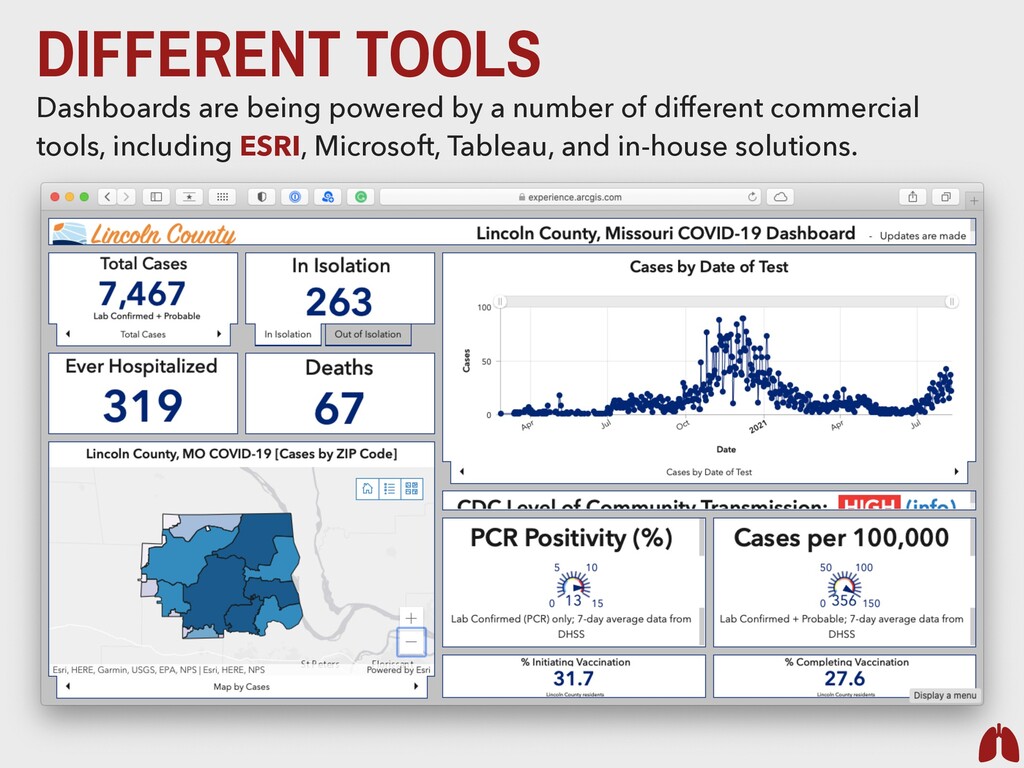
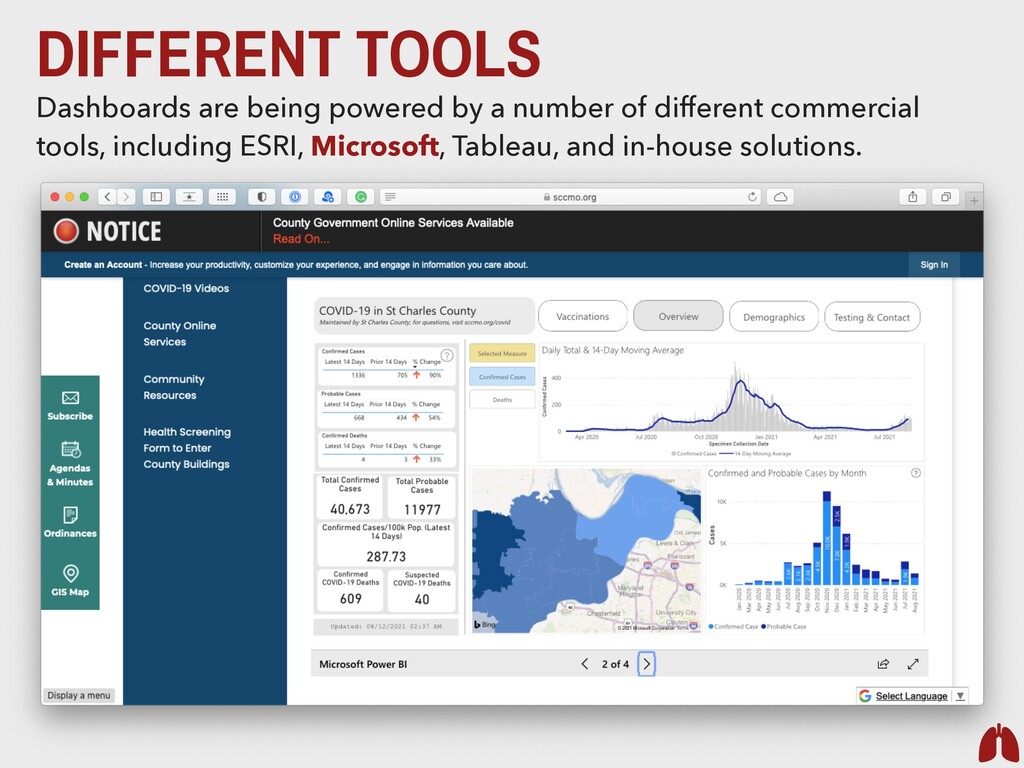
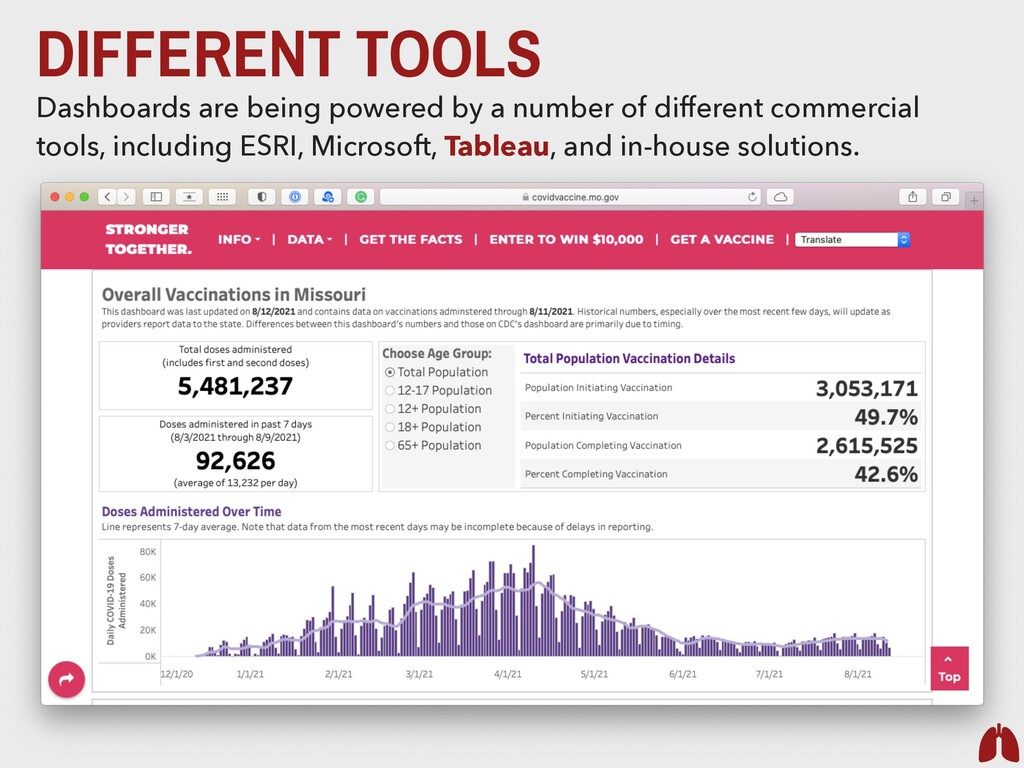
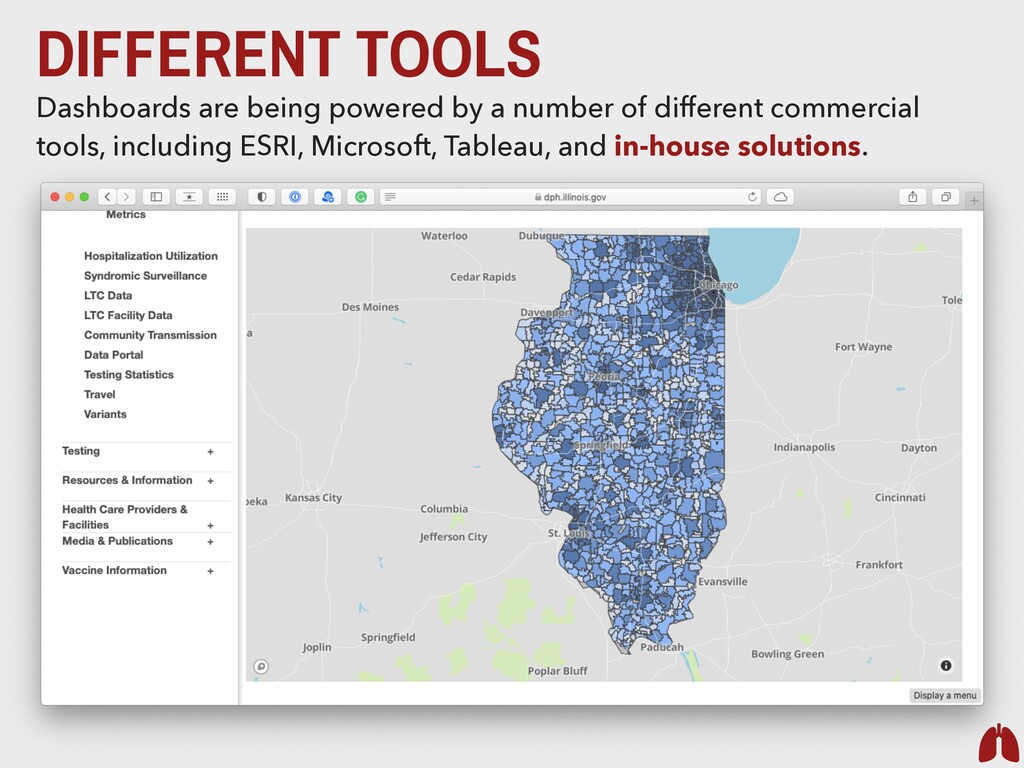
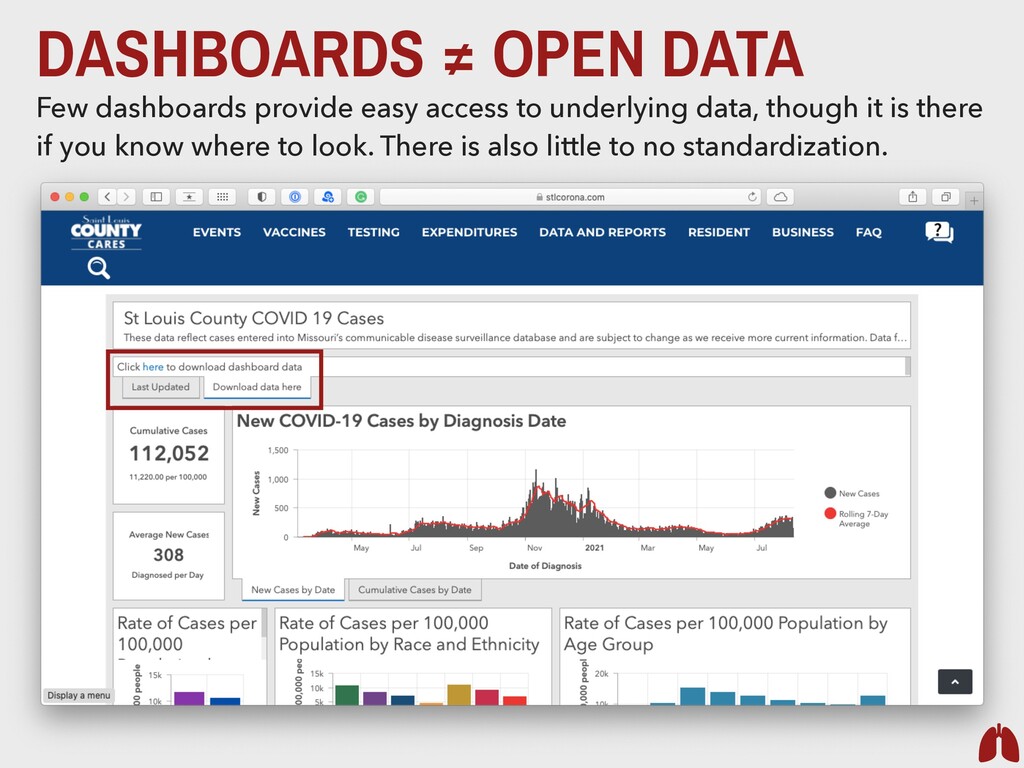
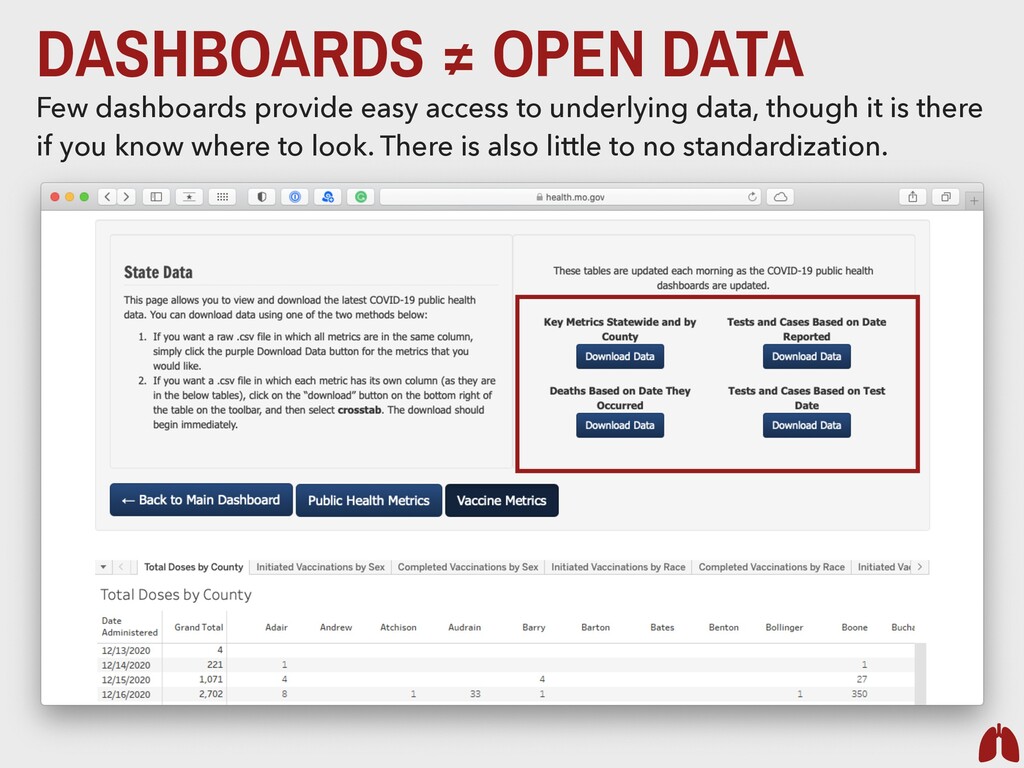
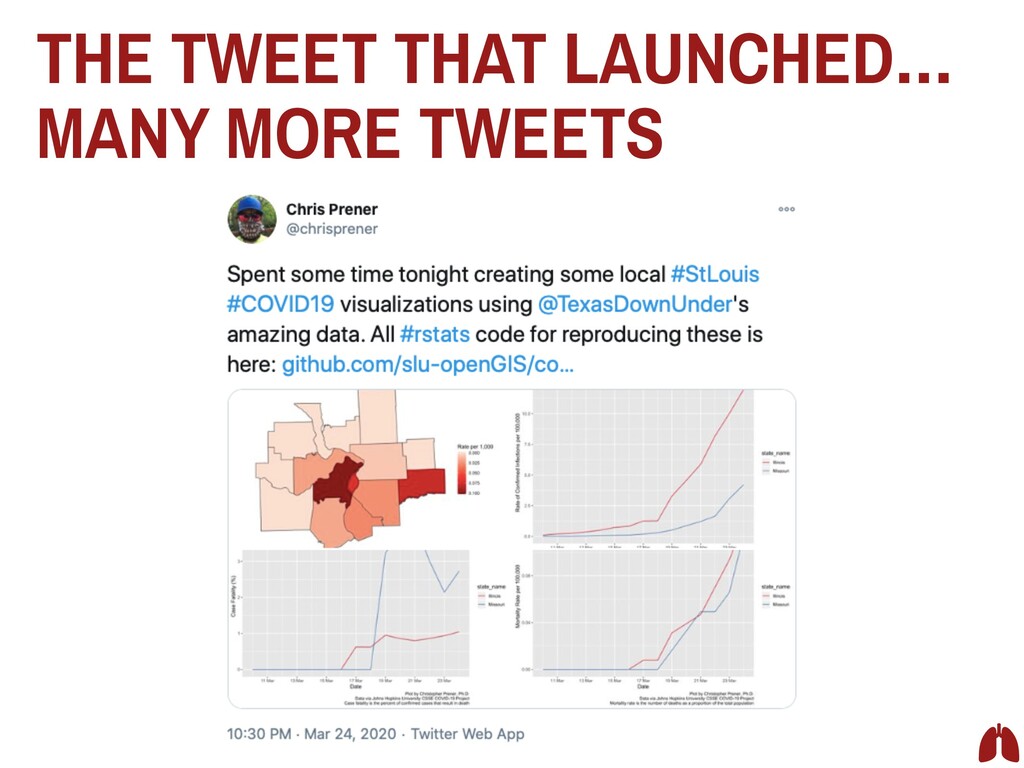
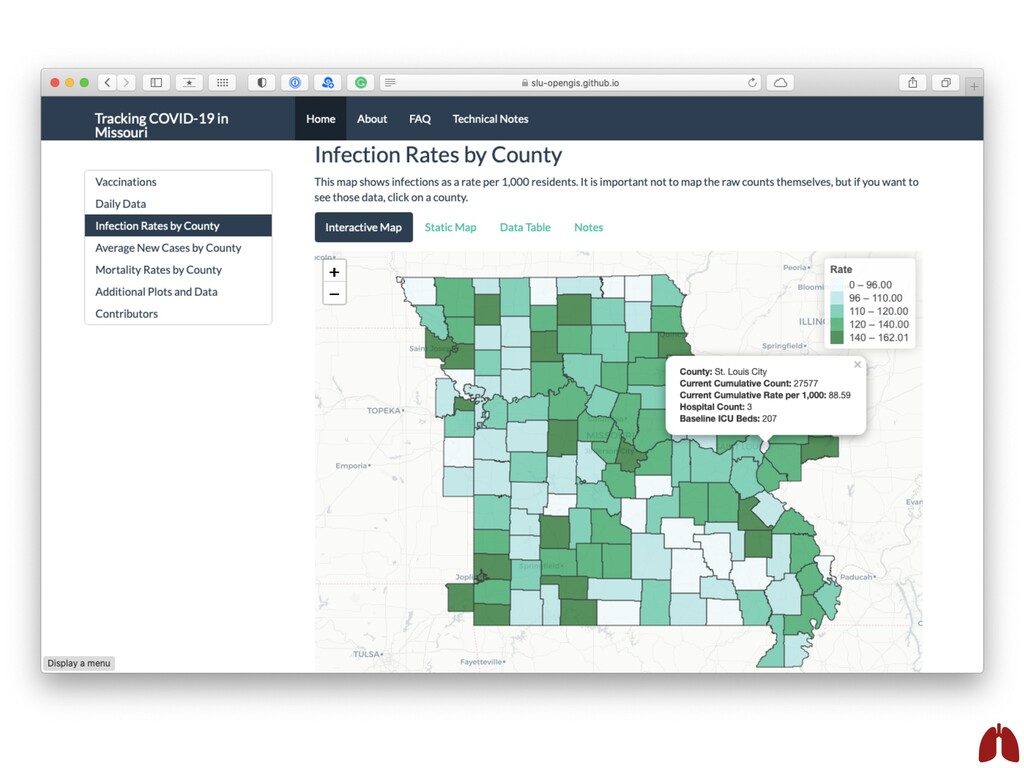
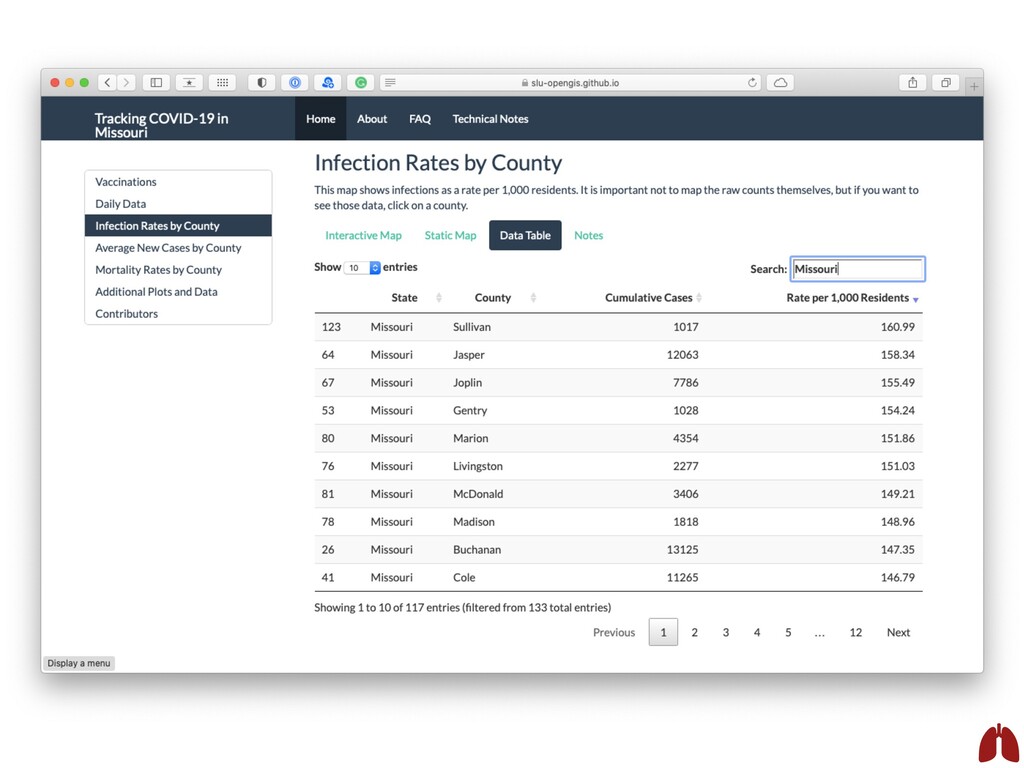
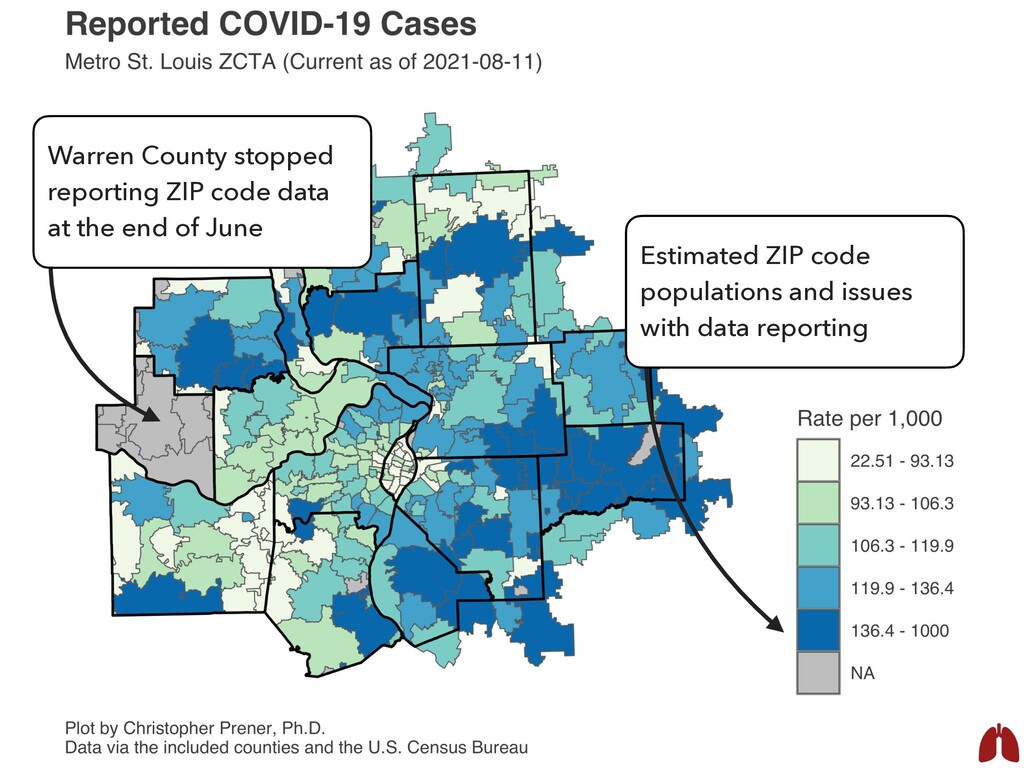
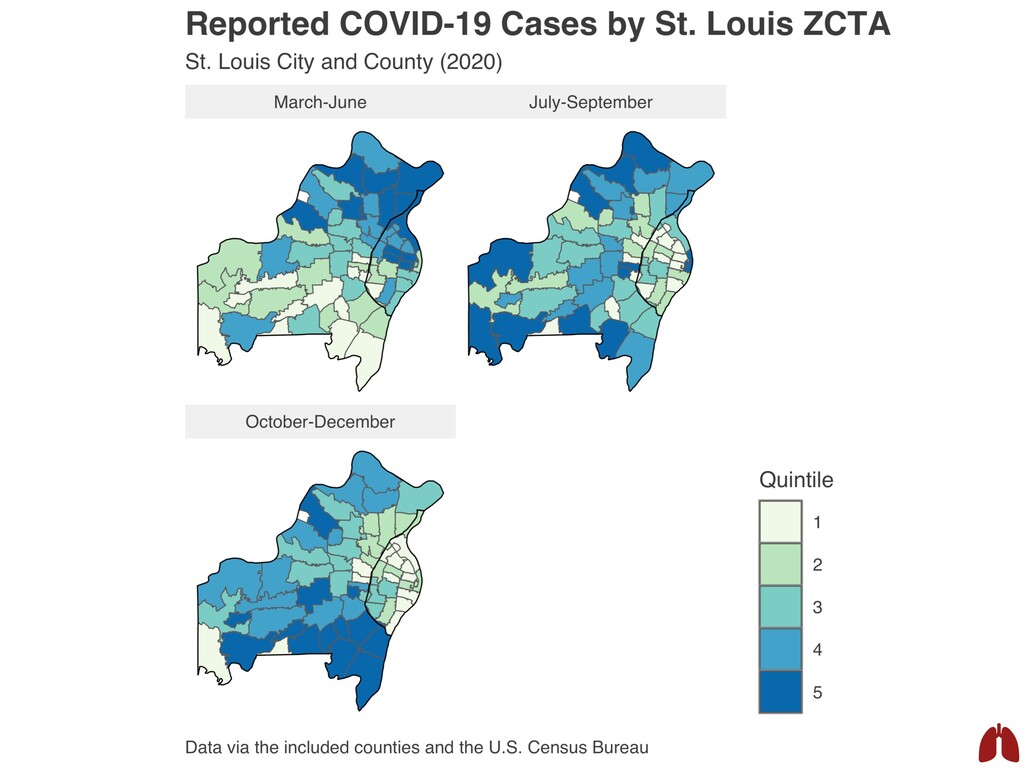
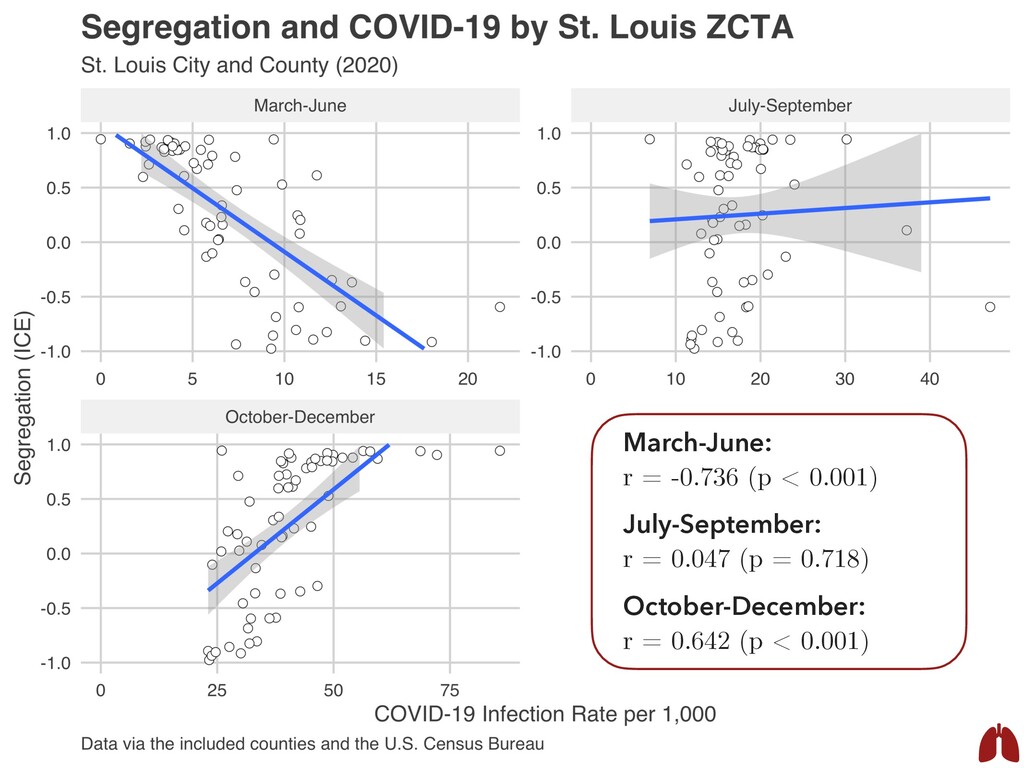
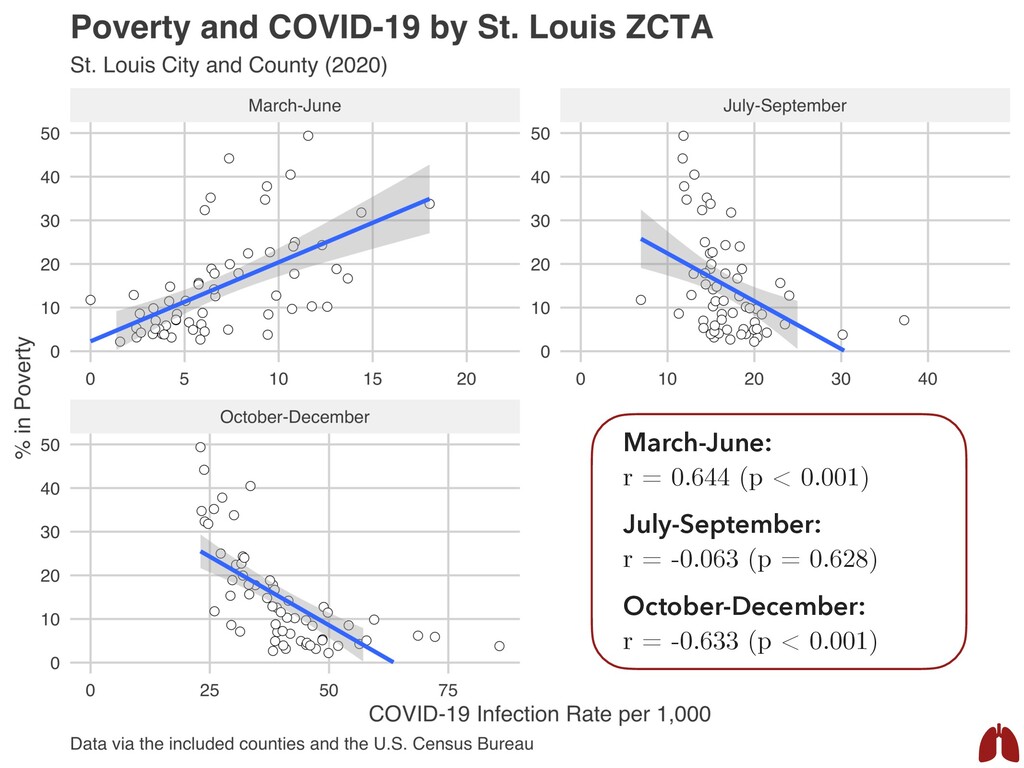
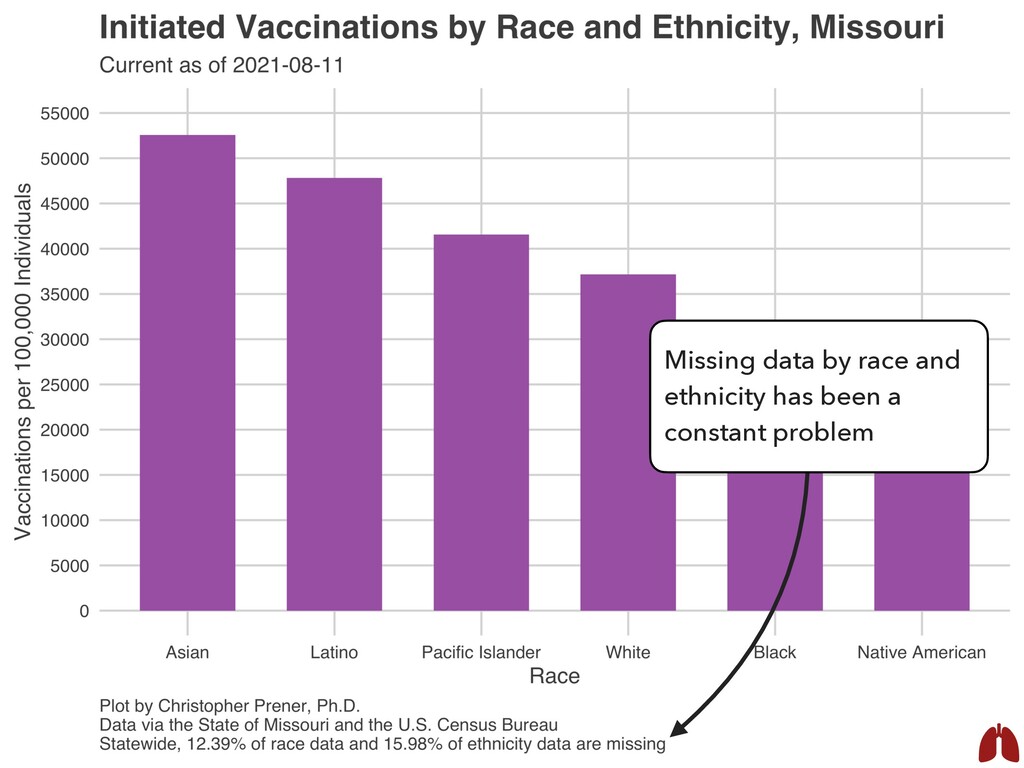
not the first priority: ▸ COVID-19 data sources suffer from a lack of standardization and often cannot be accessed. ▸ COVID-19 “dashboards” are all the rage, but there are frequent issues across jurisdictions with how similar metrics are being communicated. ▸ COVID-19 patterns that appear durable as cross-sections have important period effects that we need to interrogate. ▸ Iterating on analyses is not something we always get to do, but it is tremendously gratifying. ▸ Open data and science are also about community and communication.
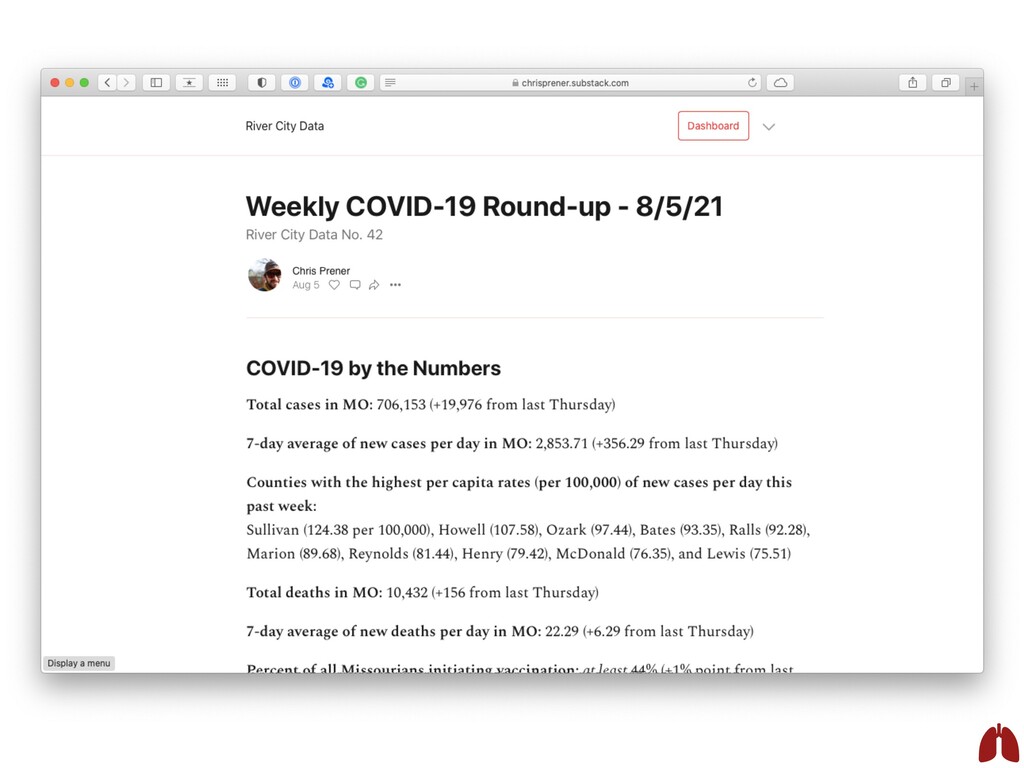
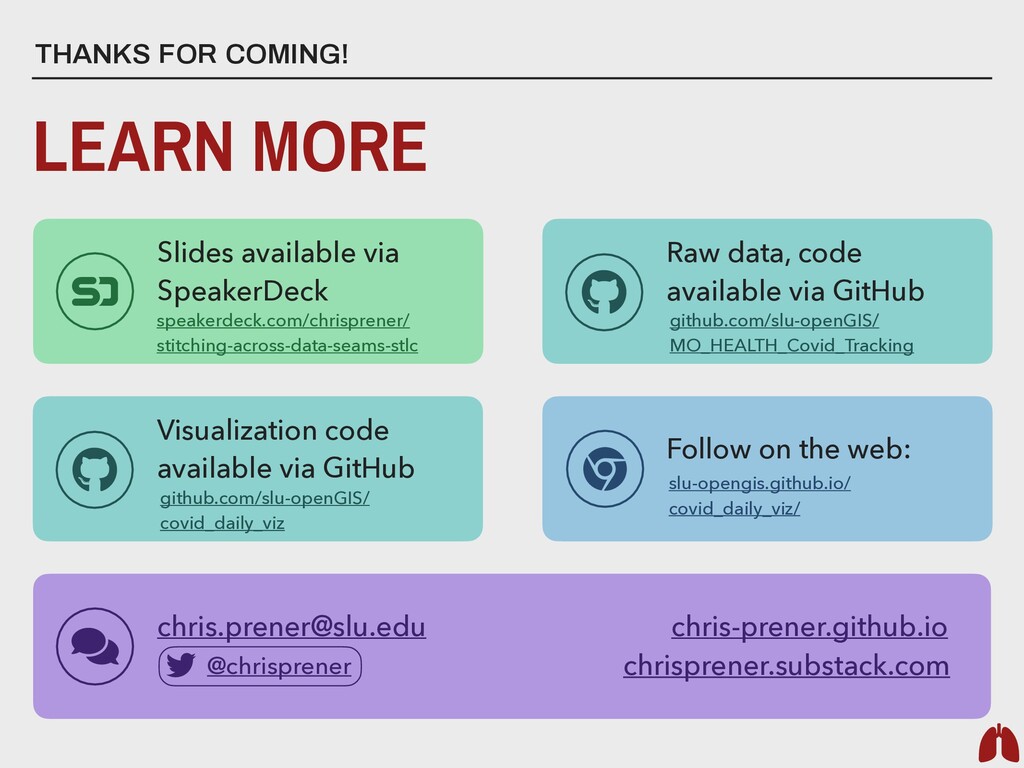
Raw data, code available via GitHub github.com/slu-openGIS/ MO_HEALTH_Covid_Tracking [email protected] chris-prener.github.io LEARN MORE THANKS FOR COMING! @chrisprener Visualization code available via GitHub github.com/slu-openGIS/ covid_daily_viz slu-opengis.github.io/ covid_daily_viz/ chrisprener.substack.com