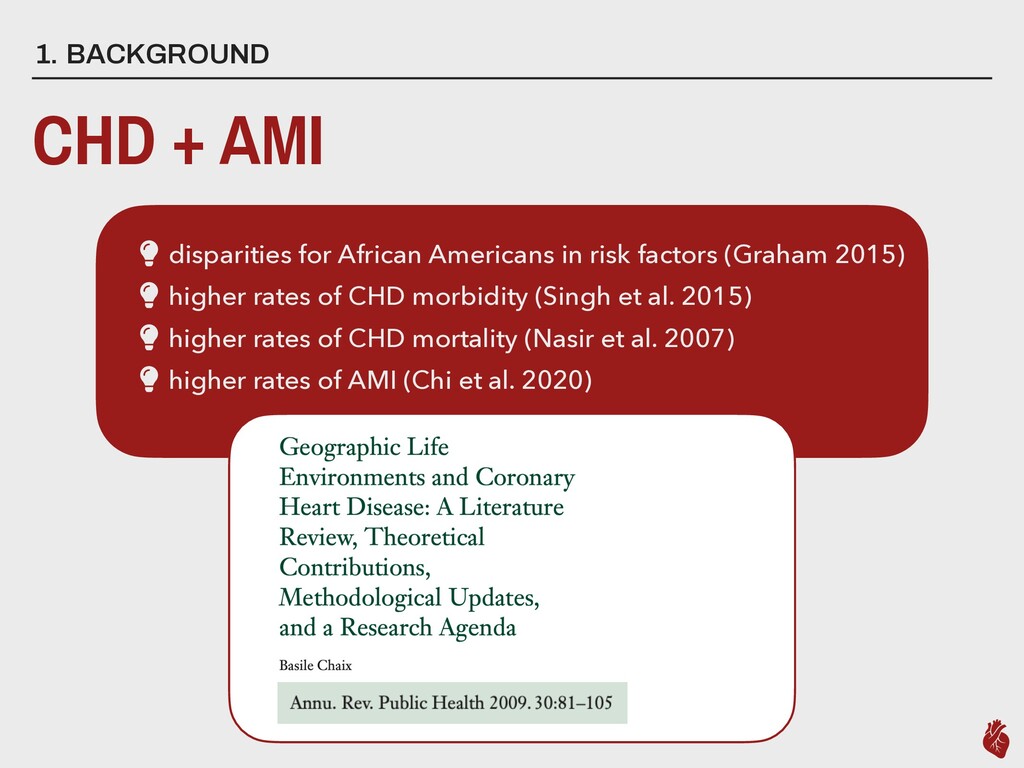
blood flow to the heart, commonly caused by the the build-up of plaque in the heart’s arteries (known as atherosclerosis). AMI = Acute Myocardial Infarction A consequence of CHD where decreased or stopped blood flow causes damage to the heart muscle.
risk factors (Graham 2015) higher rates of CHD morbidity (Singh et al. 2015) higher rates of CHD mortality (Nasir et al. 2007) higher rates of AMI (Chi et al. 2020)
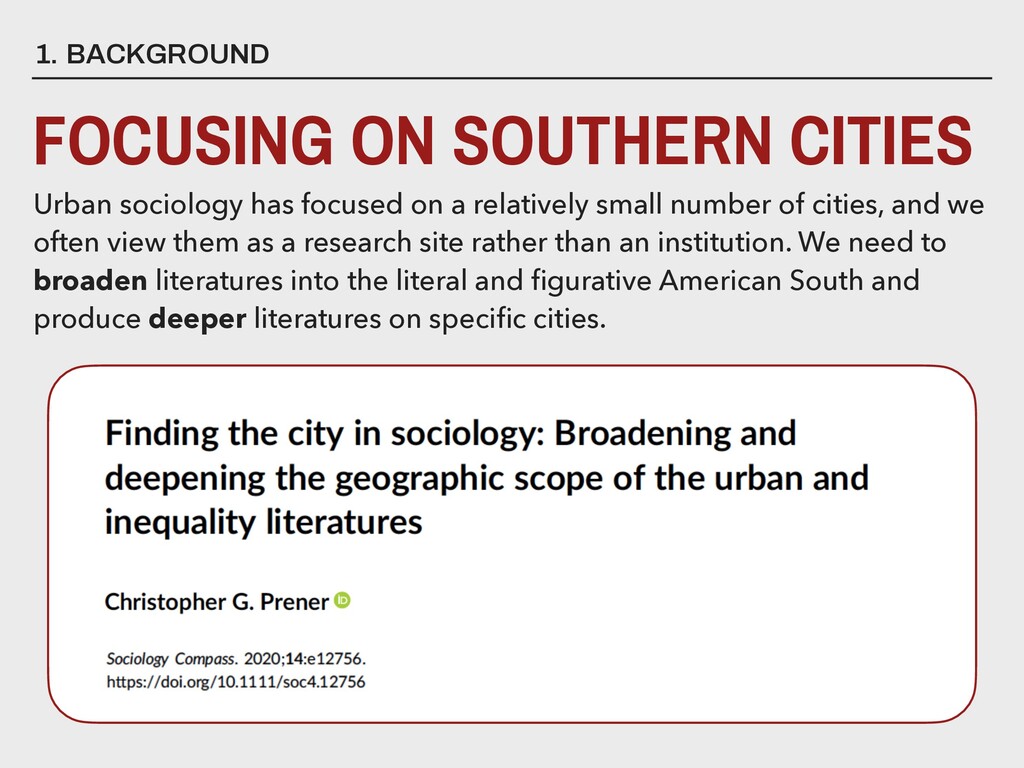
on a relatively small number of cities, and we often view them as a research site rather than an institution. We need to broaden literatures into the literal and figurative American South and produce deeper literatures on specific cities.
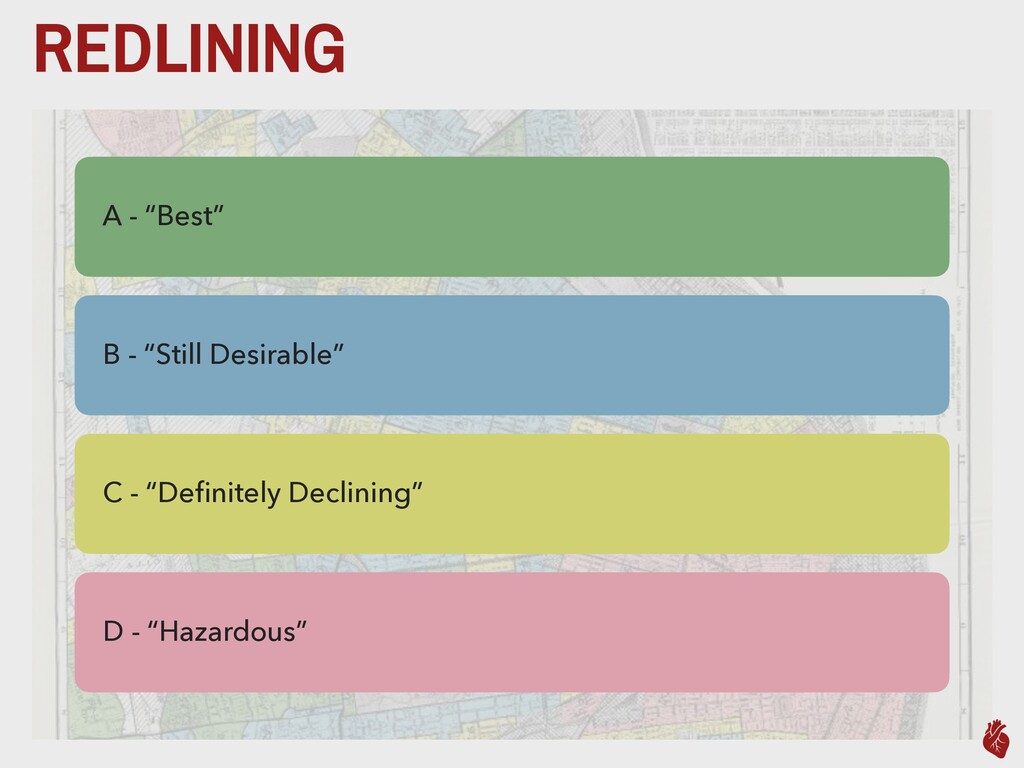
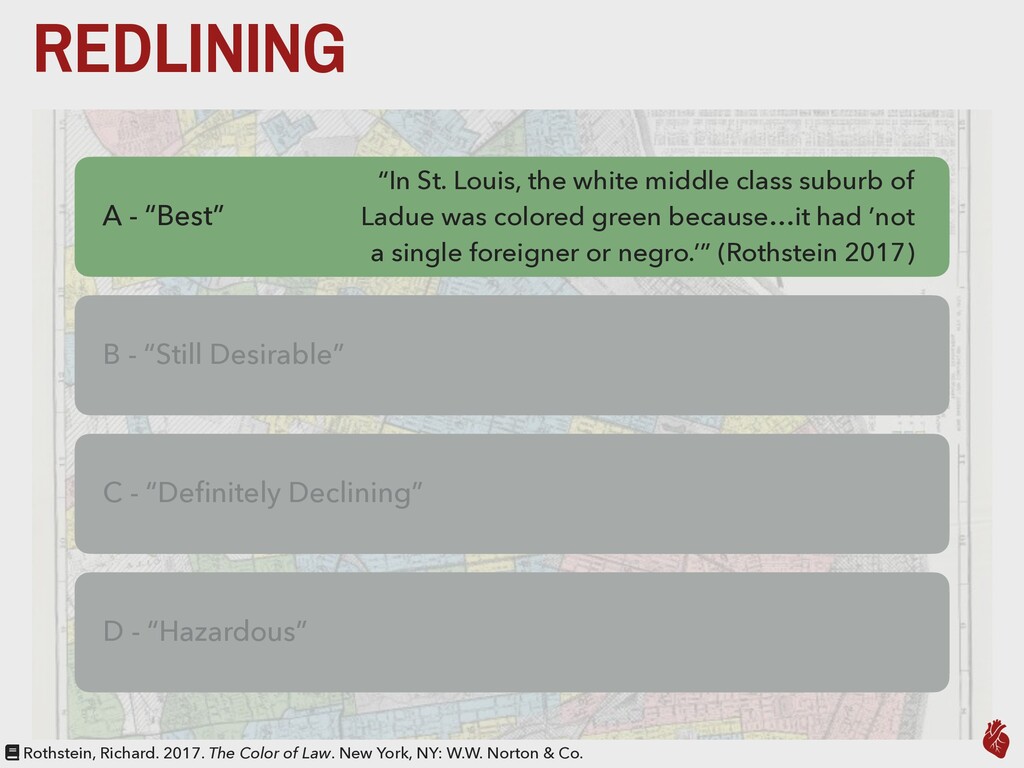
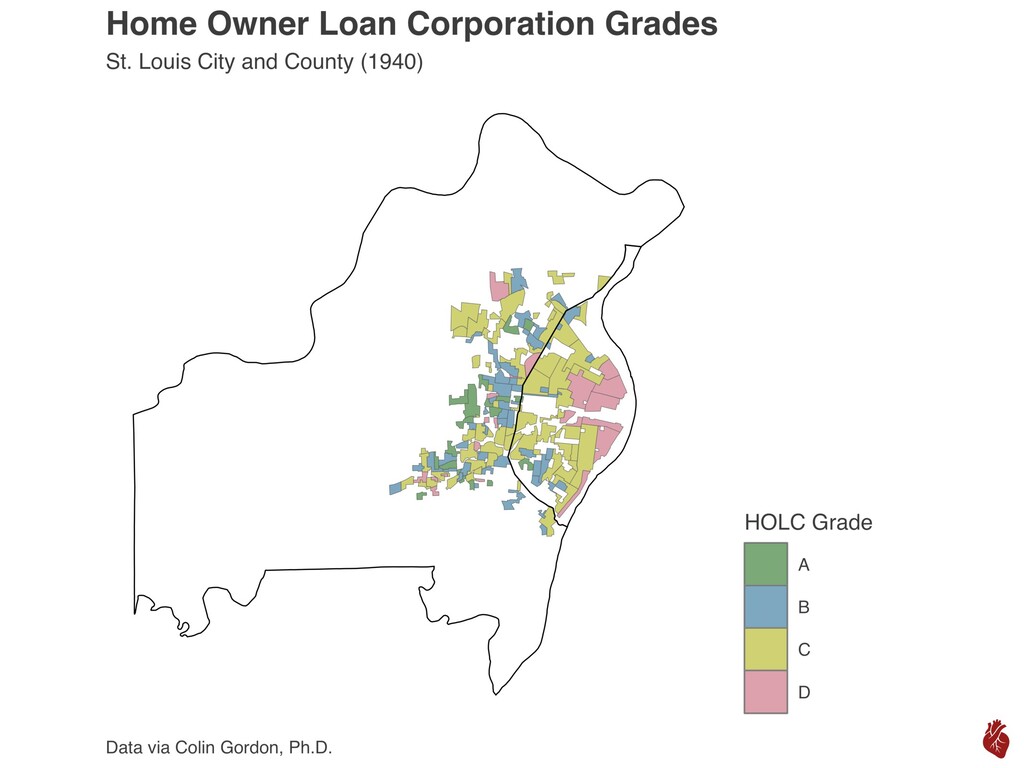
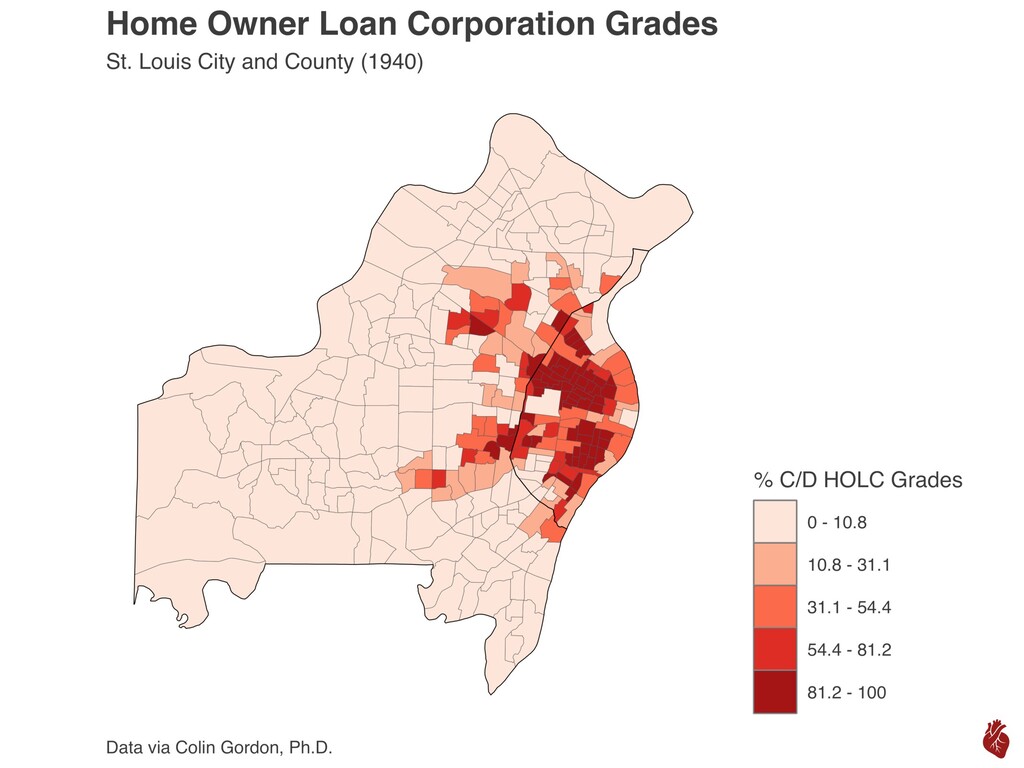
“Definitely Declining” D - “Hazardous” “In St. Louis, the white middle class suburb of Ladue was colored green because…it had ’not a single foreigner or negro.’” (Rothstein 2017) Rothstein, Richard. 2017. The Color of Law. New York, NY: W.W. Norton & Co.
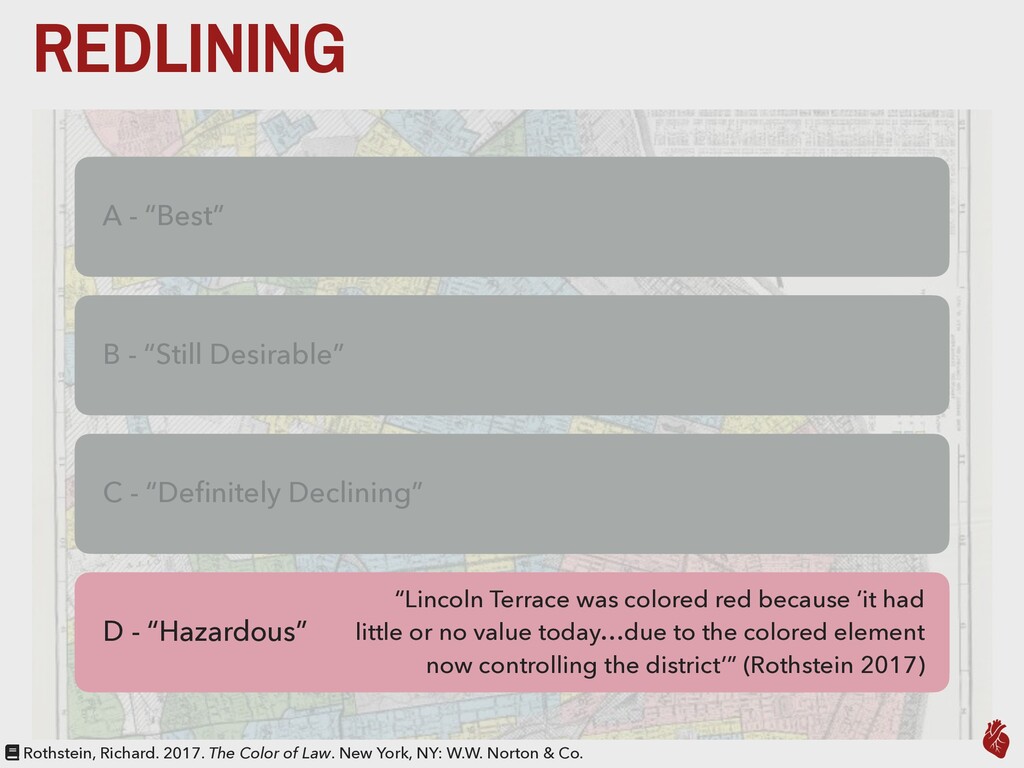
“Definitely Declining” D - “Hazardous” Rothstein, Richard. 2017. The Color of Law. New York, NY: W.W. Norton & Co. “Lincoln Terrace was colored red because ‘it had little or no value today…due to the colored element now controlling the district’” (Rothstein 2017)
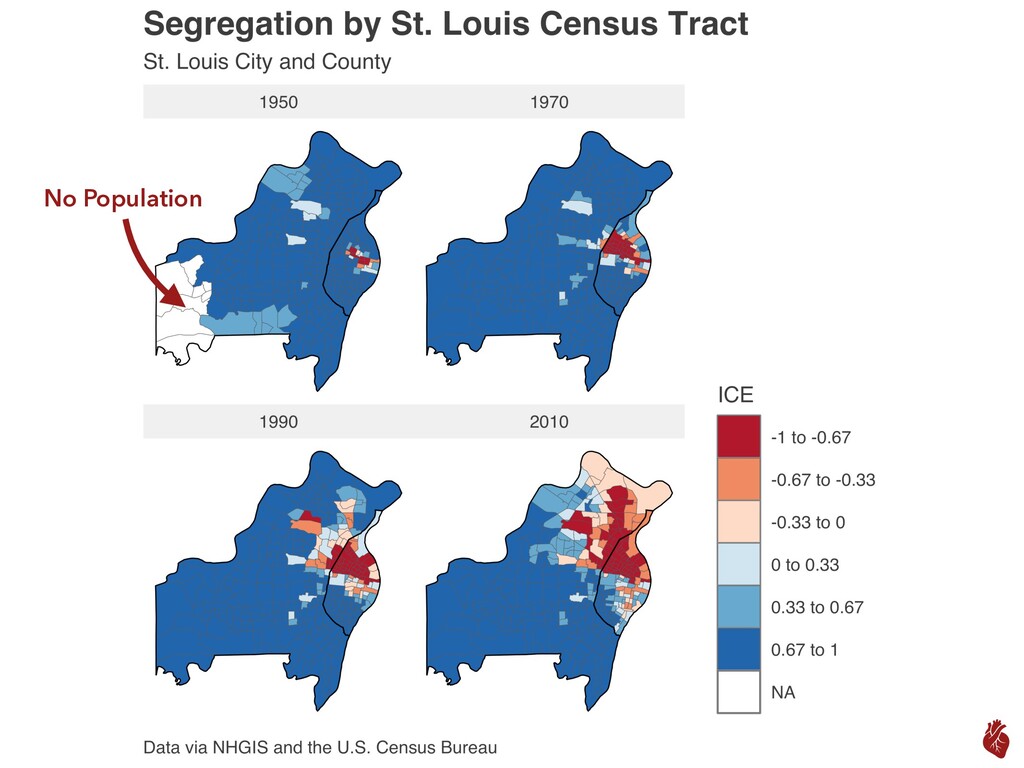
at the Extremes (ICE) provides a sub-county measure of segregation that produces scores per feature from -1 (total segregation of the marginalized group) to 1 (total segregation of the privileged group). Formula: ICEi = (Ai - Pi )/Ti Where: Ai = Privileged [white] Pi = Marginalized [Black] Ti = Total Population Massey, Douglas. 2001. “The prodigal paradigm returns: ecology comes back to sociology.” Pp. 41-48 in Does It Take a Village? Community Effects on Children, Adolescents, and Families, edited by A. Booth and A. Crouter. Mahwah, NJ: Lawrence Erlbaum Associates. Krieger, Nancy, et al. 2017. "Measures of local segregation for monitoring health inequities by local health departments." American Journal of Public Health 107(6): 903-906.
that there is a link between redlining and contemporary segregation, with redlined neighborhoods experiencing higher rates of isolation for African Americans. ?
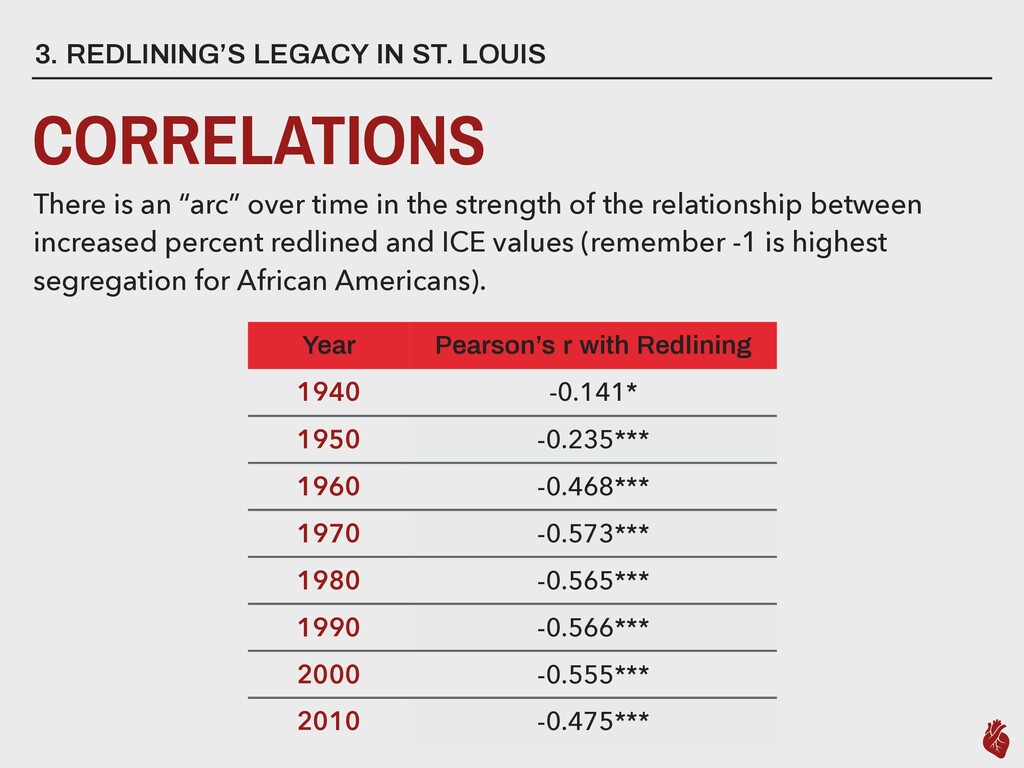
“arc” over time in the strength of the relationship between increased percent redlined and ICE values (remember -1 is highest segregation for African Americans). Year Pearson’s r with Redlining 1940 -0.141* 1950 -0.235*** 1960 -0.468*** 1970 -0.573*** 1980 -0.565*** 1990 -0.566*** 2000 -0.555*** 2010 -0.475***
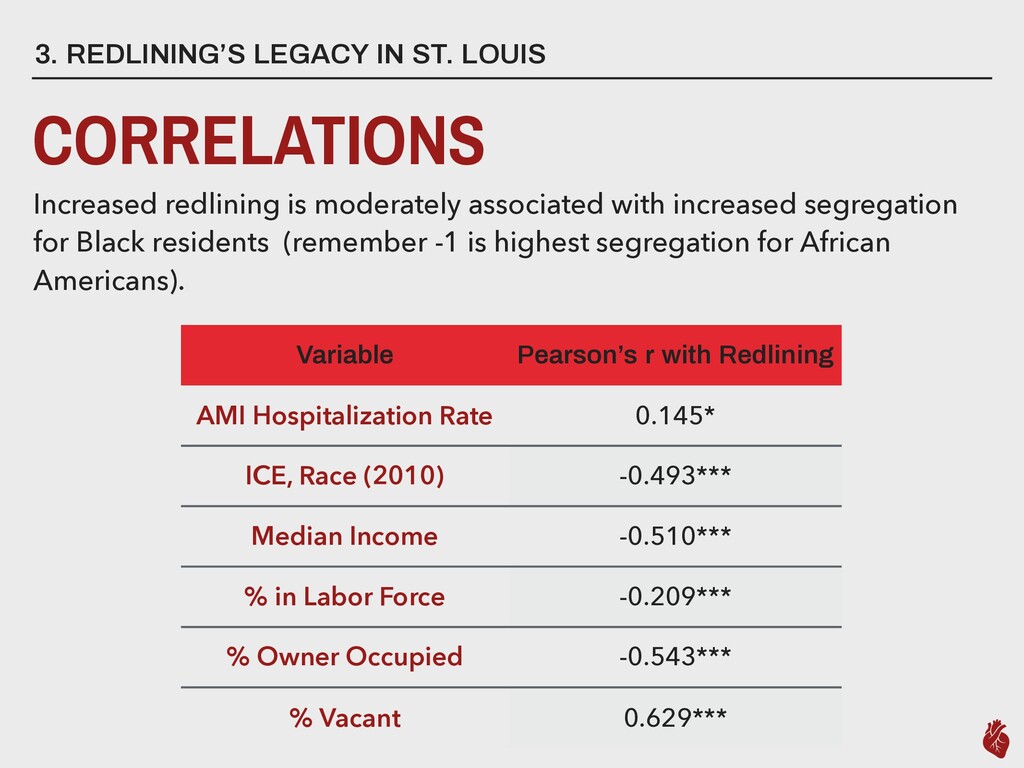
moderately associated with increased segregation for Black residents (remember -1 is highest segregation for African Americans). Variable Pearson’s r with Redlining AMI Hospitalization Rate 0.145* ICE, Race (2010) -0.493*** Median Income -0.510*** % in Labor Force -0.209*** % Owner Occupied -0.543*** % Vacant 0.629***
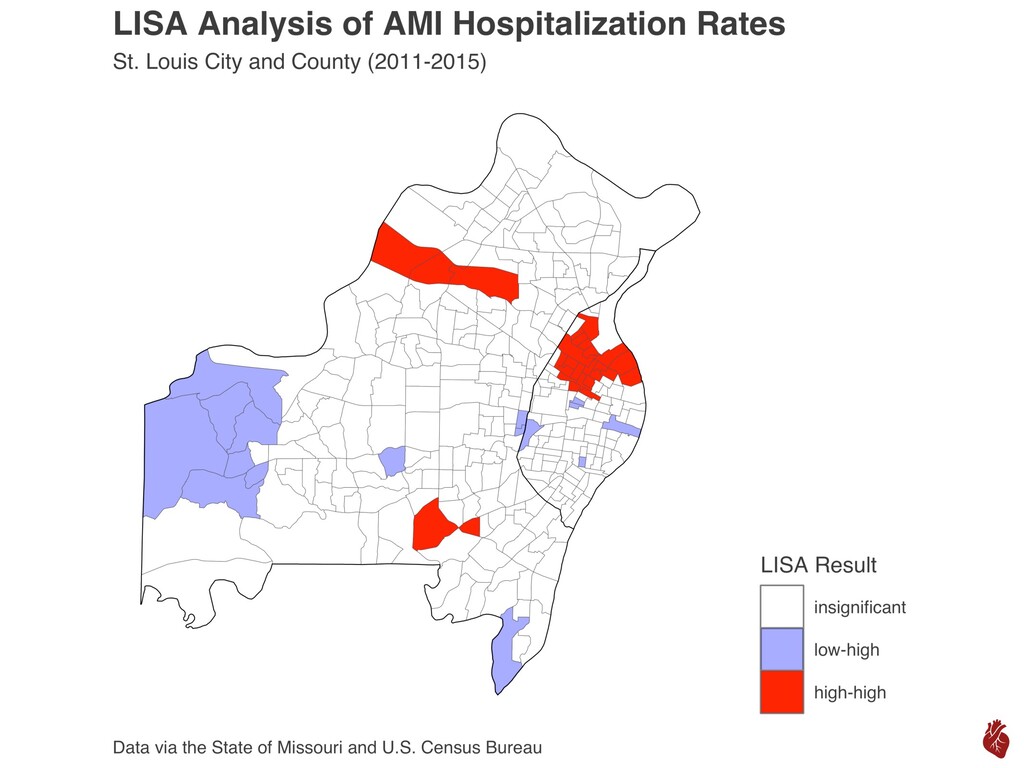
St. Louis? Based on the literature on heart disease and AIM, I hypothesize that clusters are present in parts of St. Louis City and County that HOLC redlined. ?
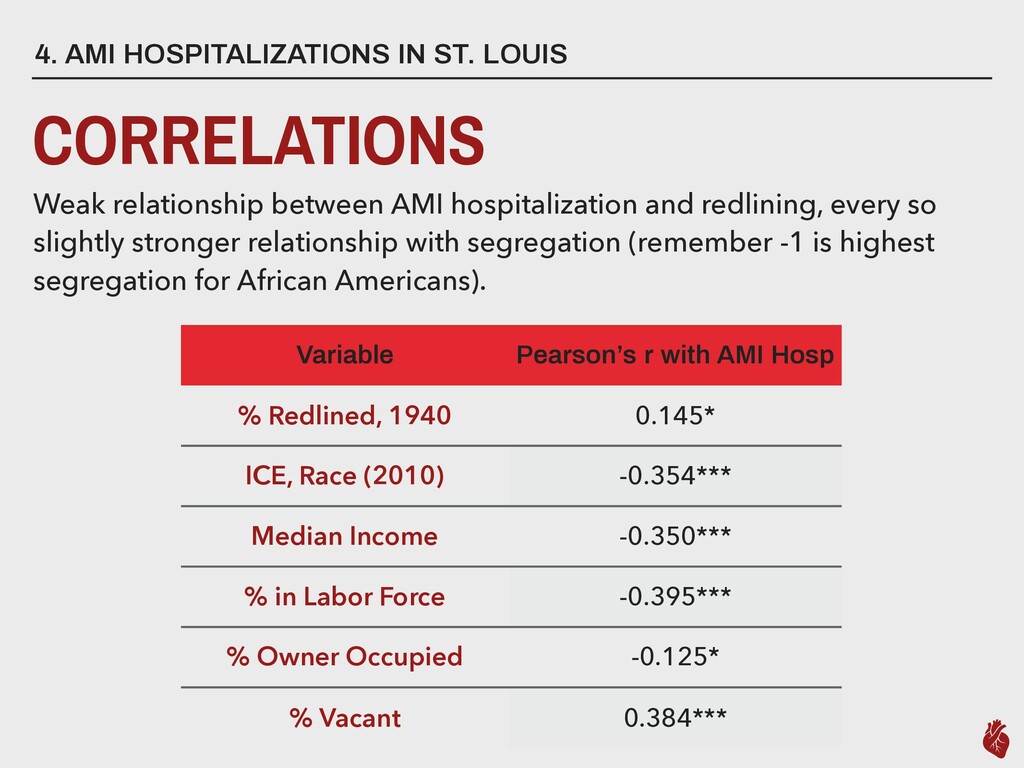
AMI hospitalization and redlining, every so slightly stronger relationship with segregation (remember -1 is highest segregation for African Americans). Variable Pearson’s r with AMI Hosp % Redlined, 1940 0.145* ICE, Race (2010) -0.354*** Median Income -0.350*** % in Labor Force -0.395*** % Owner Occupied -0.125* % Vacant 0.384***
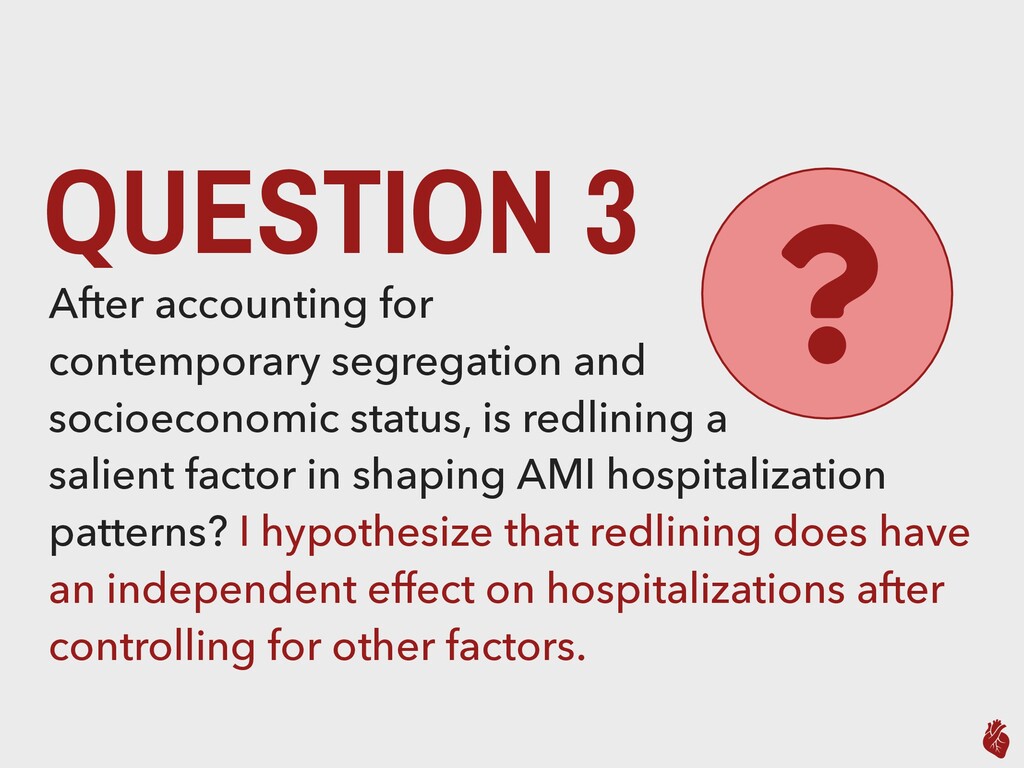
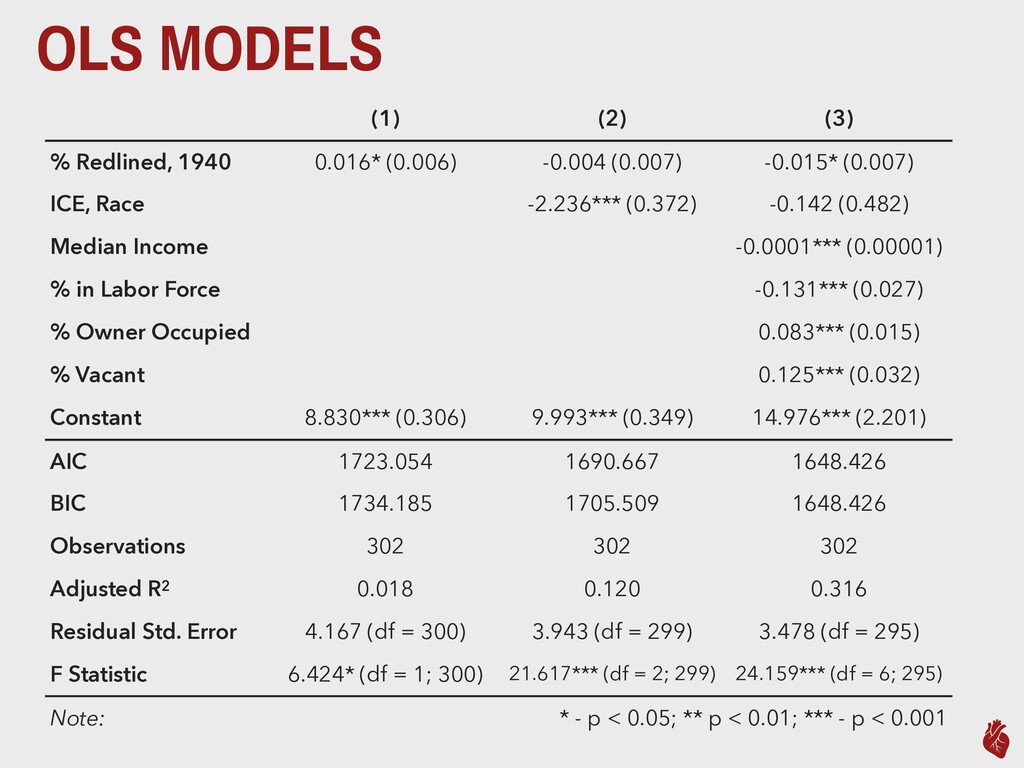
is redlining a salient factor in shaping AMI hospitalization patterns? I hypothesize that redlining does have an independent effect on hospitalizations after controlling for other factors. ?
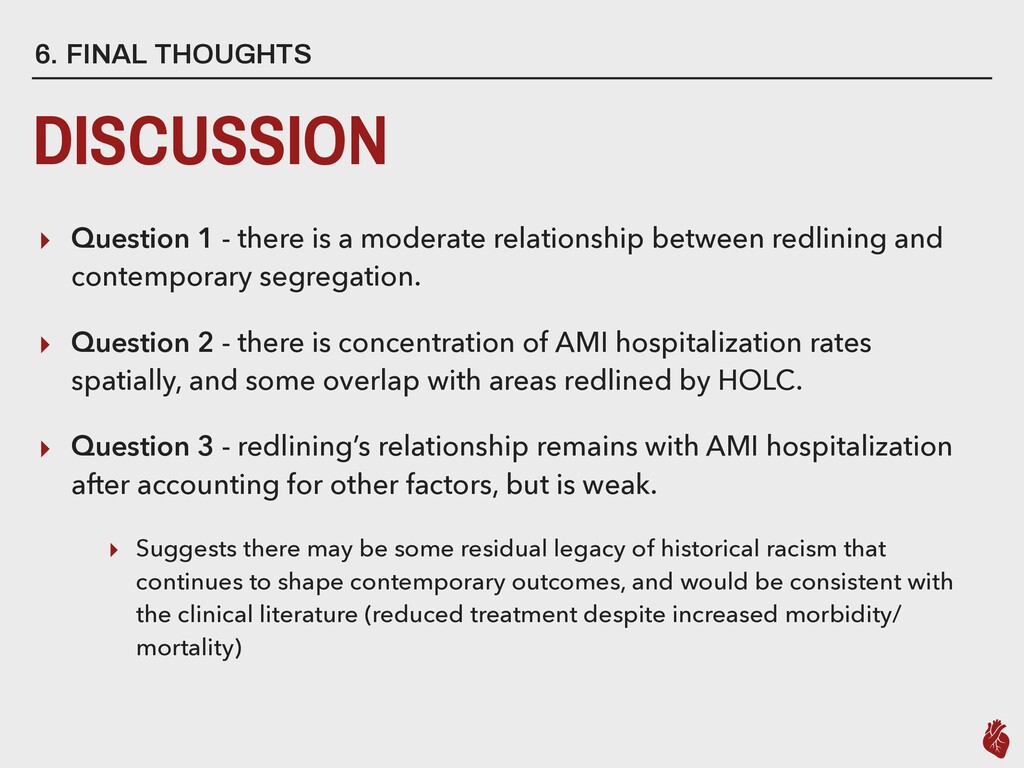
a moderate relationship between redlining and contemporary segregation. ▸ Question 2 - there is concentration of AMI hospitalization rates spatially, and some overlap with areas redlined by HOLC. ▸ Question 3 - redlining’s relationship remains with AMI hospitalization after accounting for other factors, but is weak. ▸ Suggests there may be some residual legacy of historical racism that continues to shape contemporary outcomes, and would be consistent with the clinical literature (reduced treatment despite increased morbidity/ mortality)
explained - potential for omitted variable bias ▸ The overlaps between redlining and AMI hospitalizations look different between St. Louis City and St. Louis County - disaggregating models is necessary ▸ Detailed, patient-level data is needed to further explore these patterns but significant barriers remain to building such a data set.