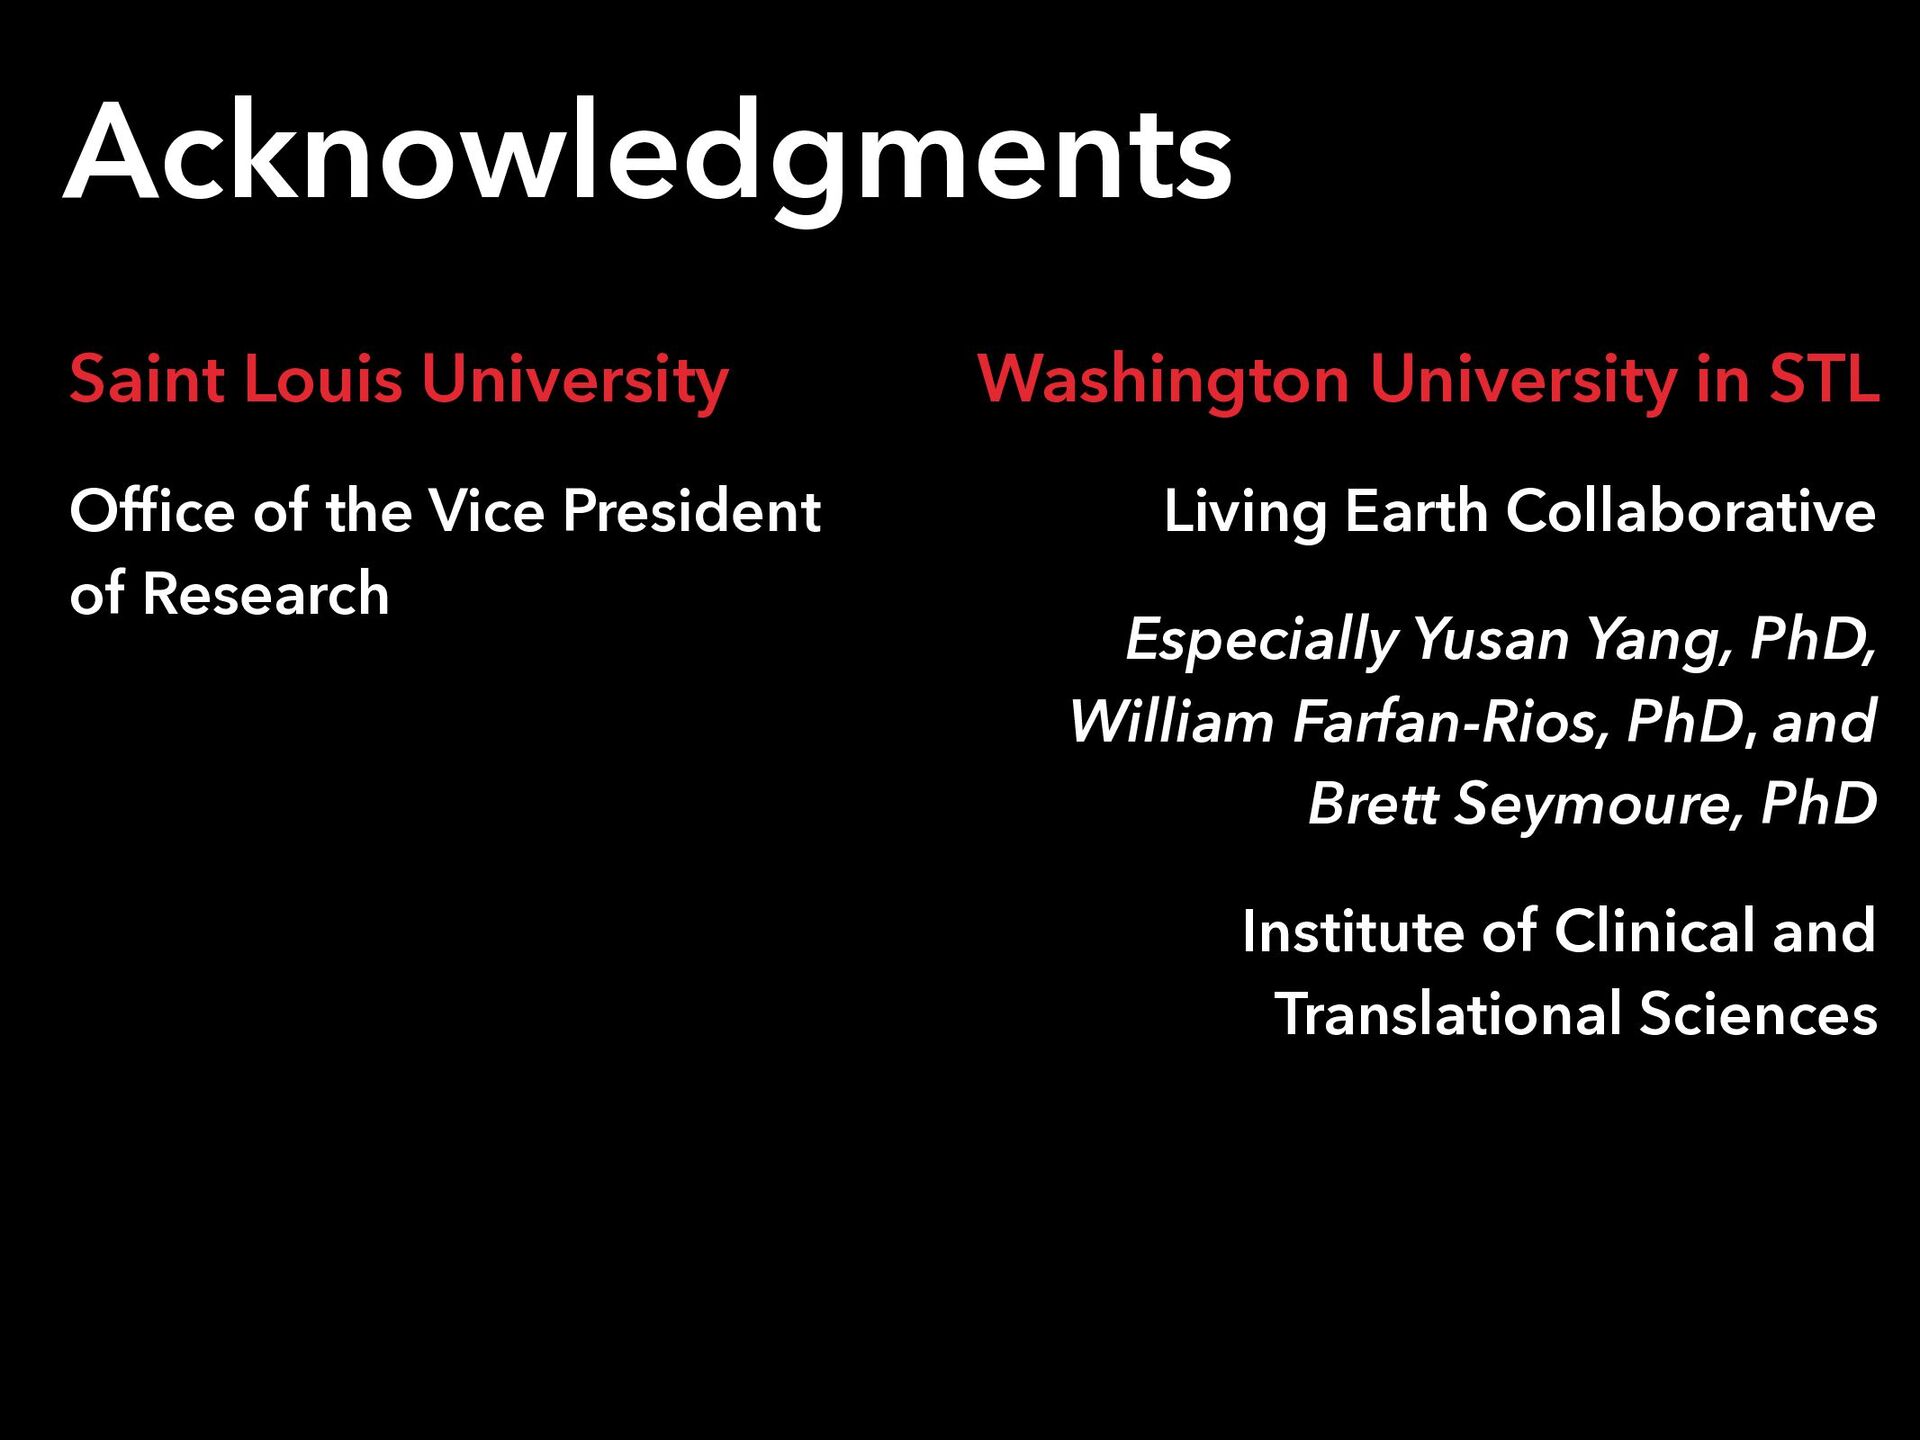
Research Washington University in STL Living Earth Collaborative Especially Yusan Yang, PhD, William Farfan-Rios, PhD, and Brett Seymoure, PhD Institute of Clinical and Translational Sciences
and computational methods ▸ Affiliations: • SLU’s Advanced HEAlth Data Research Institute • SLU’s Institute for Healing Justice and Equity • Northeastern University’s Institute for Health Equity and Social Justice Research 1. PREFACE “HI, I’M CHRIS”
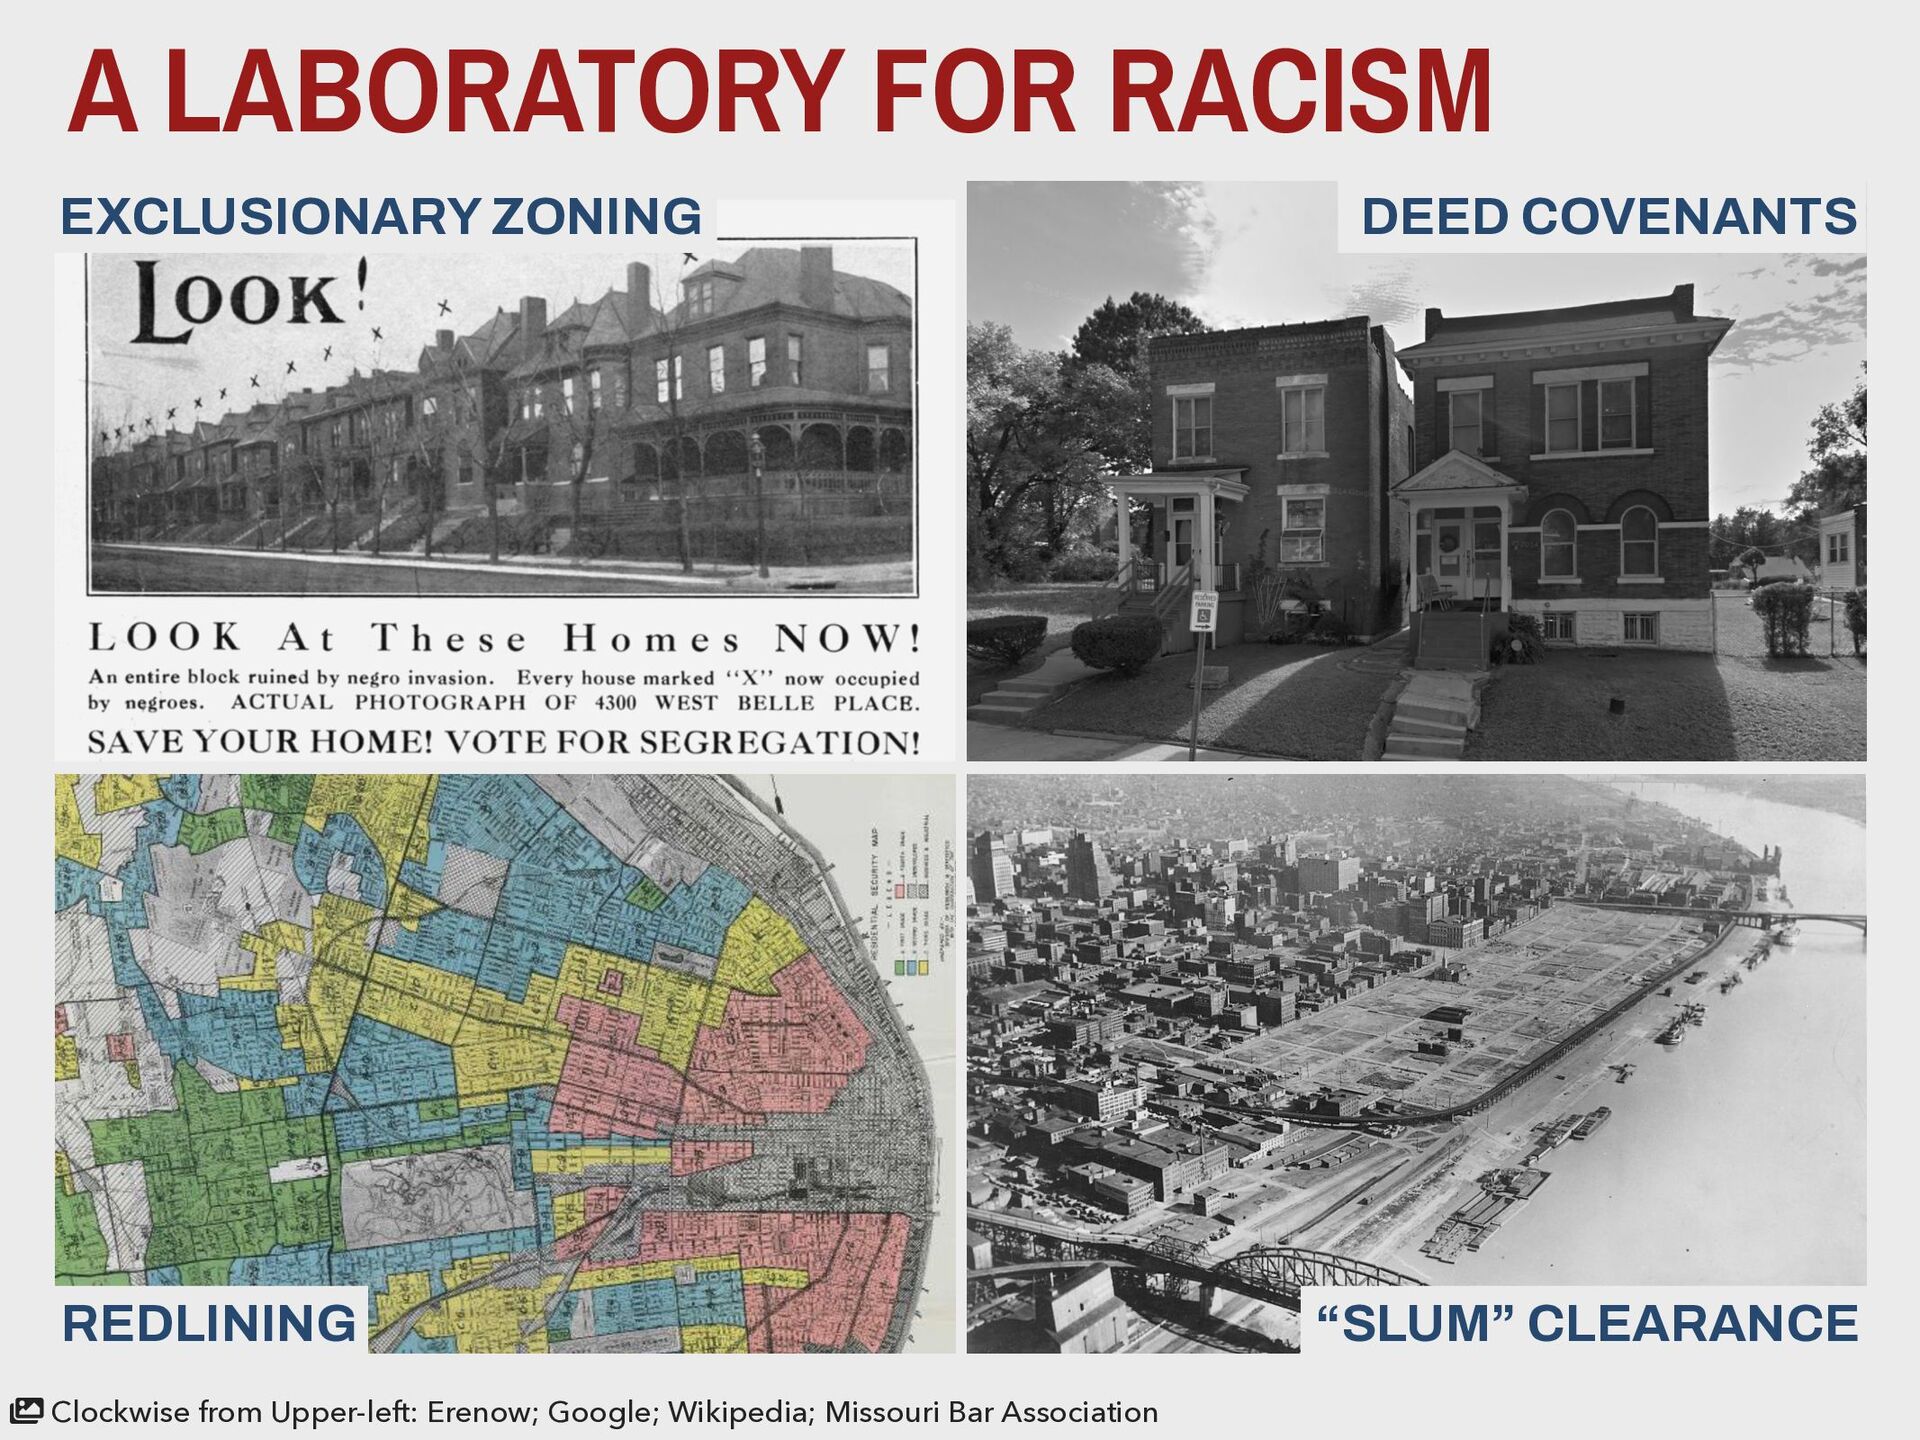
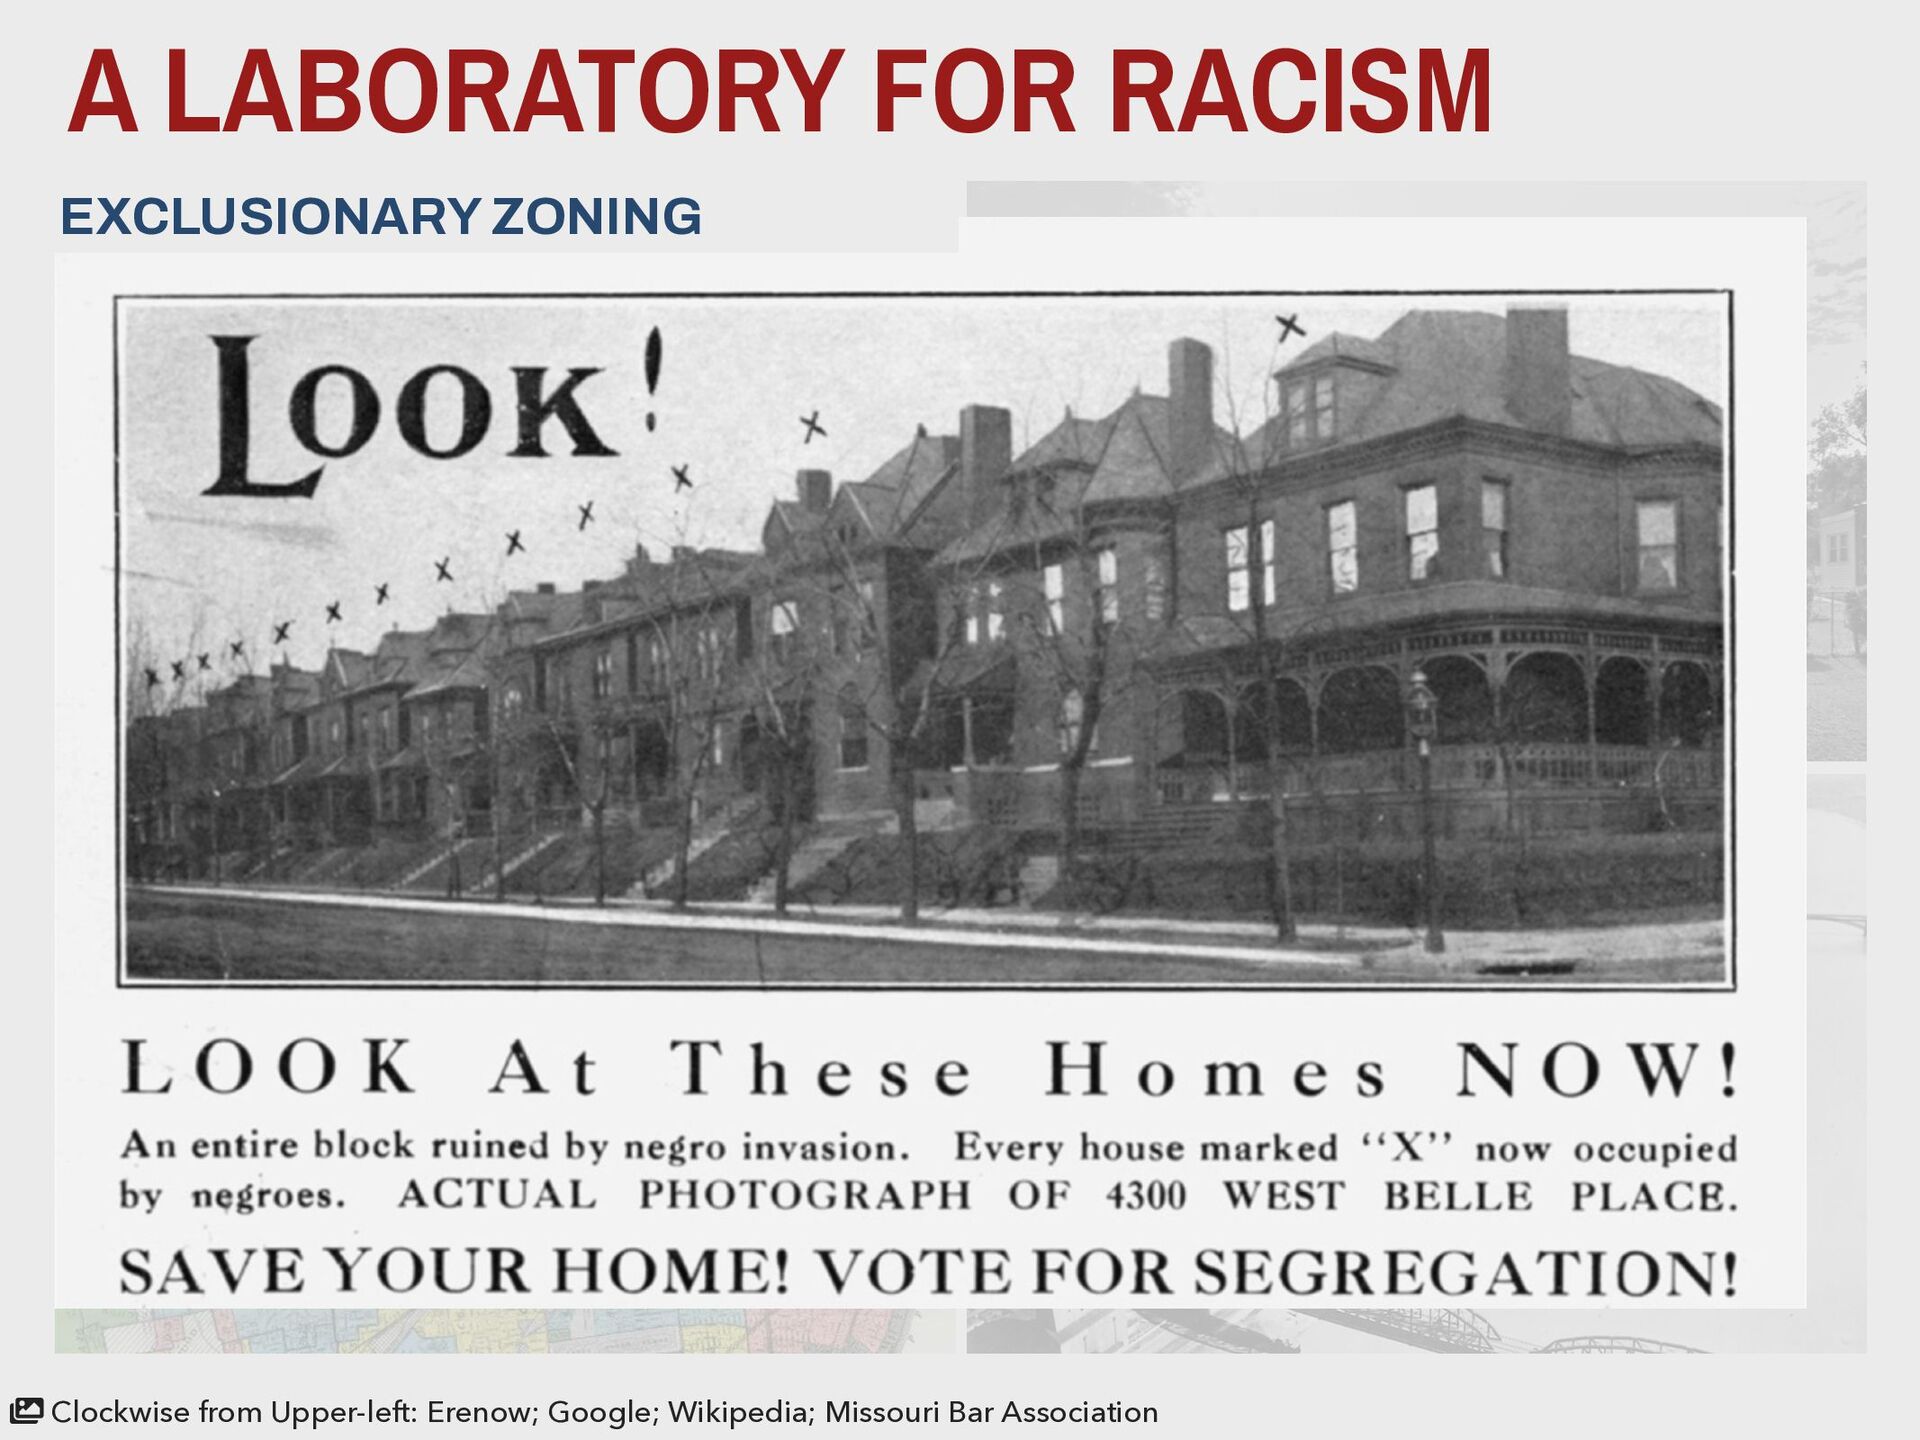
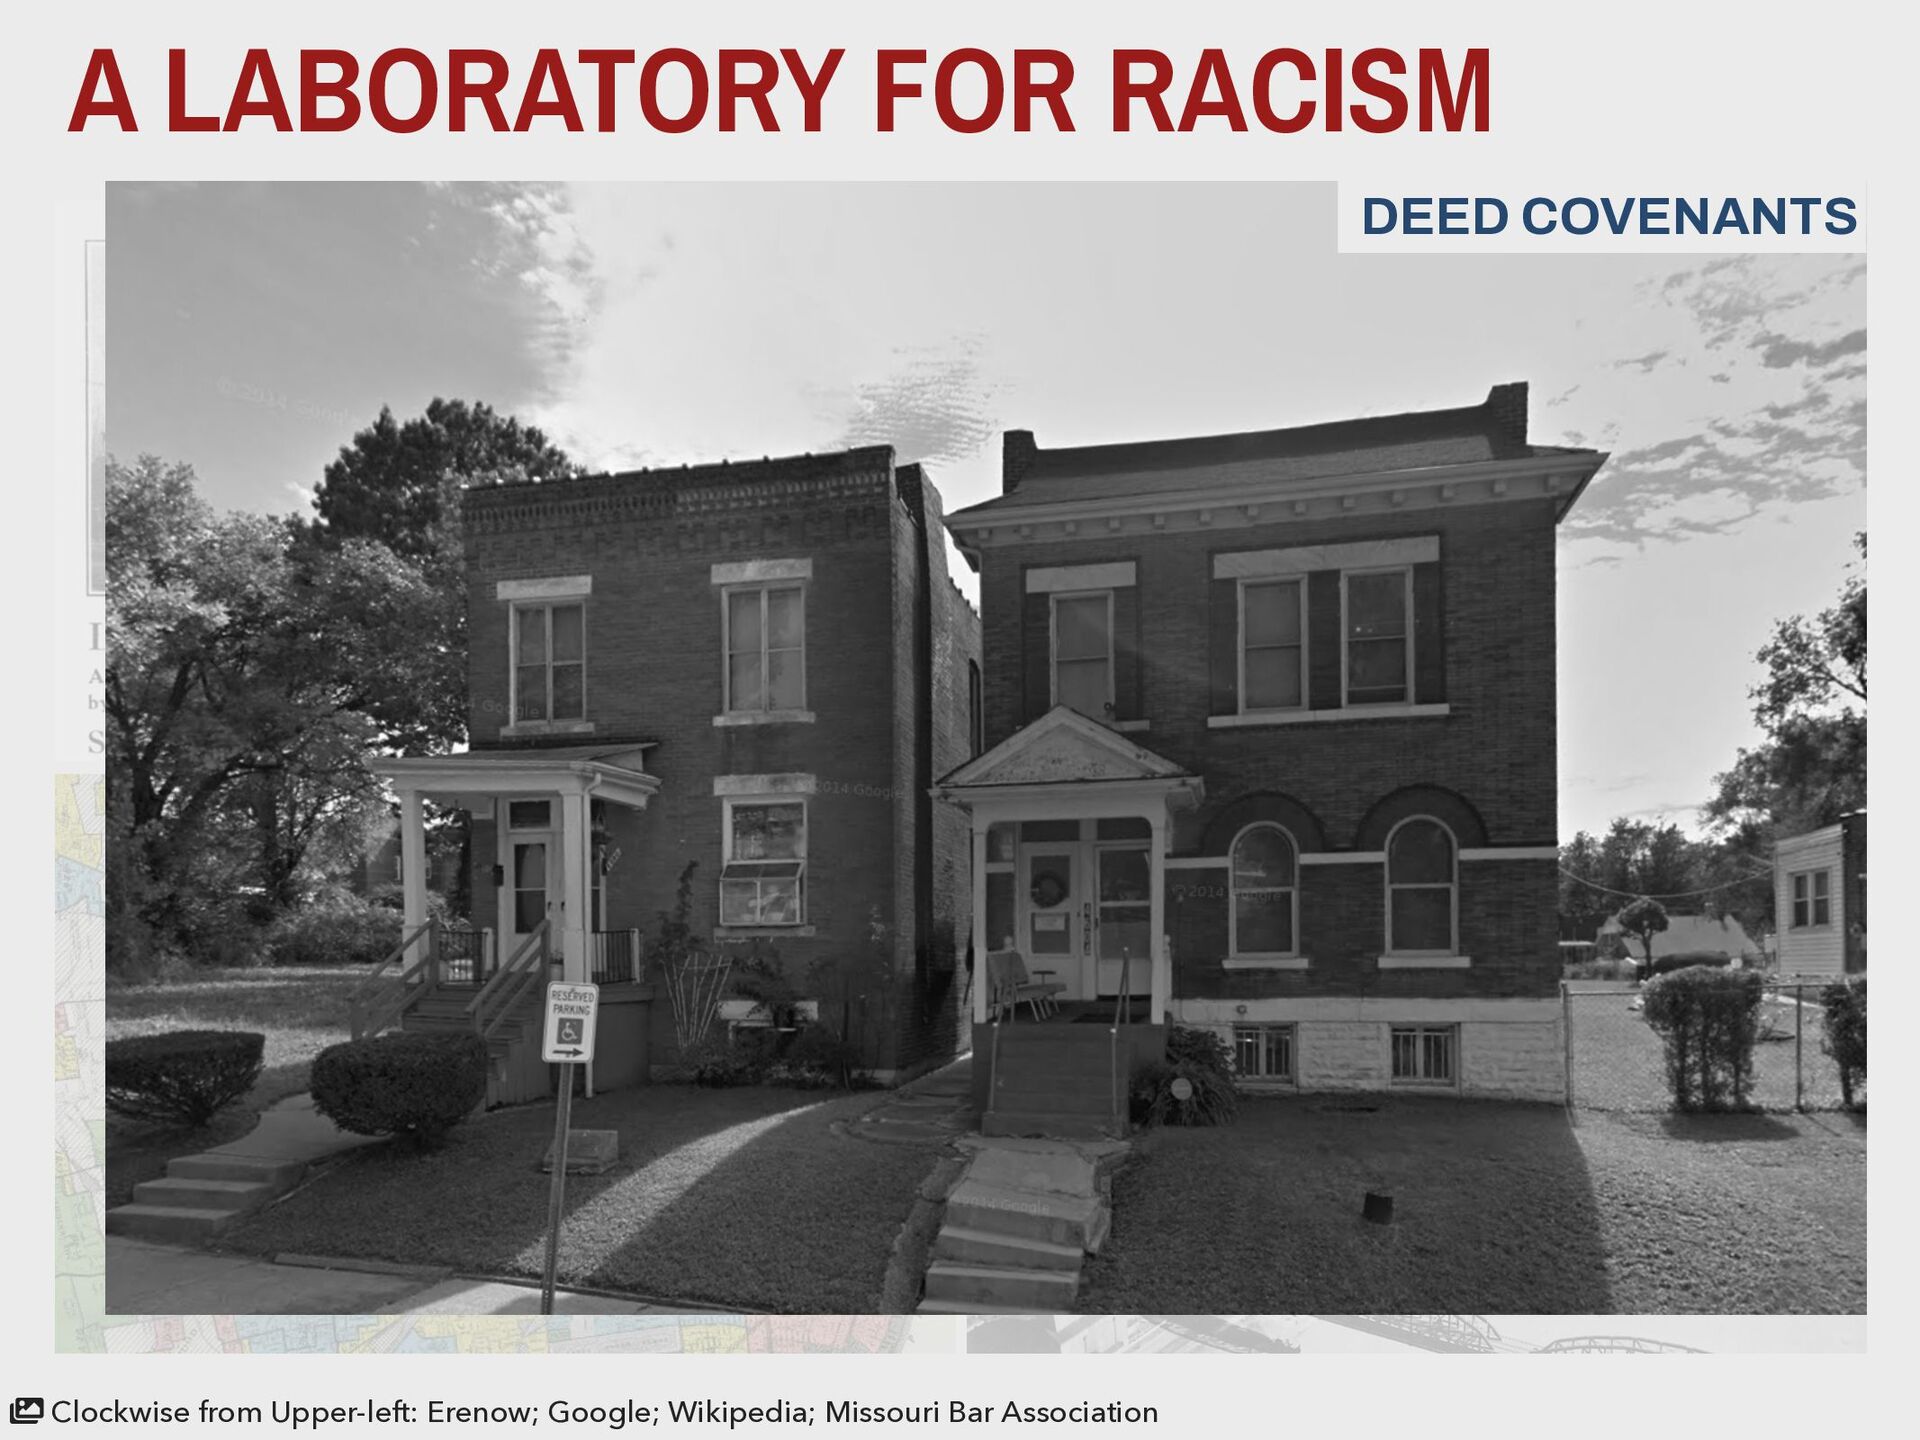
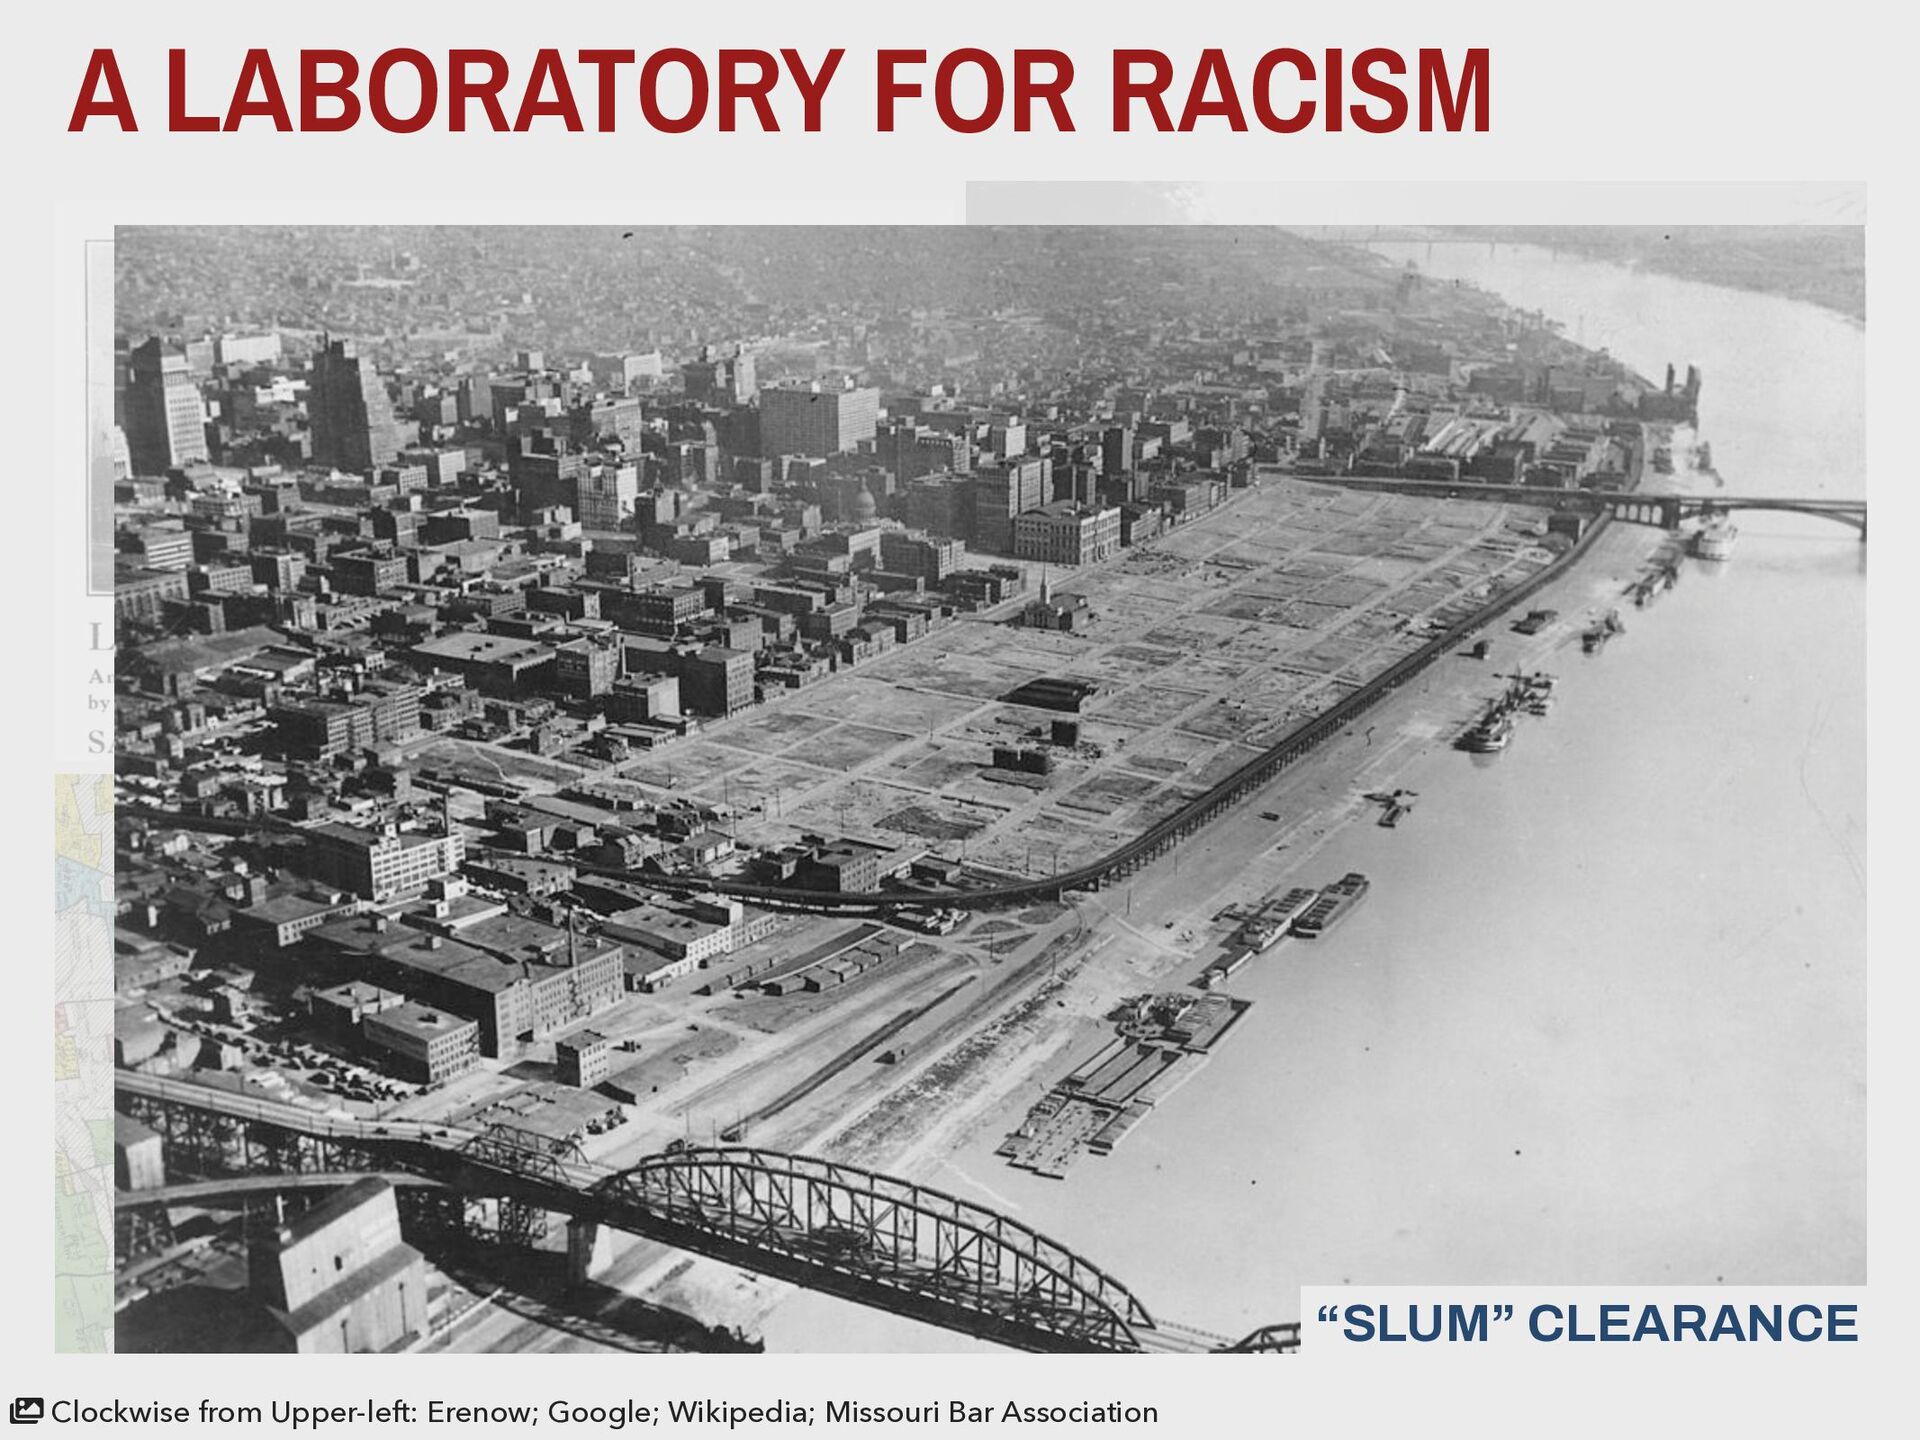
and social problems that were seen as tarnishing neighborhoods’ reputations. Forthcoming funding from ICTS via NIH CTSA UL1TR002345 NIMHD R01 currently under review; NSF under revision Subject of a book proposal currently under development What are early 20th century racism’s longterm consequences for contemporary urban life and health? Core motivation for research initiative that launches July ‘22
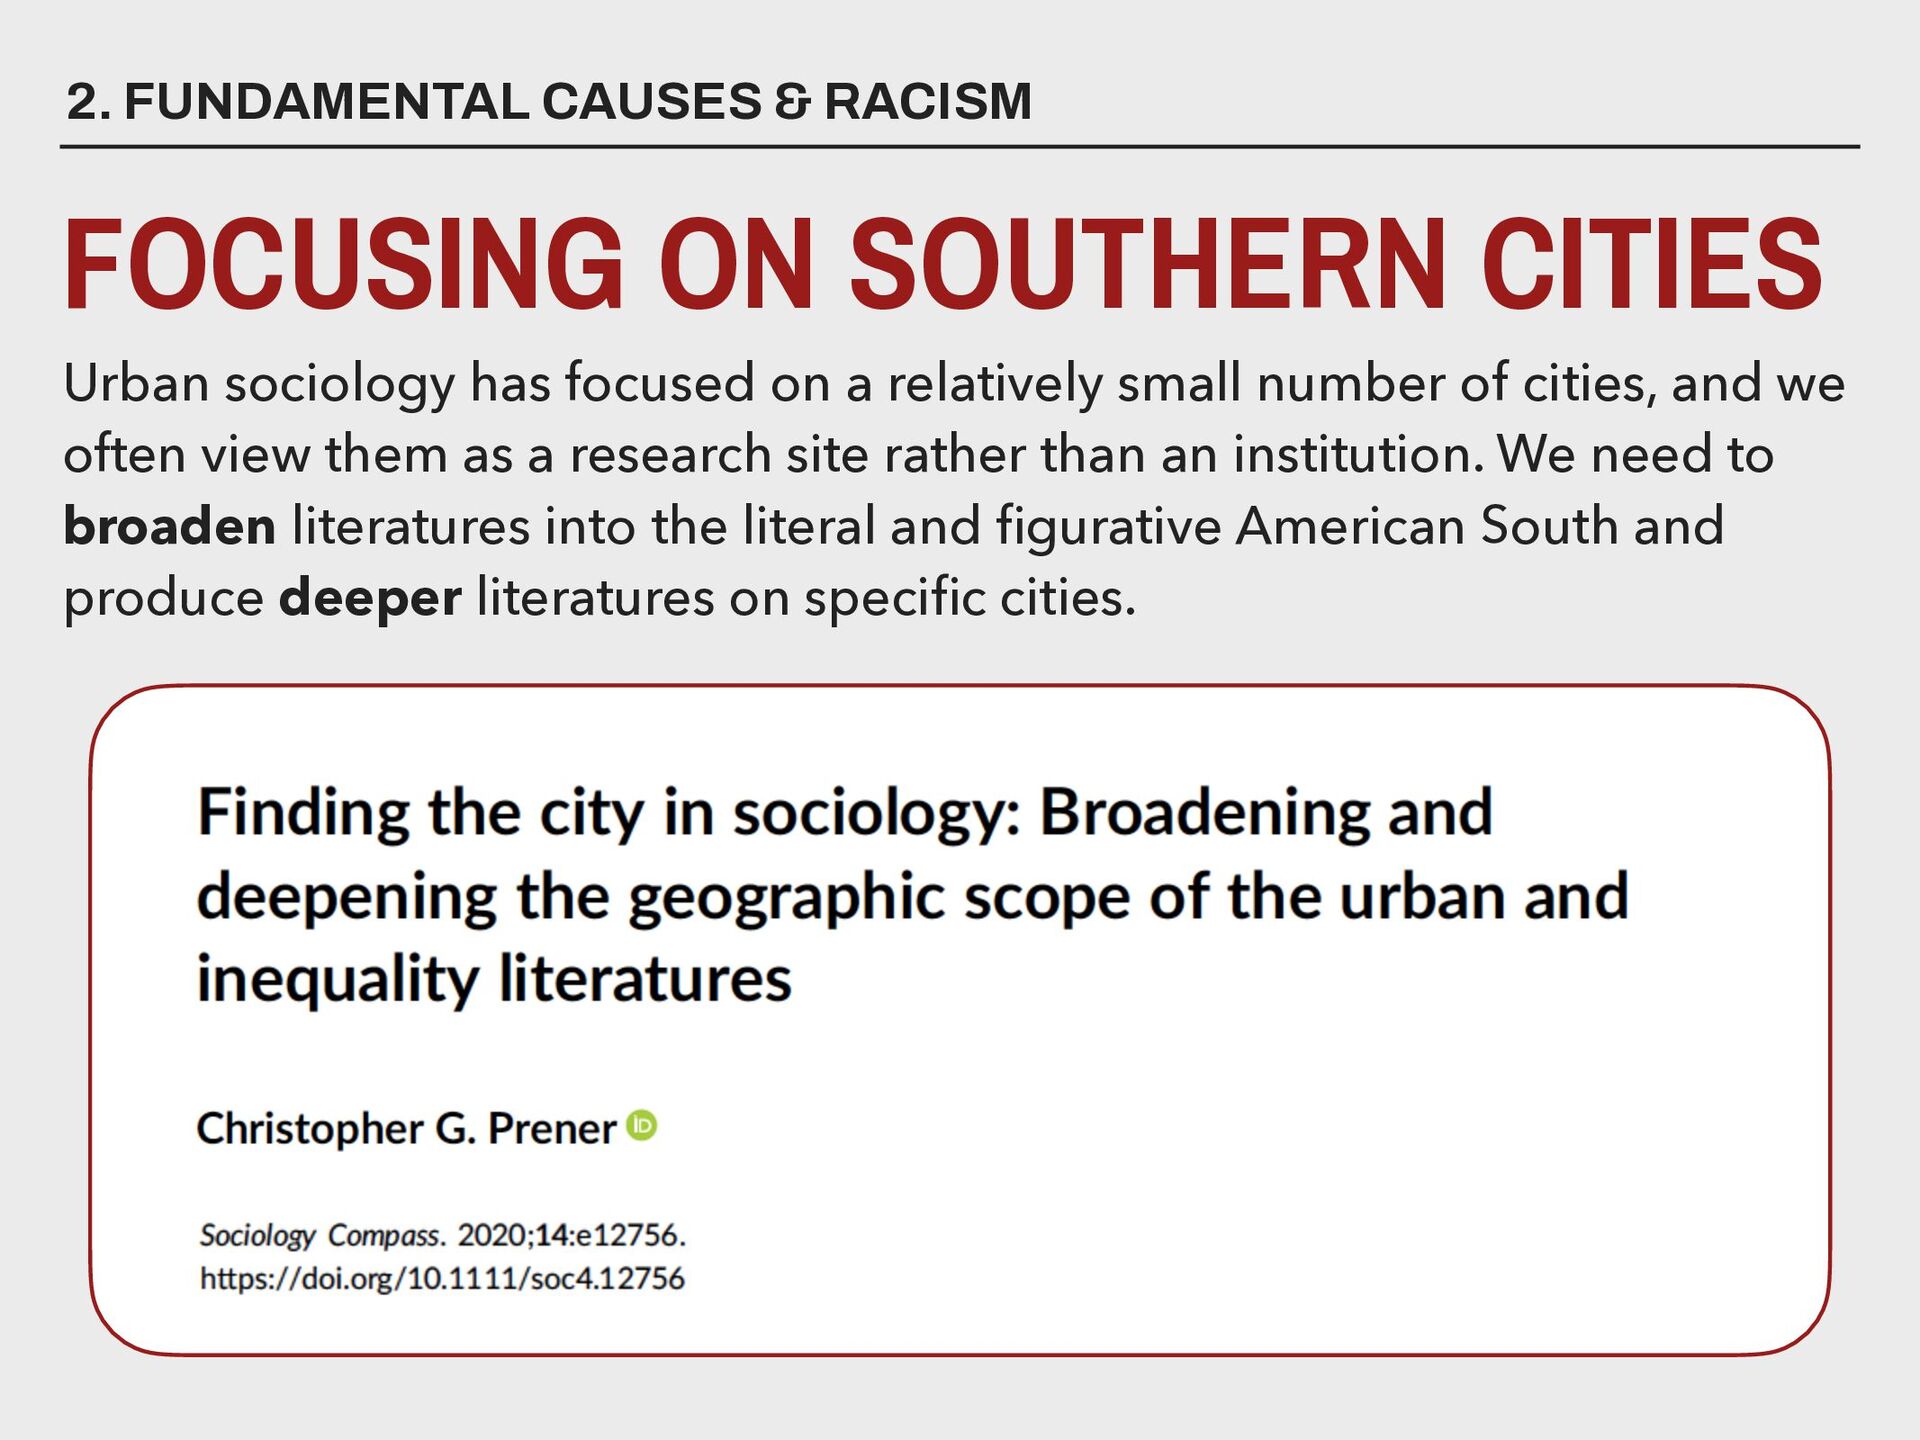
sociology has focused on a relatively small number of cities, and we often view them as a research site rather than an institution. We need to broaden literatures into the literal and figurative American South and produce deeper literatures on specific cities.
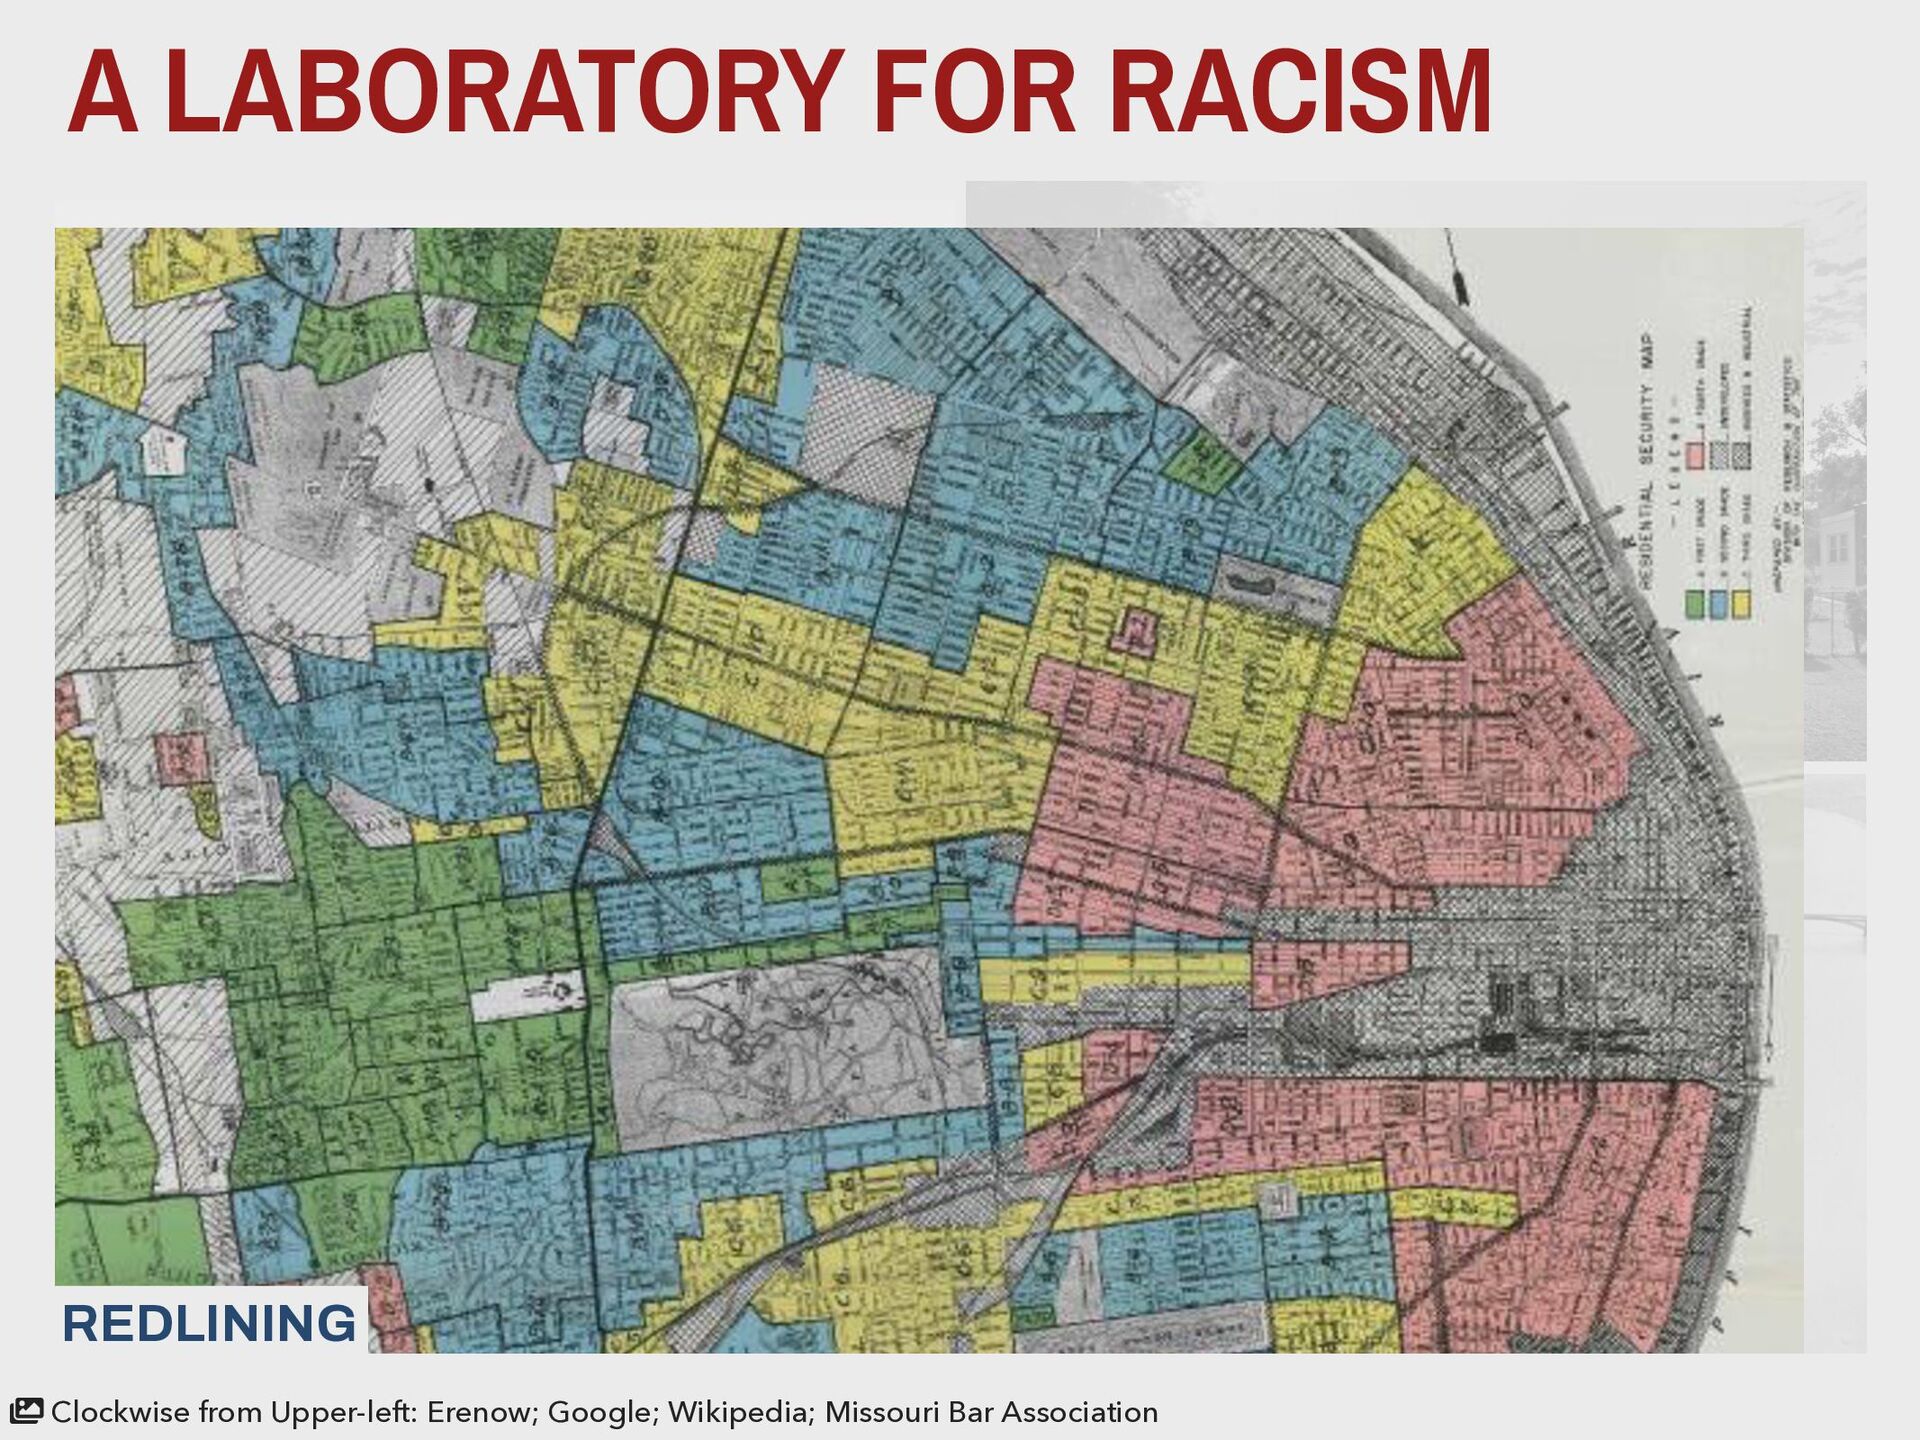
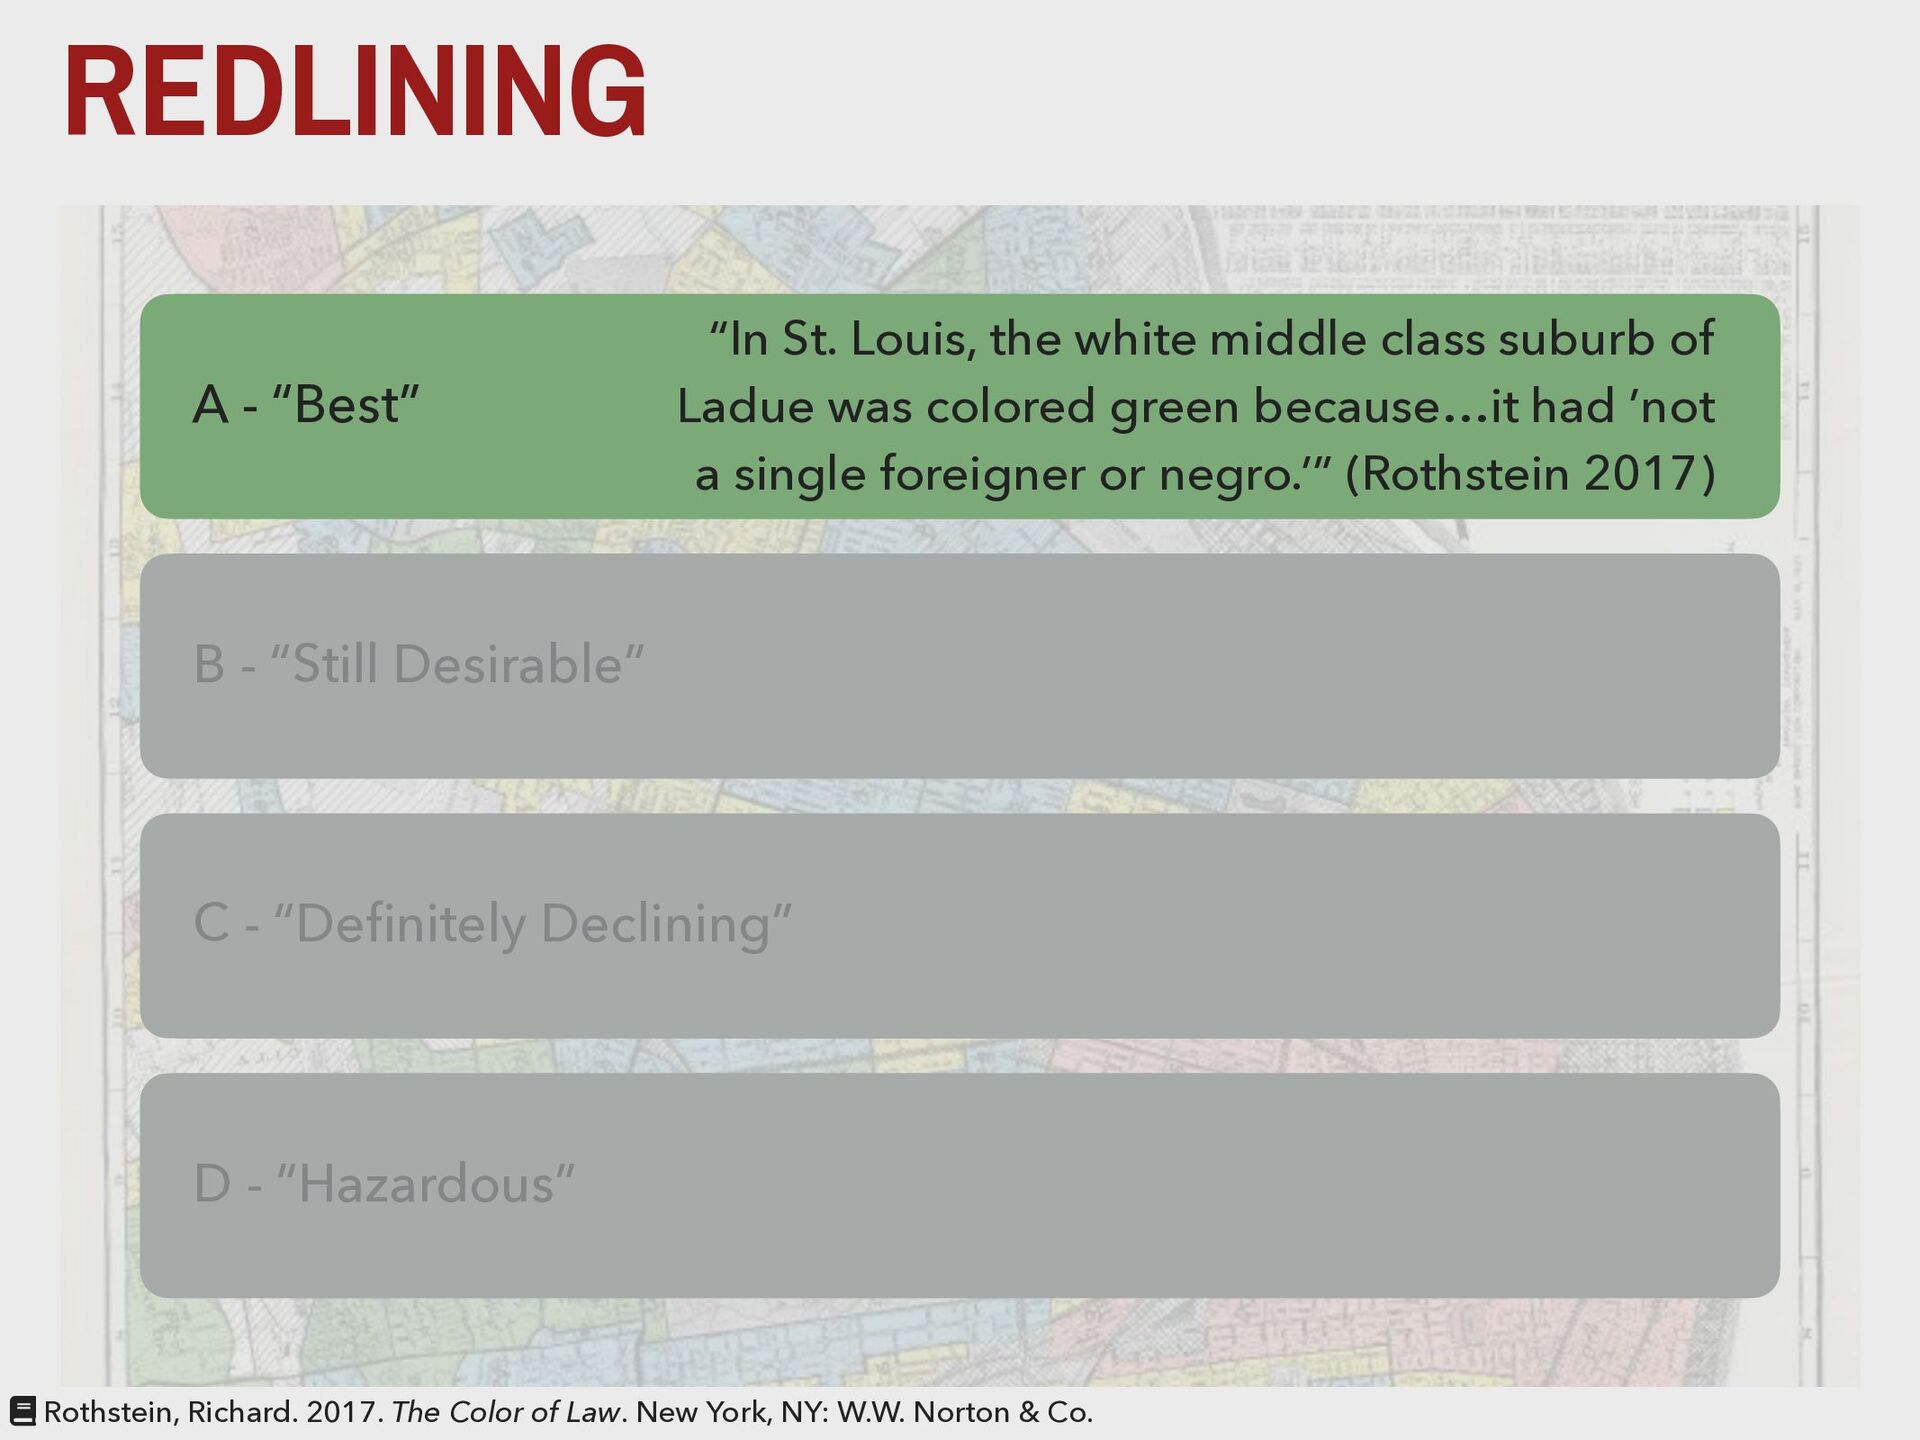
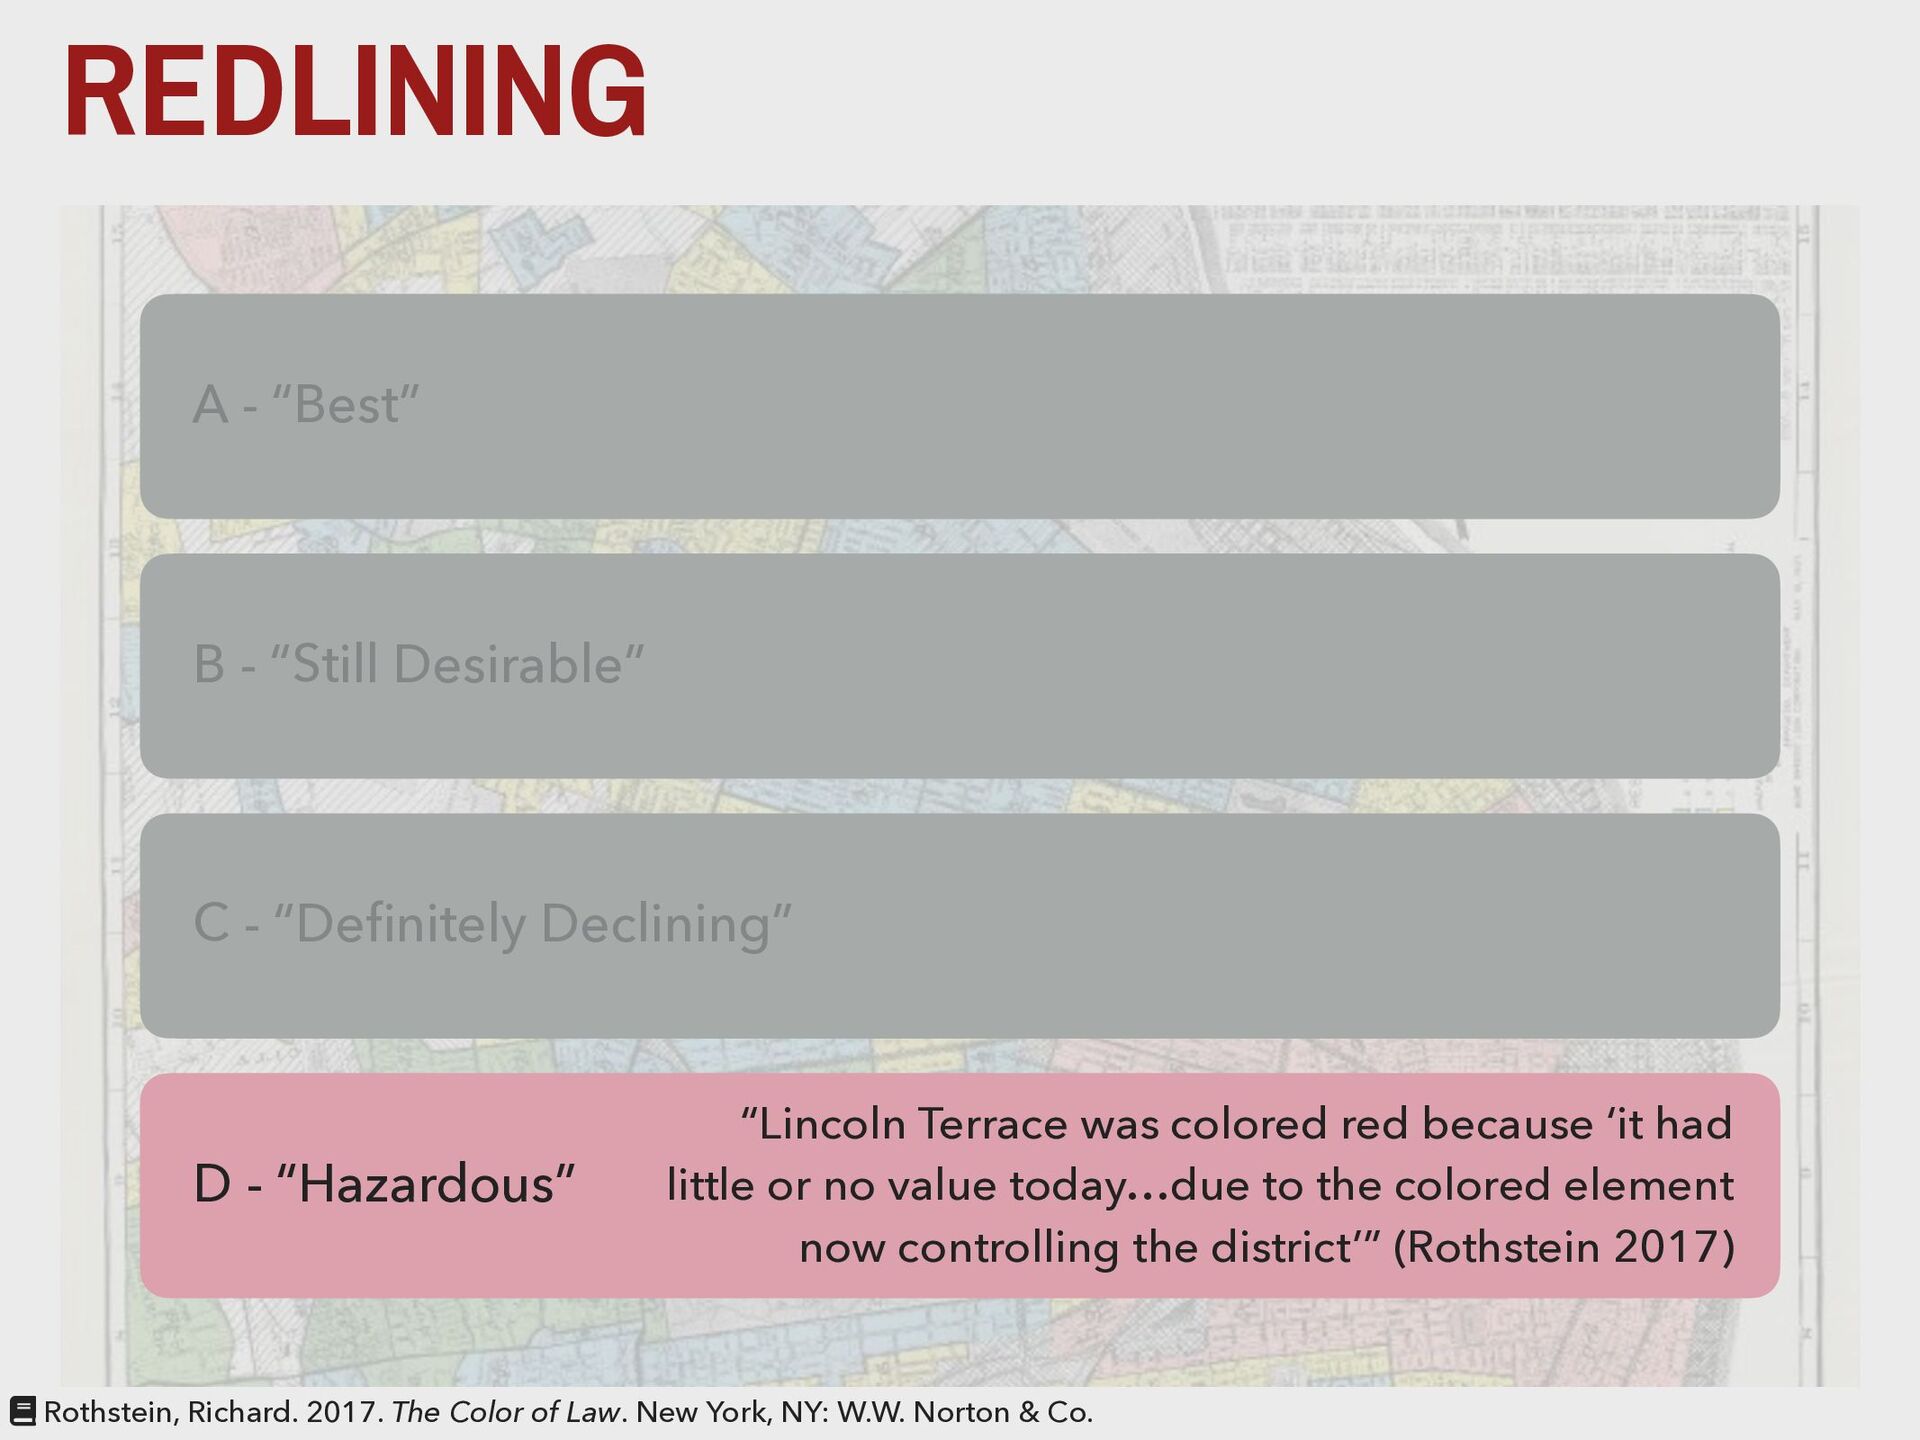
“Definitely Declining” D - “Hazardous” “In St. Louis, the white middle class suburb of Ladue was colored green because…it had ’not a single foreigner or negro.’” (Rothstein 2017) Rothstein, Richard. 2017. The Color of Law. New York, NY: W.W. Norton & Co.
“Hazardous” C - “Definitely Declining” “‘infiltration of a lower grade population’” (Hillier 2005:217) Hillier, Amy. 2005. “Residential Security Maps and Neighborhood Appraisals.” Social Science History 29(2):207-233.
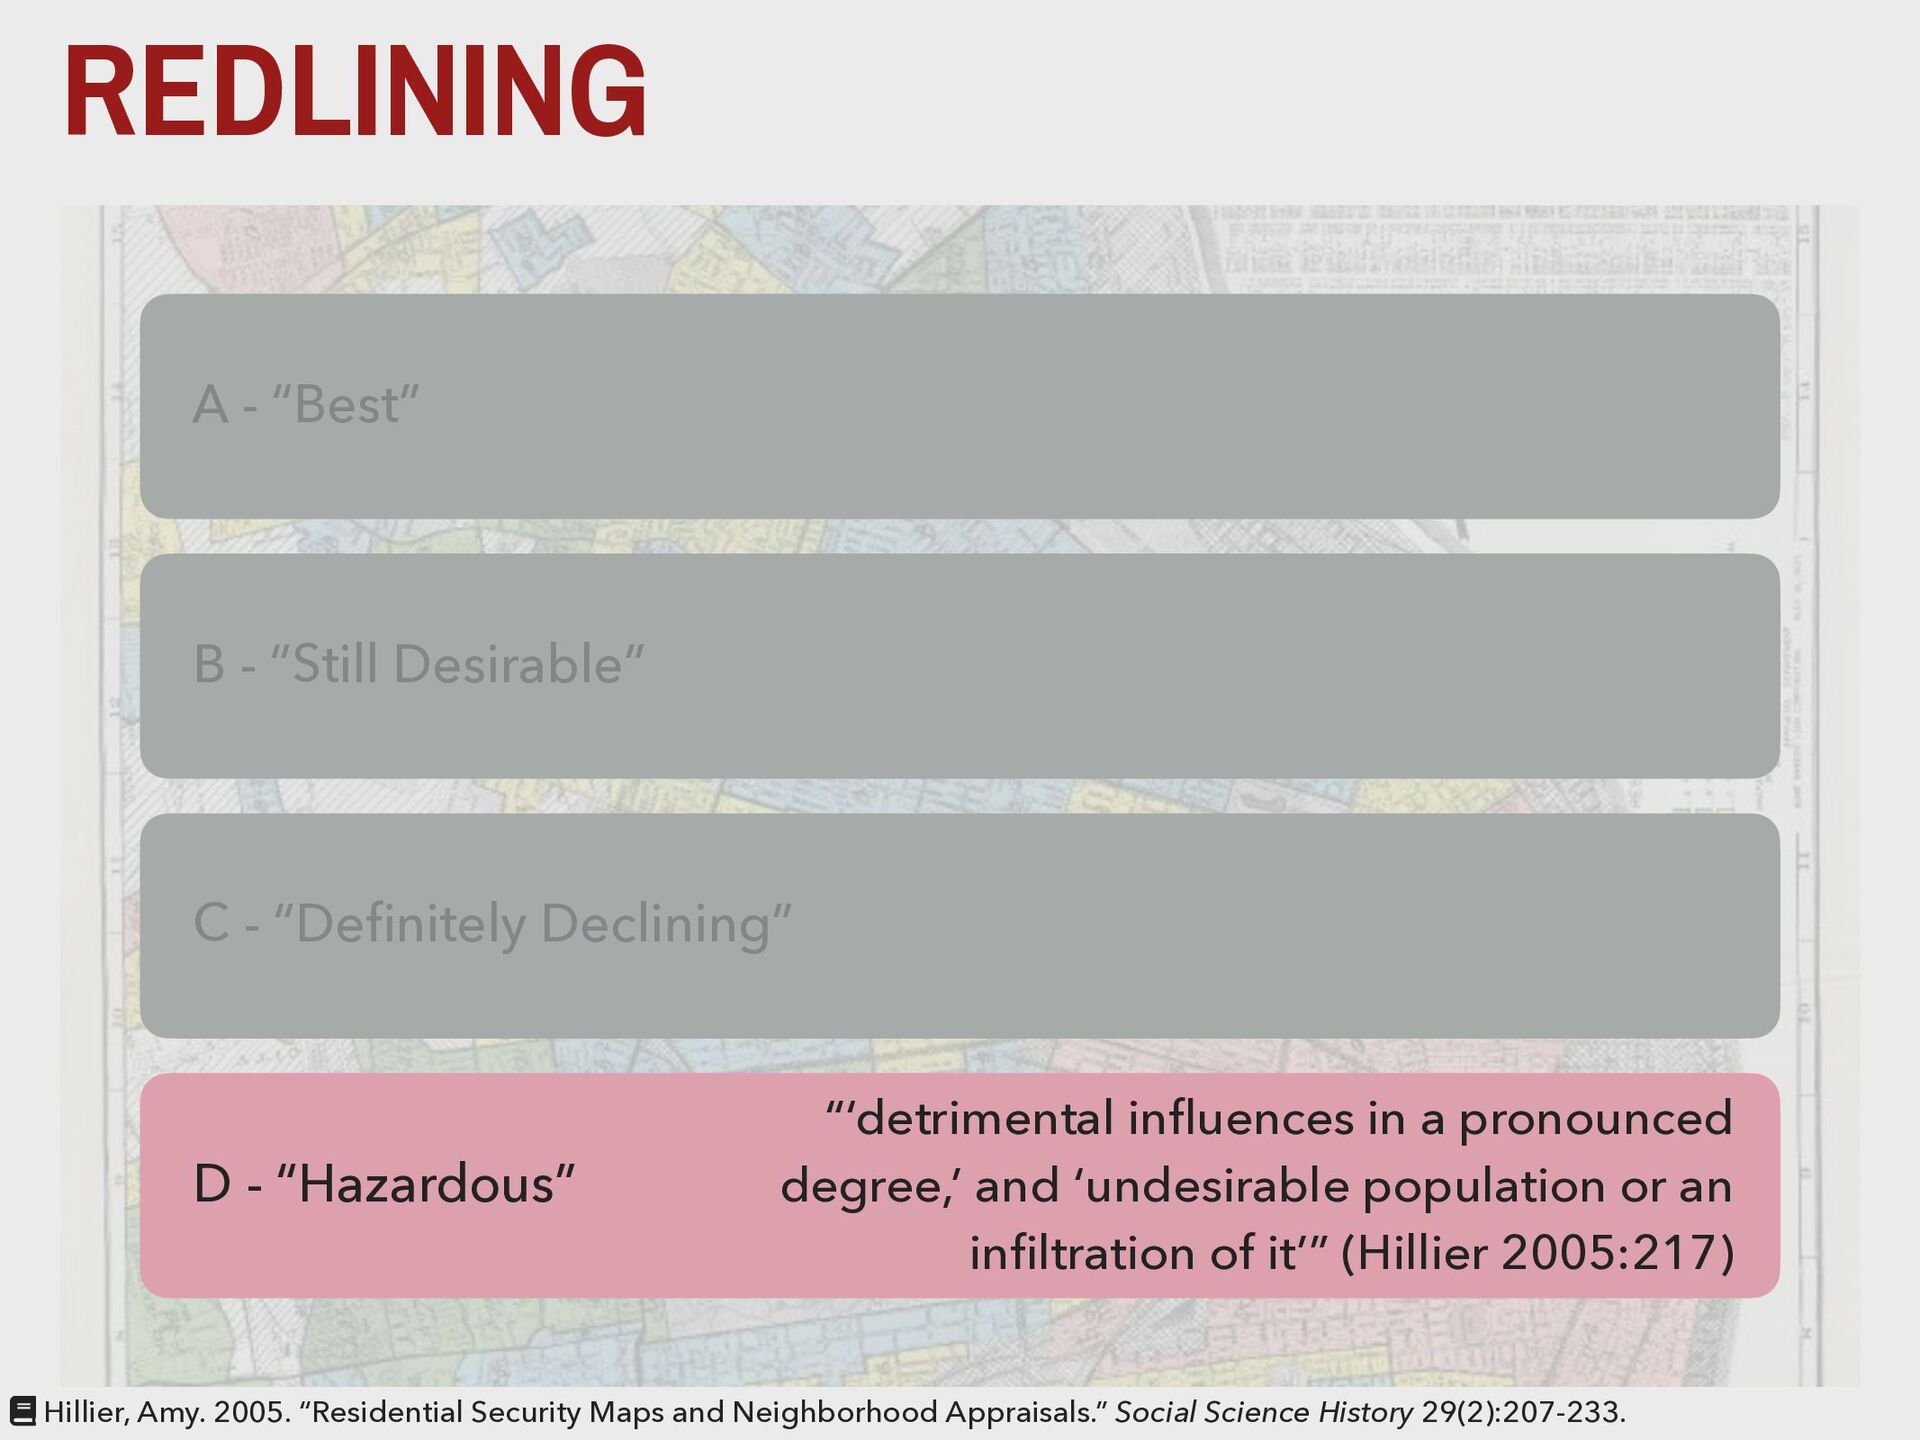
“Definitely Declining” D - “Hazardous” Hillier, Amy. 2005. “Residential Security Maps and Neighborhood Appraisals.” Social Science History 29(2):207-233. “‘detrimental influences in a pronounced degree,’ and ‘undesirable population or an infiltration of it’” (Hillier 2005:217)
“Definitely Declining” D - “Hazardous” Rothstein, Richard. 2017. The Color of Law. New York, NY: W.W. Norton & Co. “Lincoln Terrace was colored red because ‘it had little or no value today…due to the colored element now controlling the district’” (Rothstein 2017)
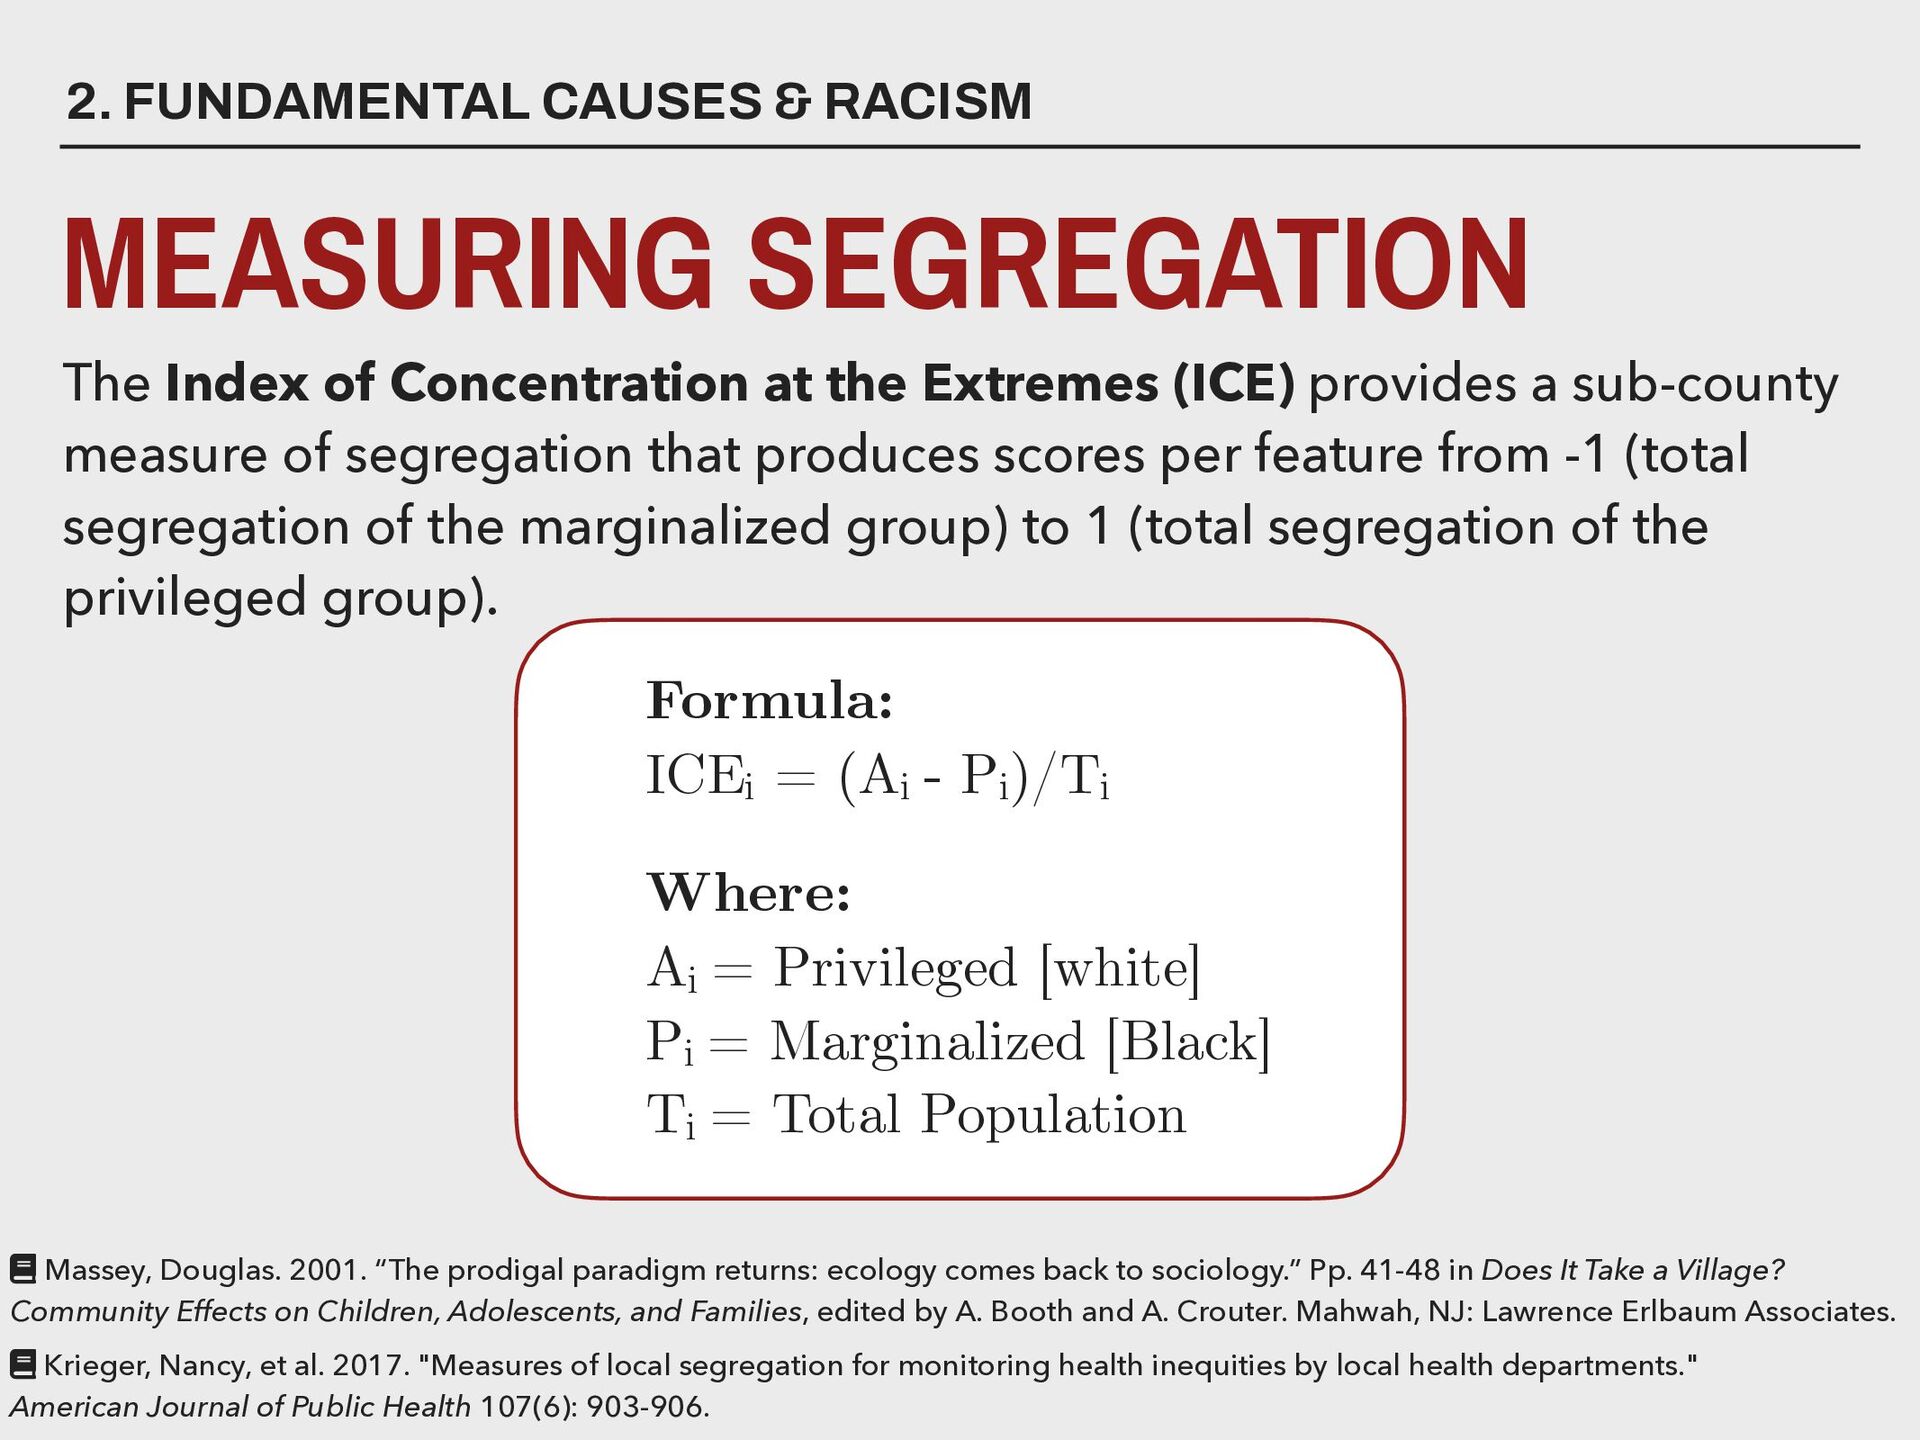
Concentration at the Extremes (ICE) provides a sub-county measure of segregation that produces scores per feature from -1 (total segregation of the marginalized group) to 1 (total segregation of the privileged group). Formula: ICEi = (Ai - Pi )/Ti Where: Ai = Privileged [white] Pi = Marginalized [Black] Ti = Total Population Massey, Douglas. 2001. “The prodigal paradigm returns: ecology comes back to sociology.” Pp. 41-48 in Does It Take a Village? Community Effects on Children, Adolescents, and Families, edited by A. Booth and A. Crouter. Mahwah, NJ: Lawrence Erlbaum Associates. Krieger, Nancy, et al. 2017. "Measures of local segregation for monitoring health inequities by local health departments." American Journal of Public Health 107(6): 903-906.
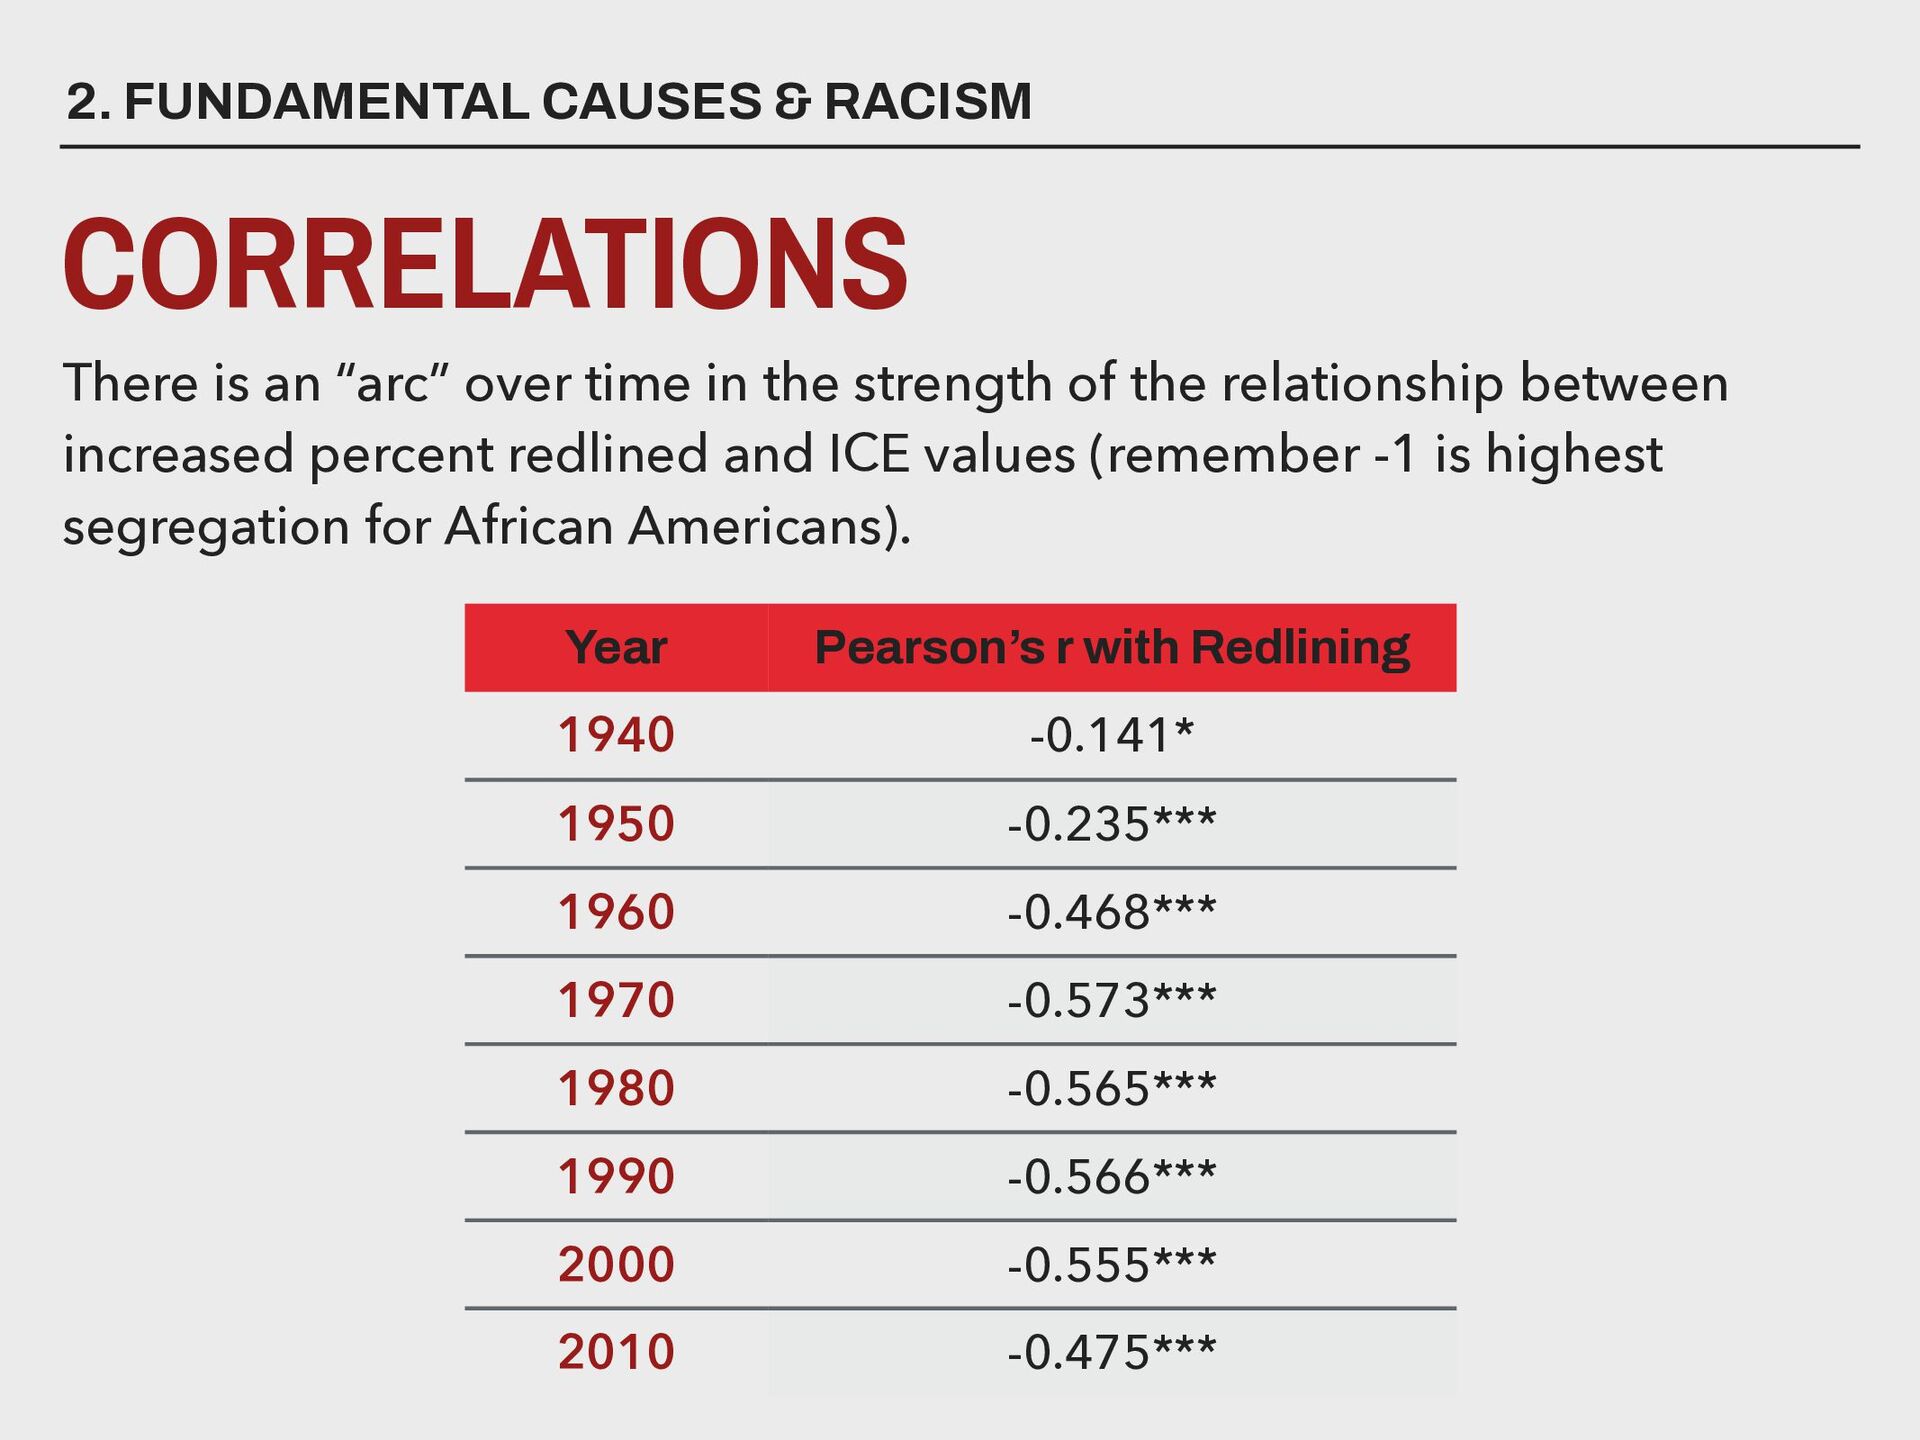
over time in the strength of the relationship between increased percent redlined and ICE values (remember -1 is highest segregation for African Americans). Year Pearson’s r with Redlining 1940 -0.141* 1950 -0.235*** 1960 -0.468*** 1970 -0.573*** 1980 -0.565*** 1990 -0.566*** 2000 -0.555*** 2010 -0.475***
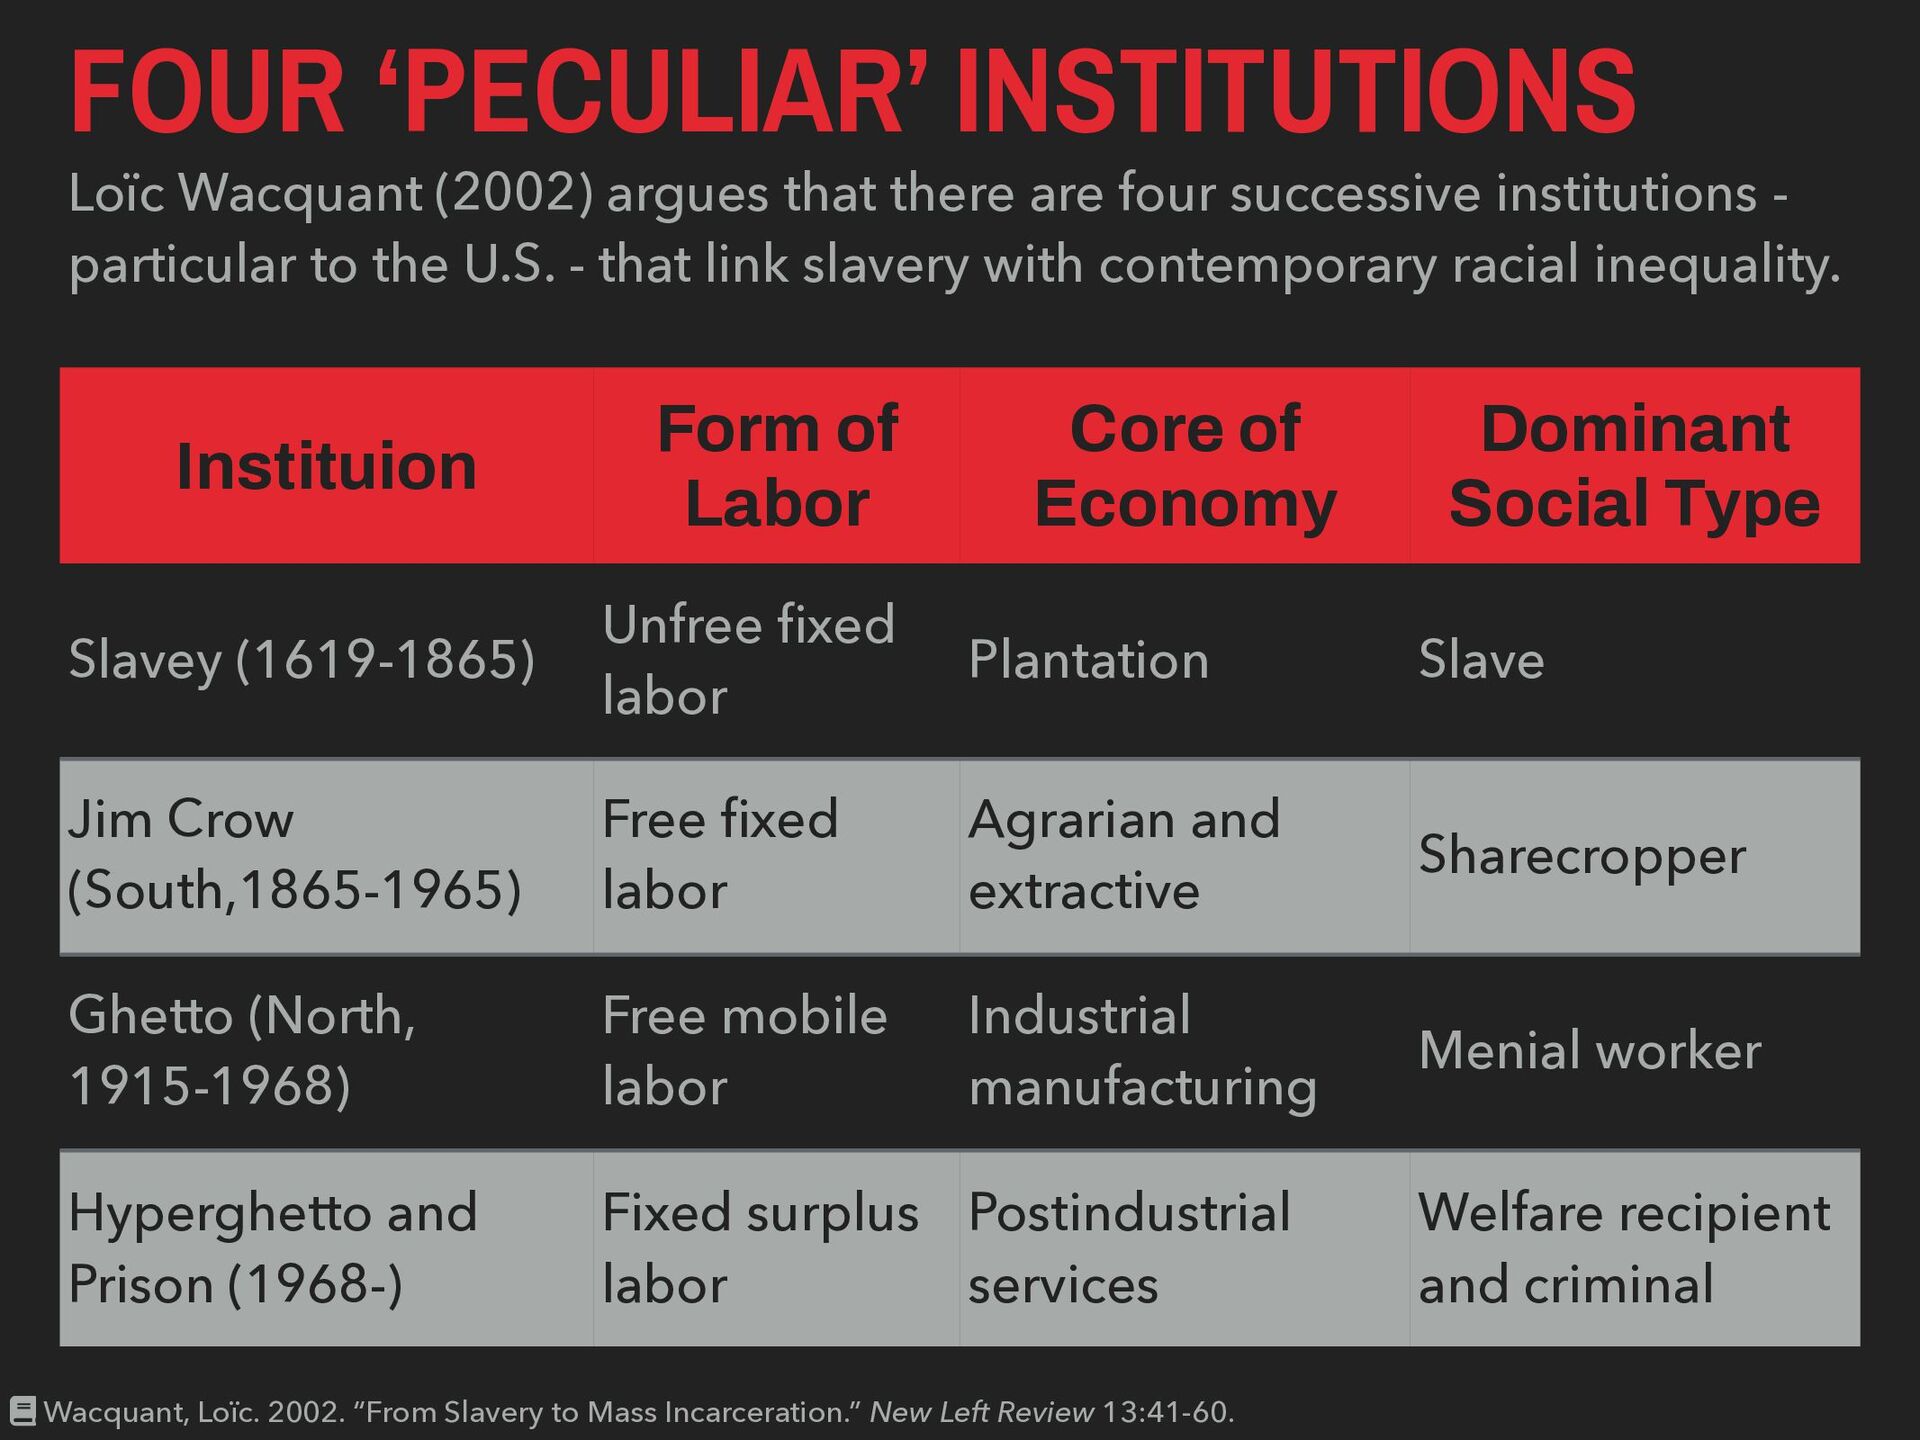
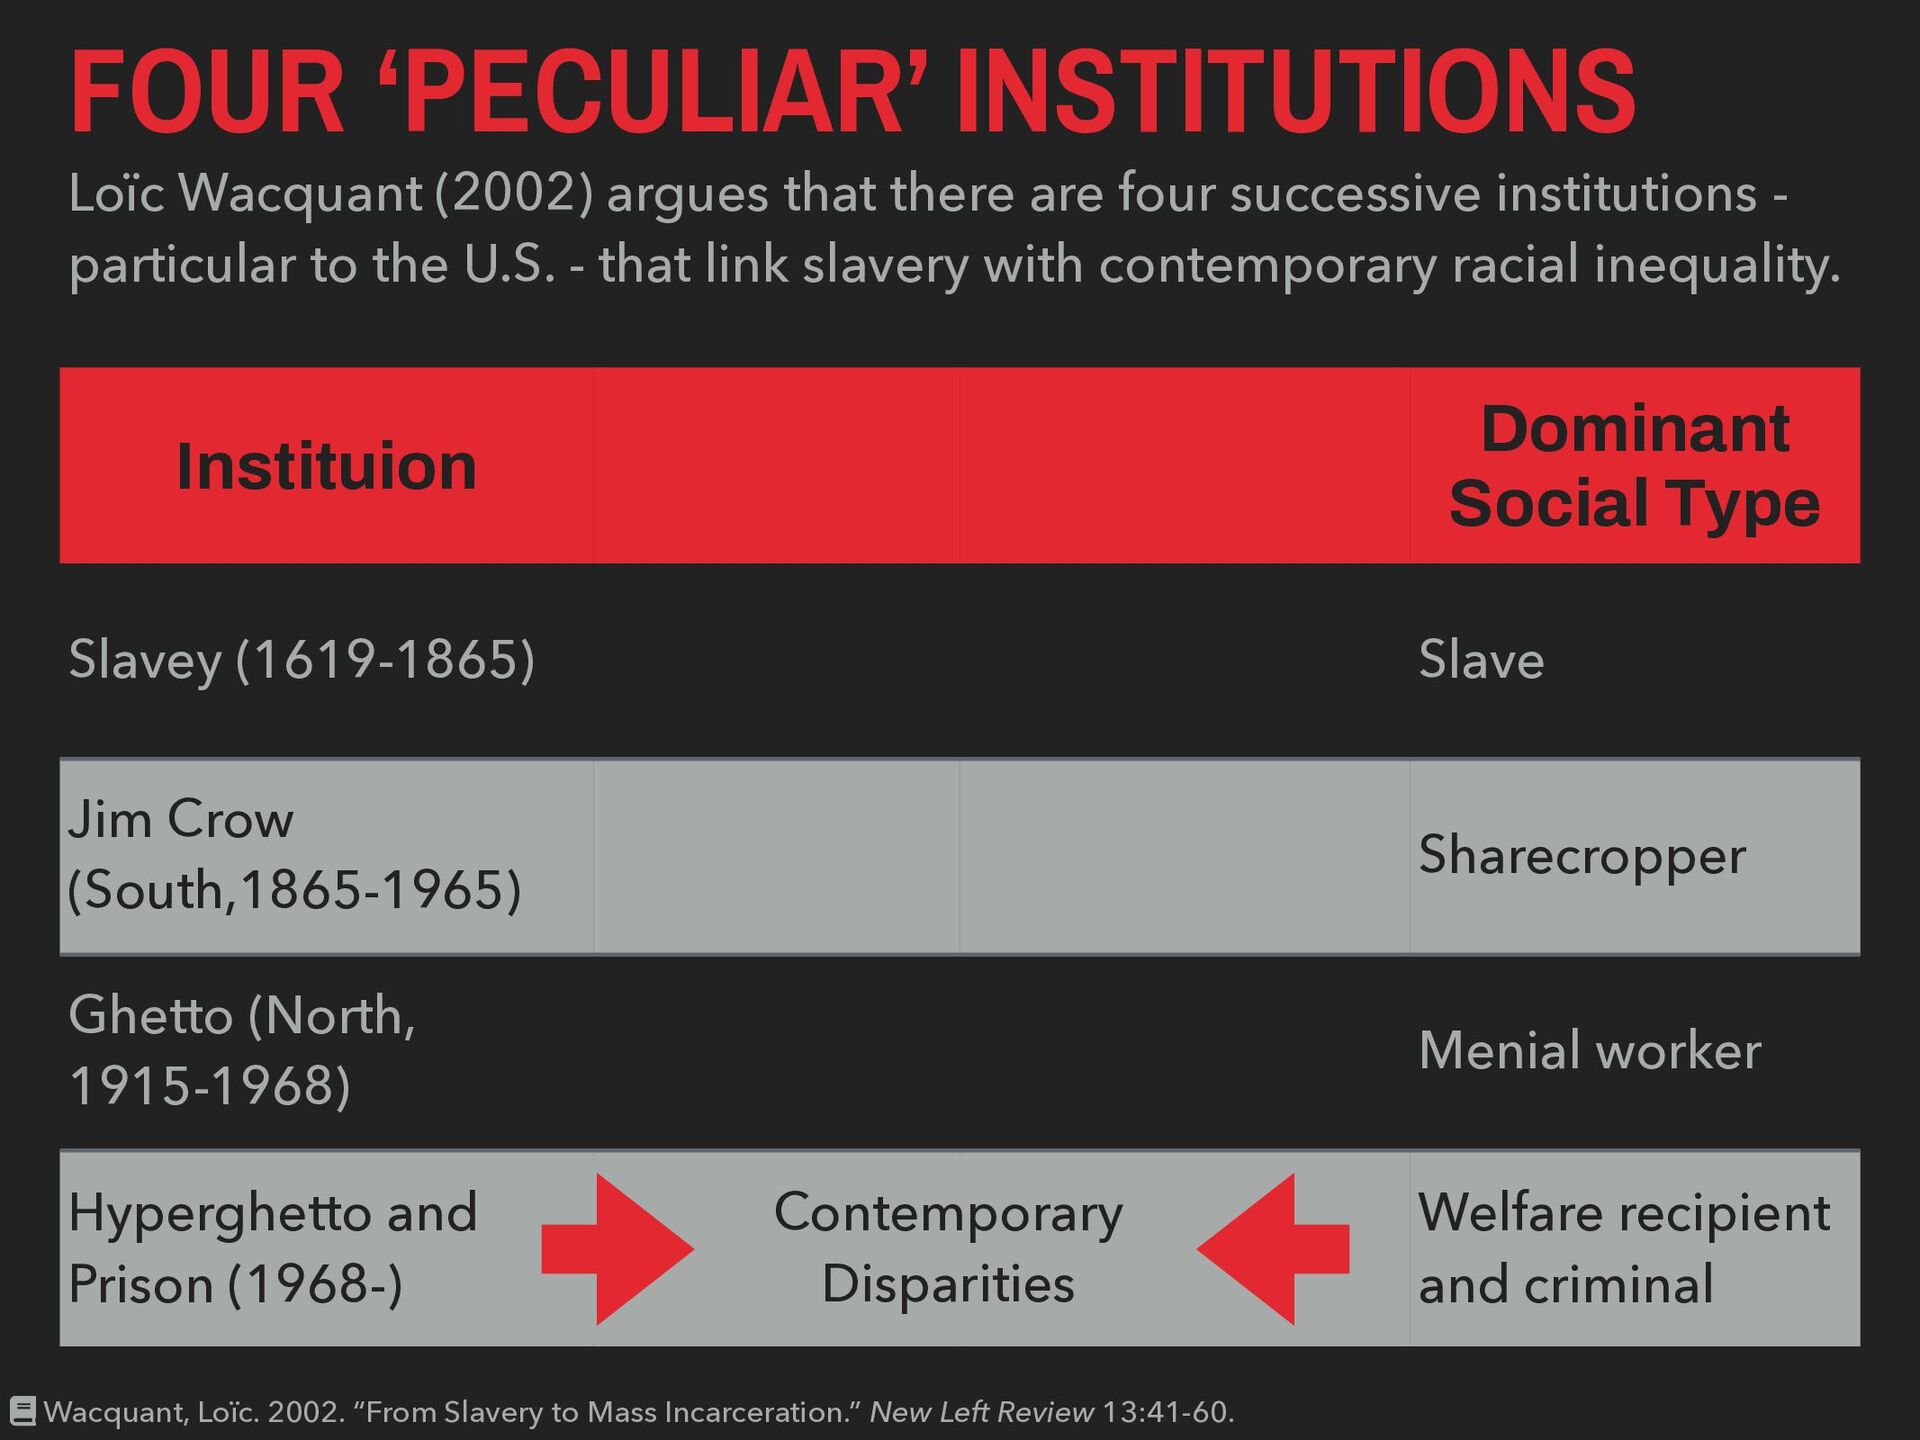
Dominant Social Type Slavey (1619-1865) Unfree fixed labor Plantation Slave Jim Crow (South,1865-1965) Free fixed labor Agrarian and extractive Sharecropper Ghetto (North, 1915-1968) Free mobile labor Industrial manufacturing Menial worker Hyperghetto and Prison (1968-) Fixed surplus labor Postindustrial services Welfare recipient and criminal Loïc Wacquant (2002) argues that there are four successive institutions - particular to the U.S. - that link slavery with contemporary racial inequality. Wacquant, Loïc. 2002. “From Slavery to Mass Incarceration.” New Left Review 13:41-60.
Dominant Social Type Slavey (1619-1865) Unfree fixed labor Plantation Slave Jim Crow (South,1865-1965) Free fixed labor Agrarian and extractive Sharecropper Ghetto (North, 1915-1968) Free mobile labor Industrial manufacturing Menial worker Hyperghetto and Prison (1968-) Fixed surplus labor Postindustrial services Welfare recipient and criminal Loïc Wacquant (2002) argues that there are four successive institutions - particular to the U.S. - that link slavery with contemporary racial inequality. Contemporary Disparities Wacquant, Loïc. 2002. “From Slavery to Mass Incarceration.” New Left Review 13:41-60.
Dominant Social Type Slavey (1619-1865) Unfree fixed labor Plantation Slave Jim Crow (South,1865-1965) Free fixed labor Agrarian and extractive Sharecropper Ghetto (North, 1915-1968) Free mobile labor Industrial manufacturing Menial worker Hyperghetto and Prison (1968-) Fixed surplus labor Postindustrial services Welfare recipient and criminal Loïc Wacquant (2002) argues that there are four successive institutions - particular to the U.S. - that link slavery with contemporary racial inequality. Contemporary Disparities Wacquant, Loïc. 2002. “From Slavery to Mass Incarceration.” New Left Review 13:41-60.
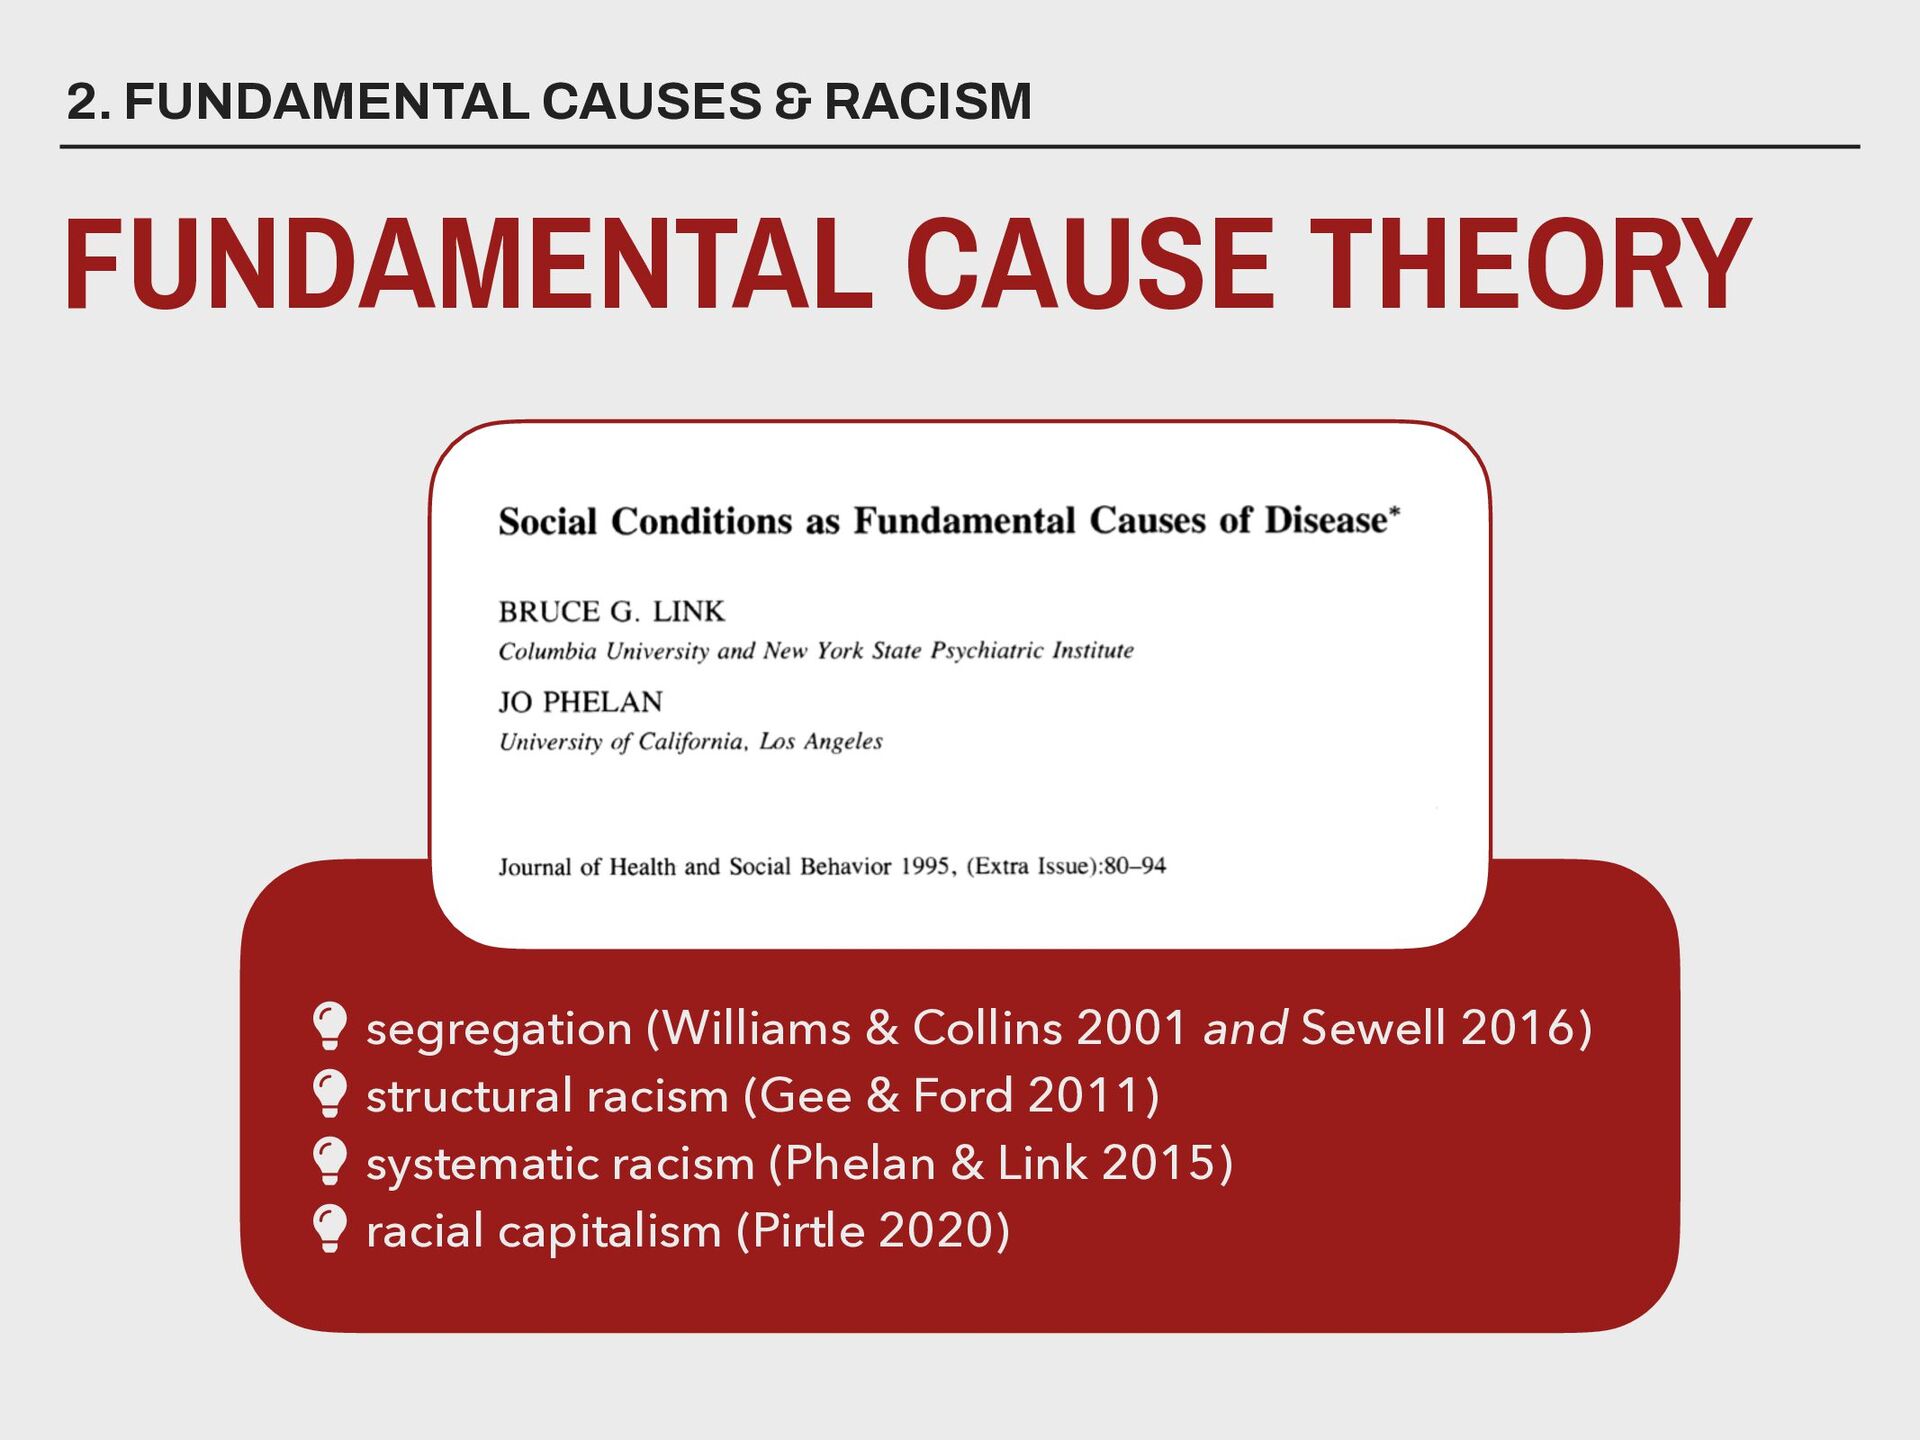
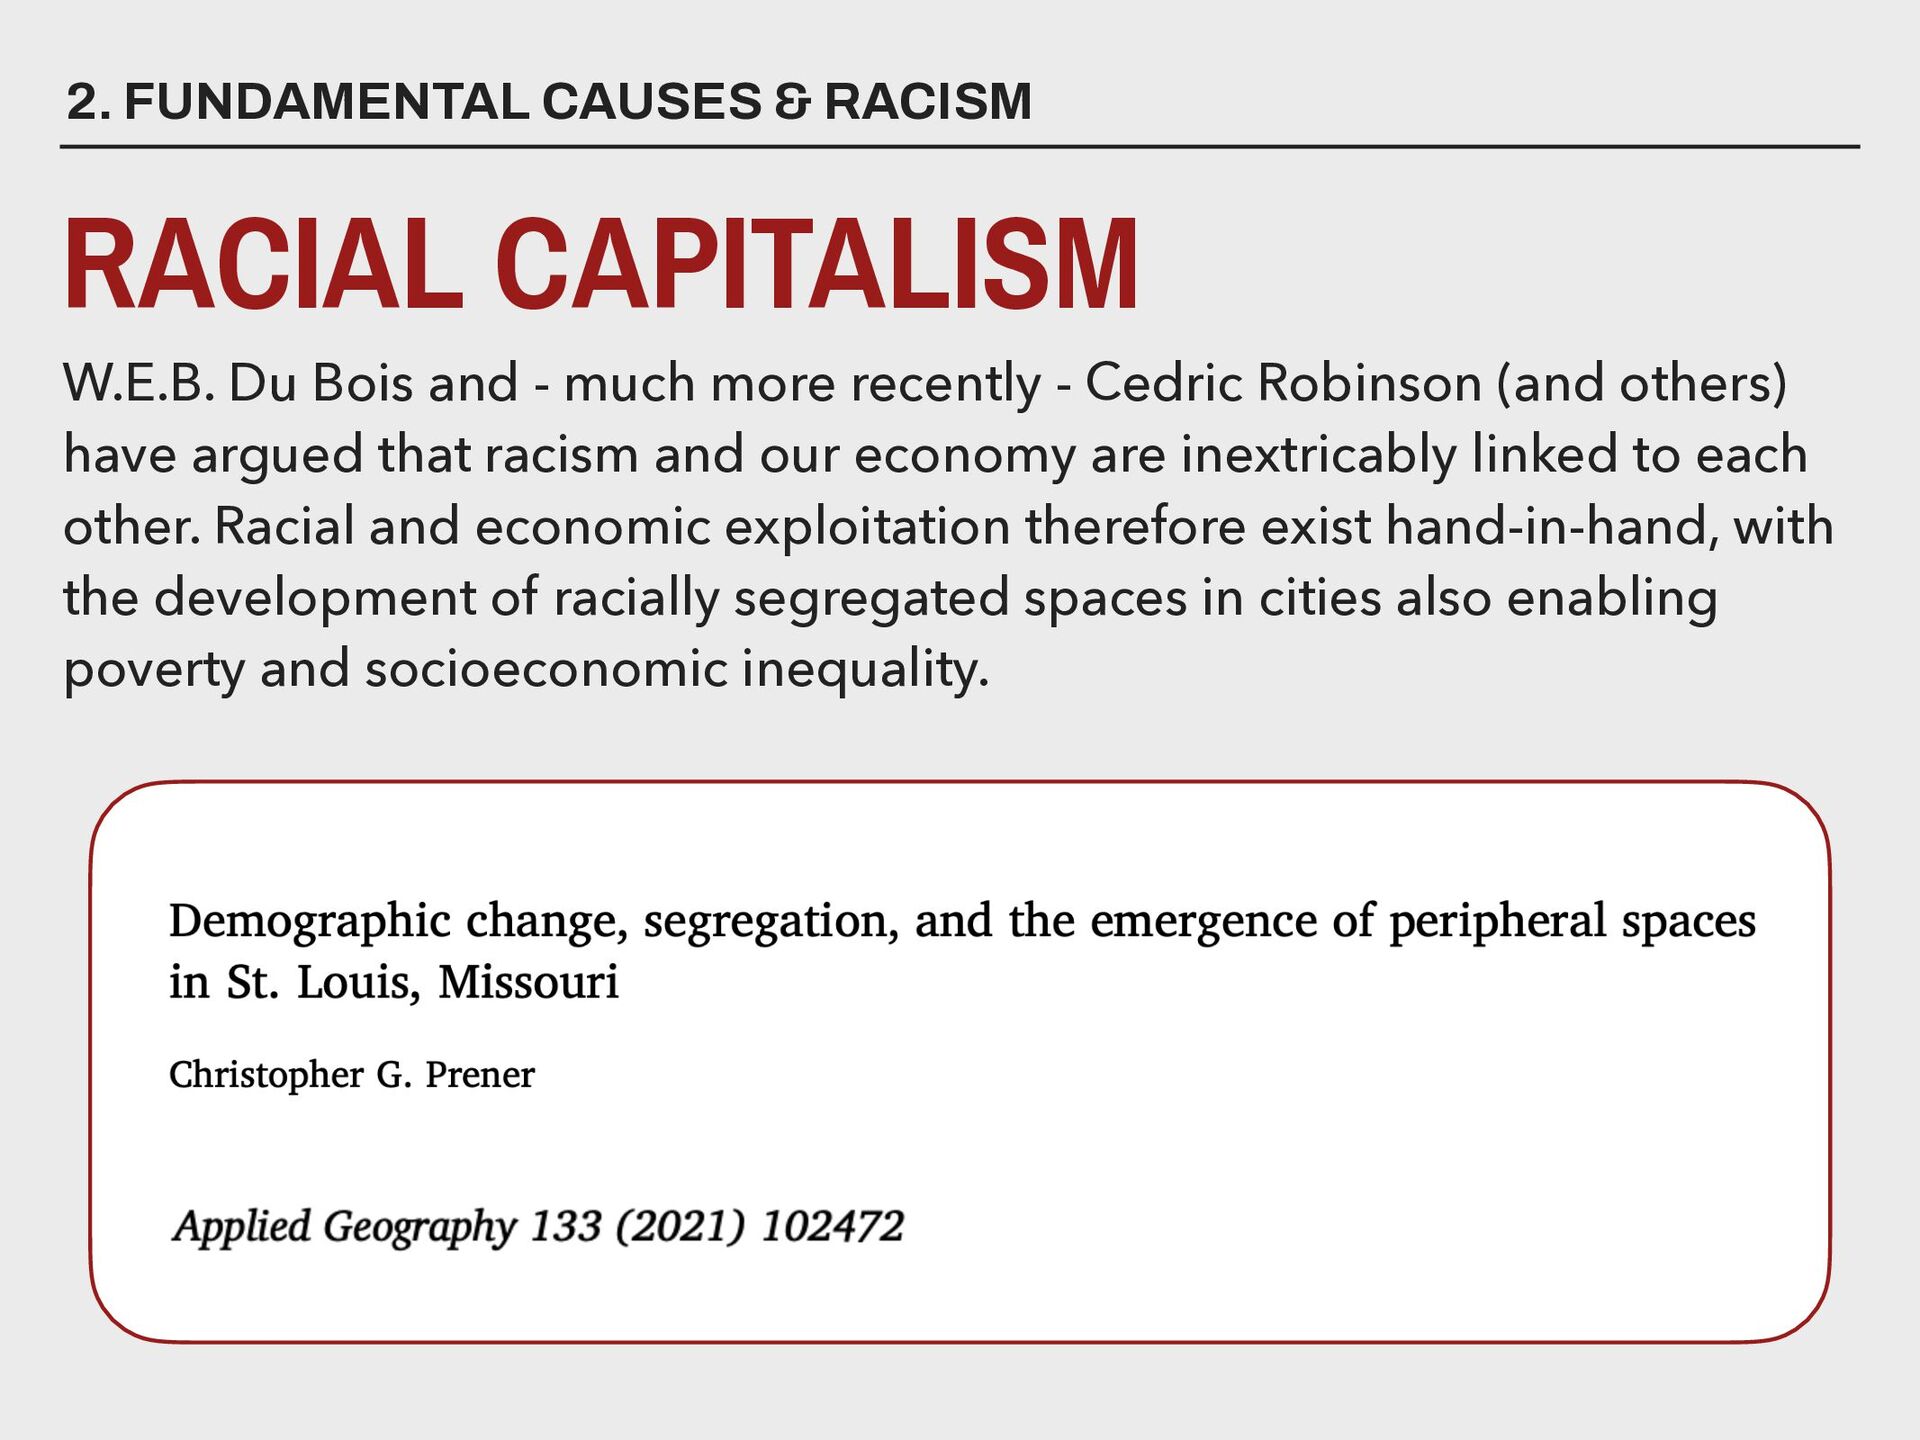
and - much more recently - Cedric Robinson (and others) have argued that racism and our economy are inextricably linked to each other. Racial and economic exploitation therefore exist hand-in-hand, with the development of racially segregated spaces in cities also enabling poverty and socioeconomic inequality.
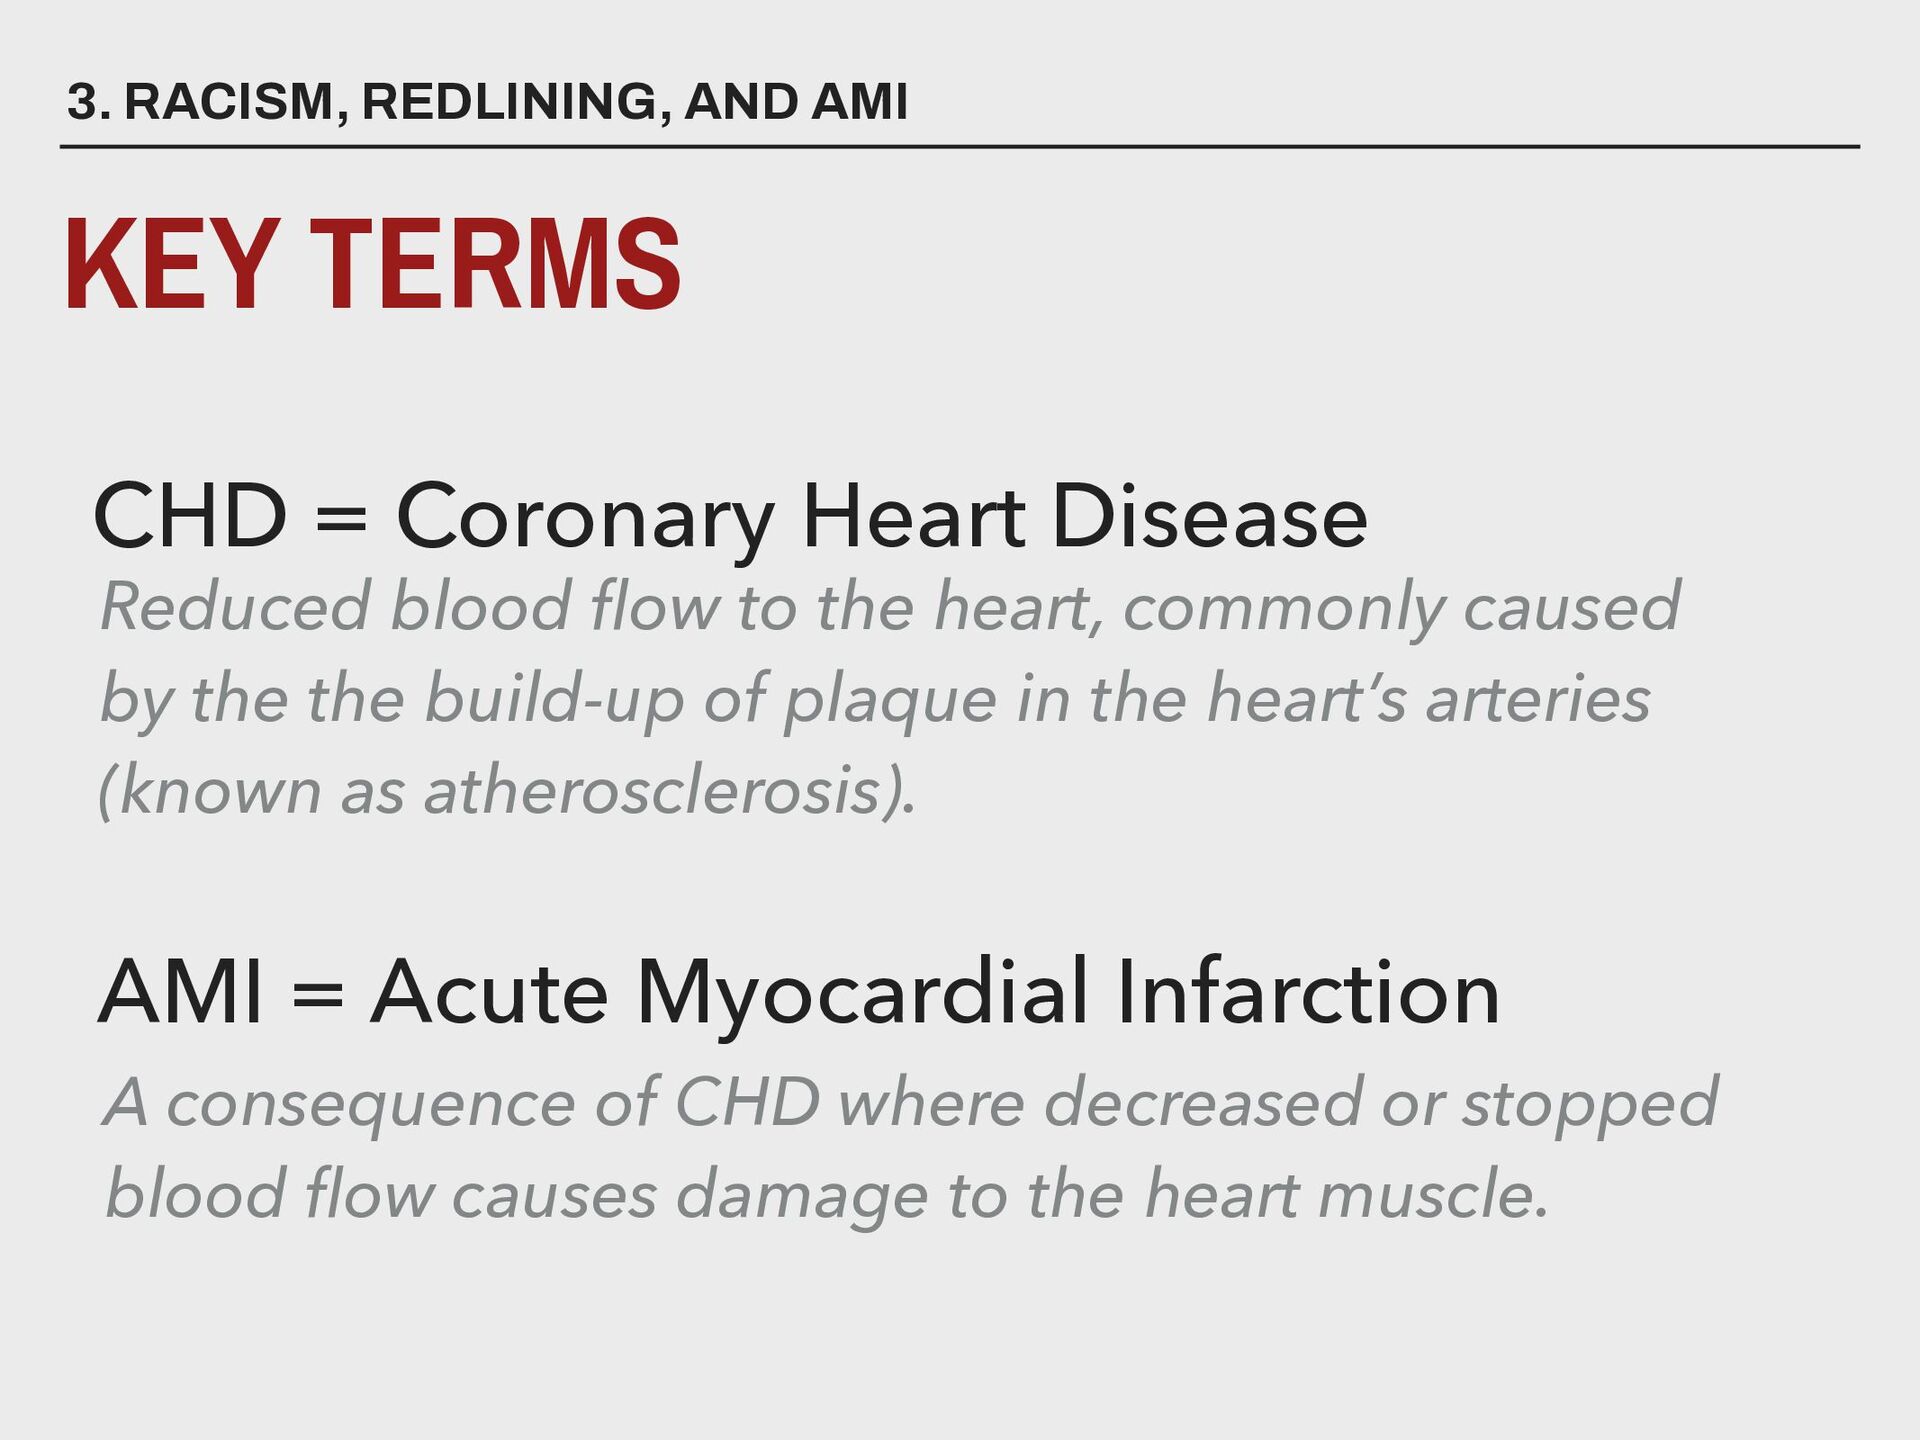
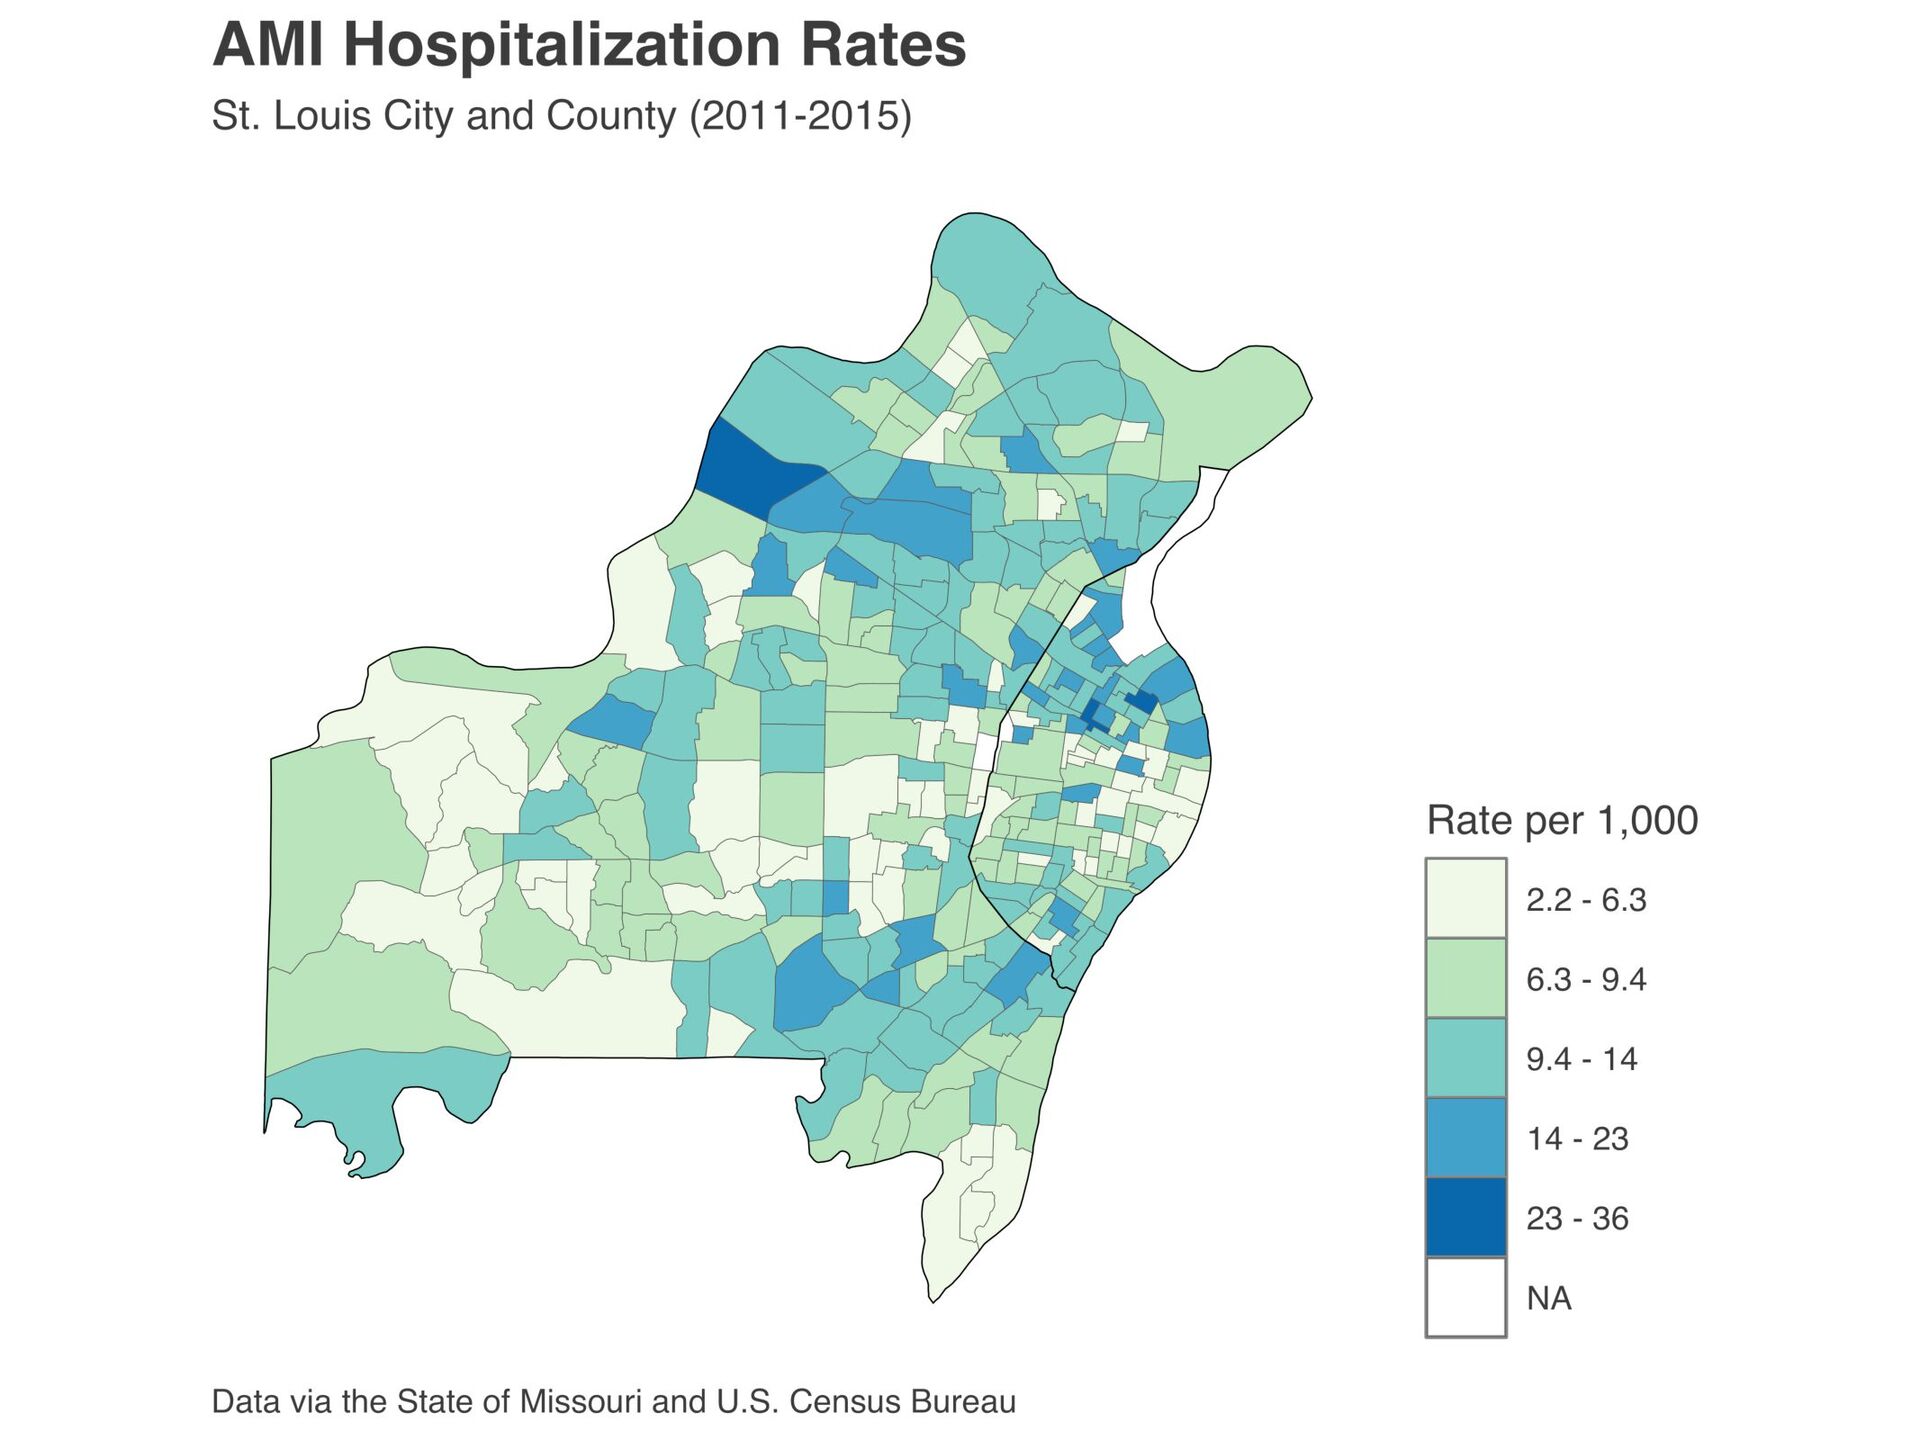
Heart Disease Reduced blood flow to the heart, commonly caused by the the build-up of plaque in the heart’s arteries (known as atherosclerosis). AMI = Acute Myocardial Infarction A consequence of CHD where decreased or stopped blood flow causes damage to the heart muscle.
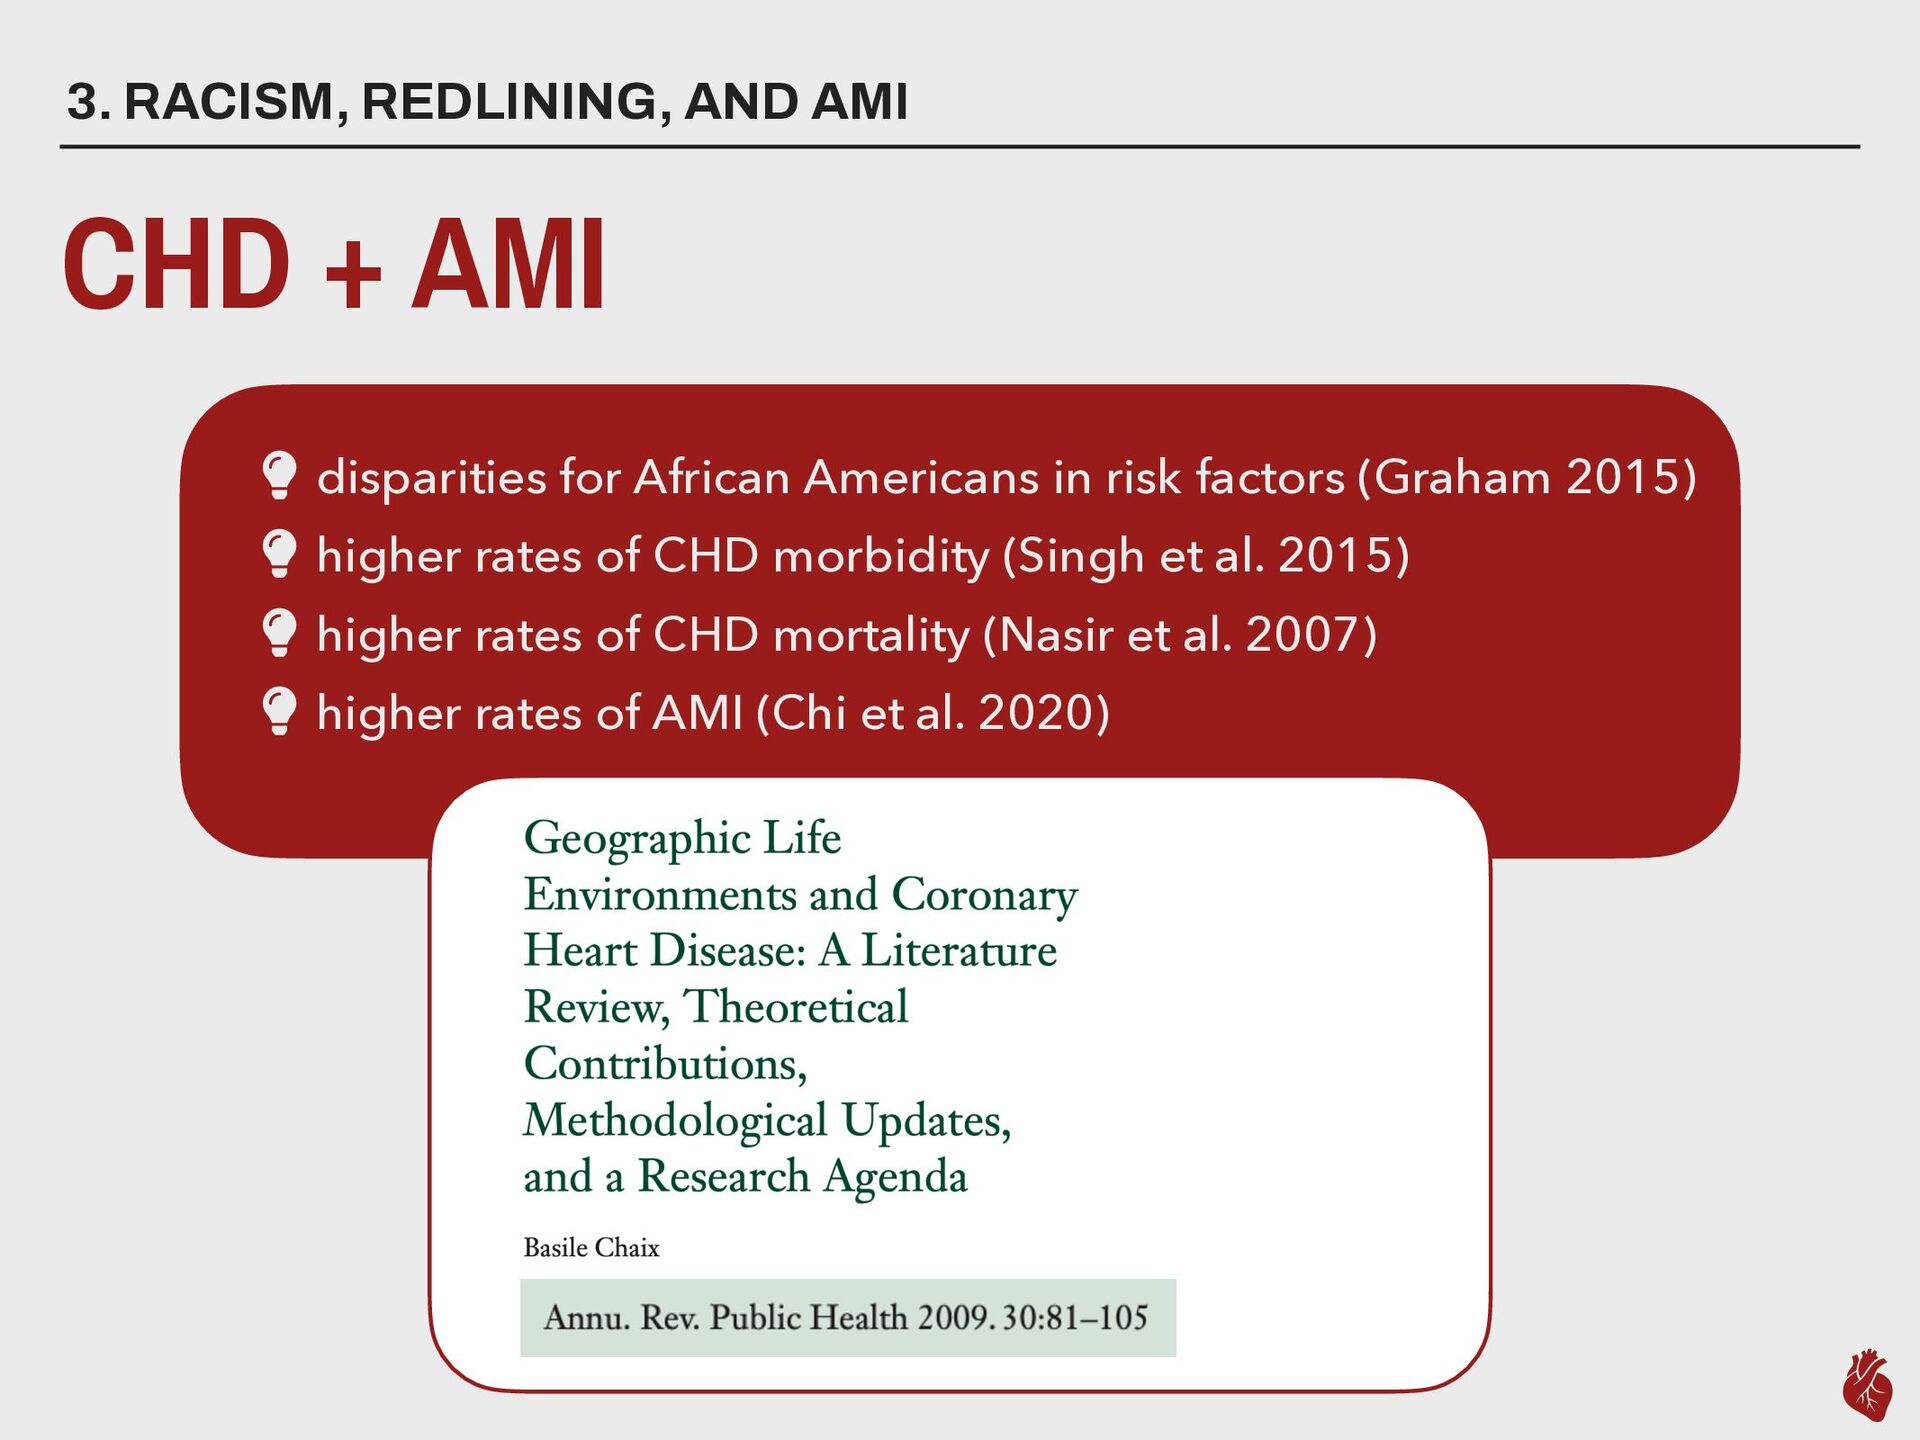
African Americans in risk factors (Graham 2015) higher rates of CHD morbidity (Singh et al. 2015) higher rates of CHD mortality (Nasir et al. 2007) higher rates of AMI (Chi et al. 2020)
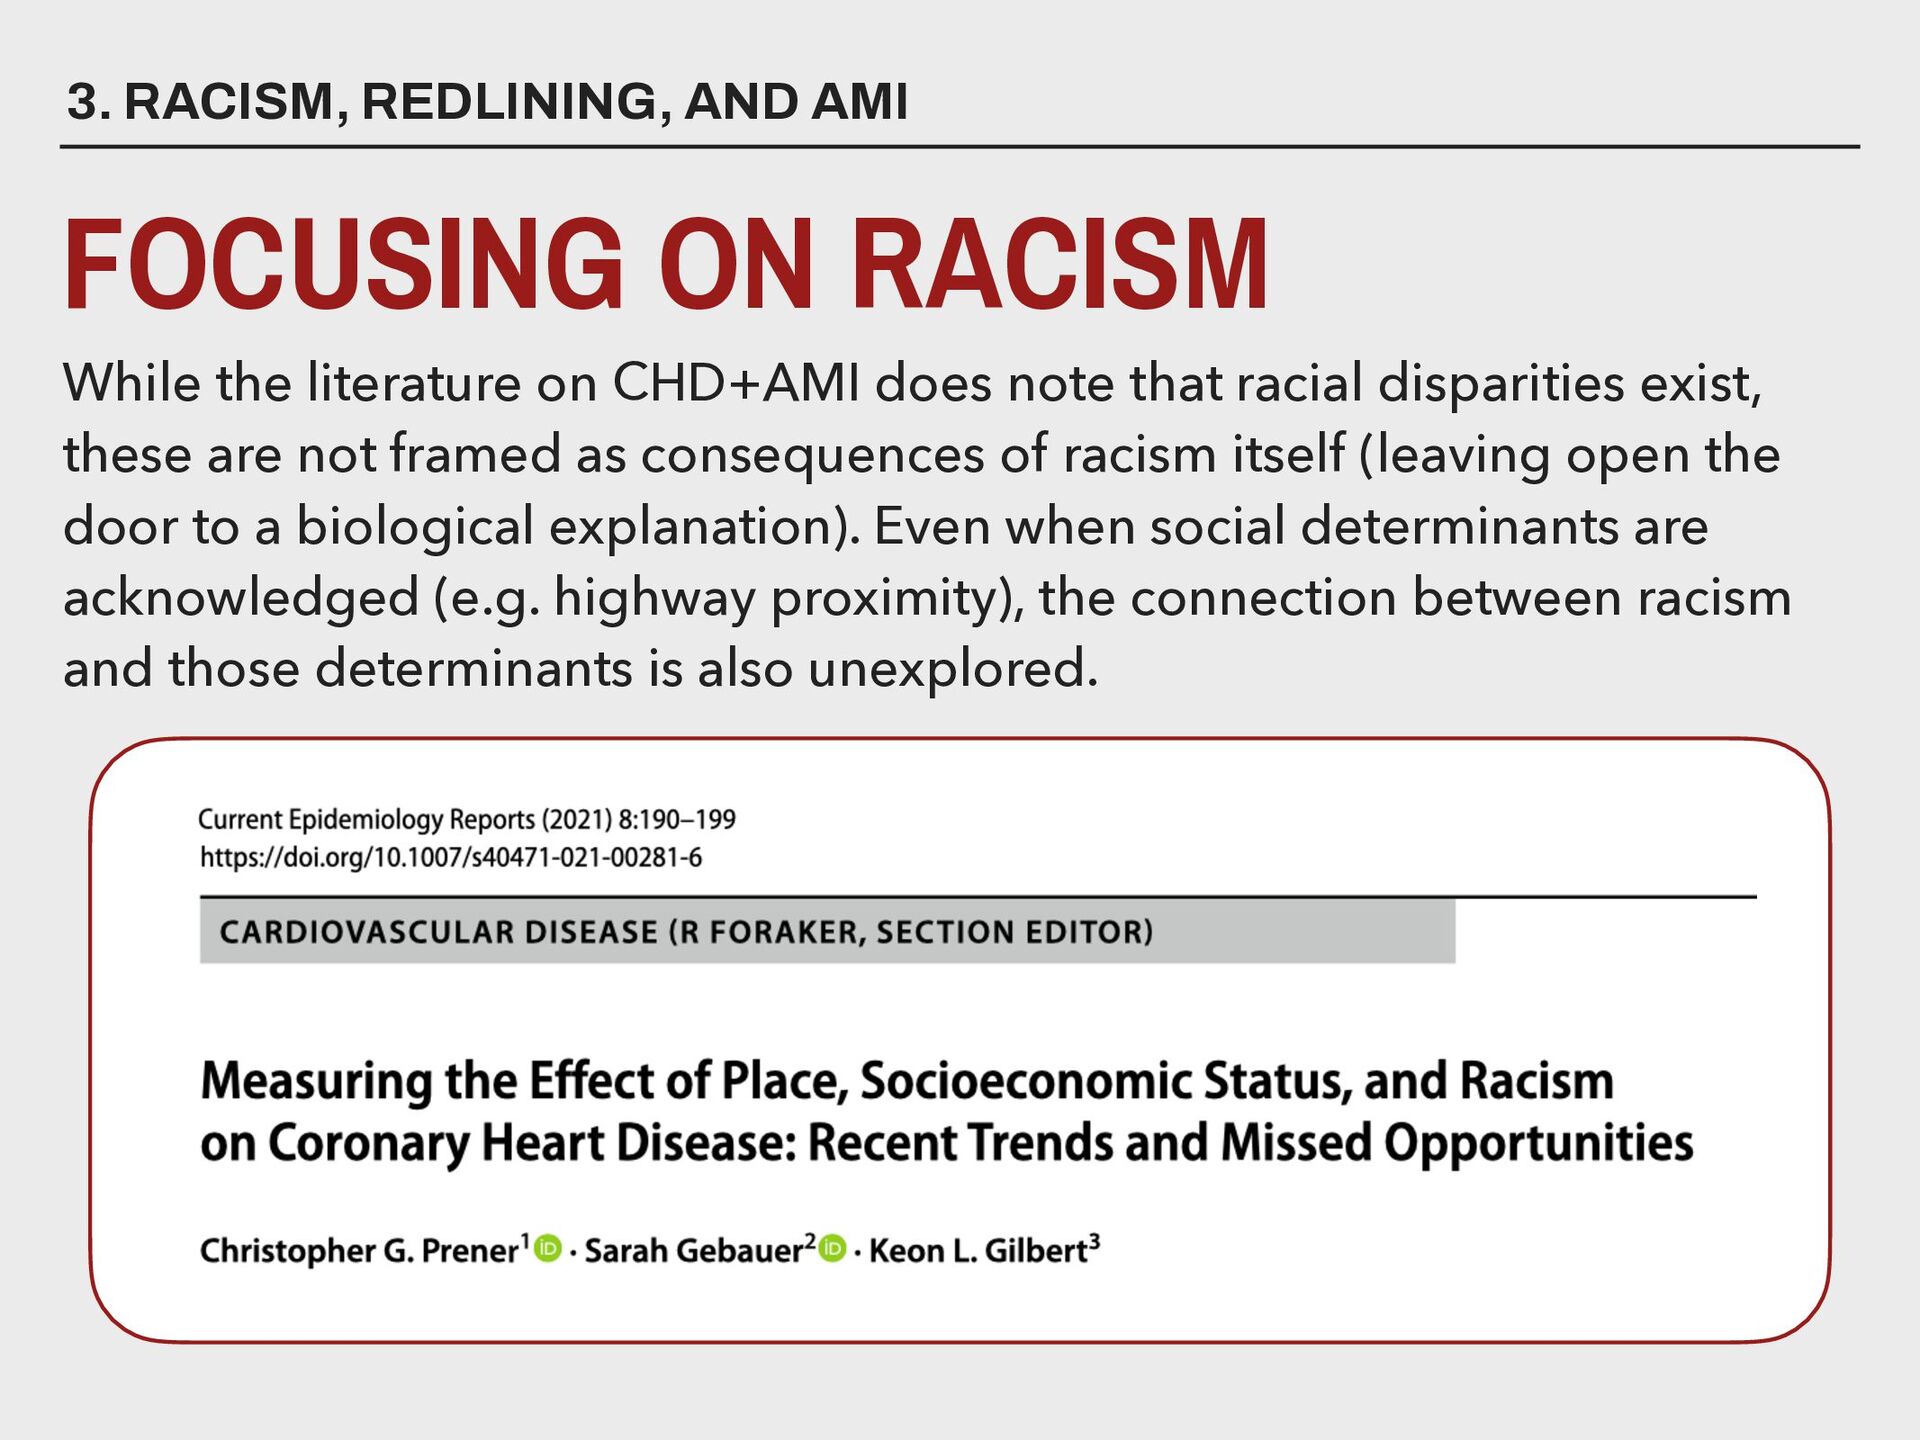
literature on CHD+AMI does note that racial disparities exist, these are not framed as consequences of racism itself (leaving open the door to a biological explanation). Even when social determinants are acknowledged (e.g. highway proximity), the connection between racism and those determinants is also unexplored.
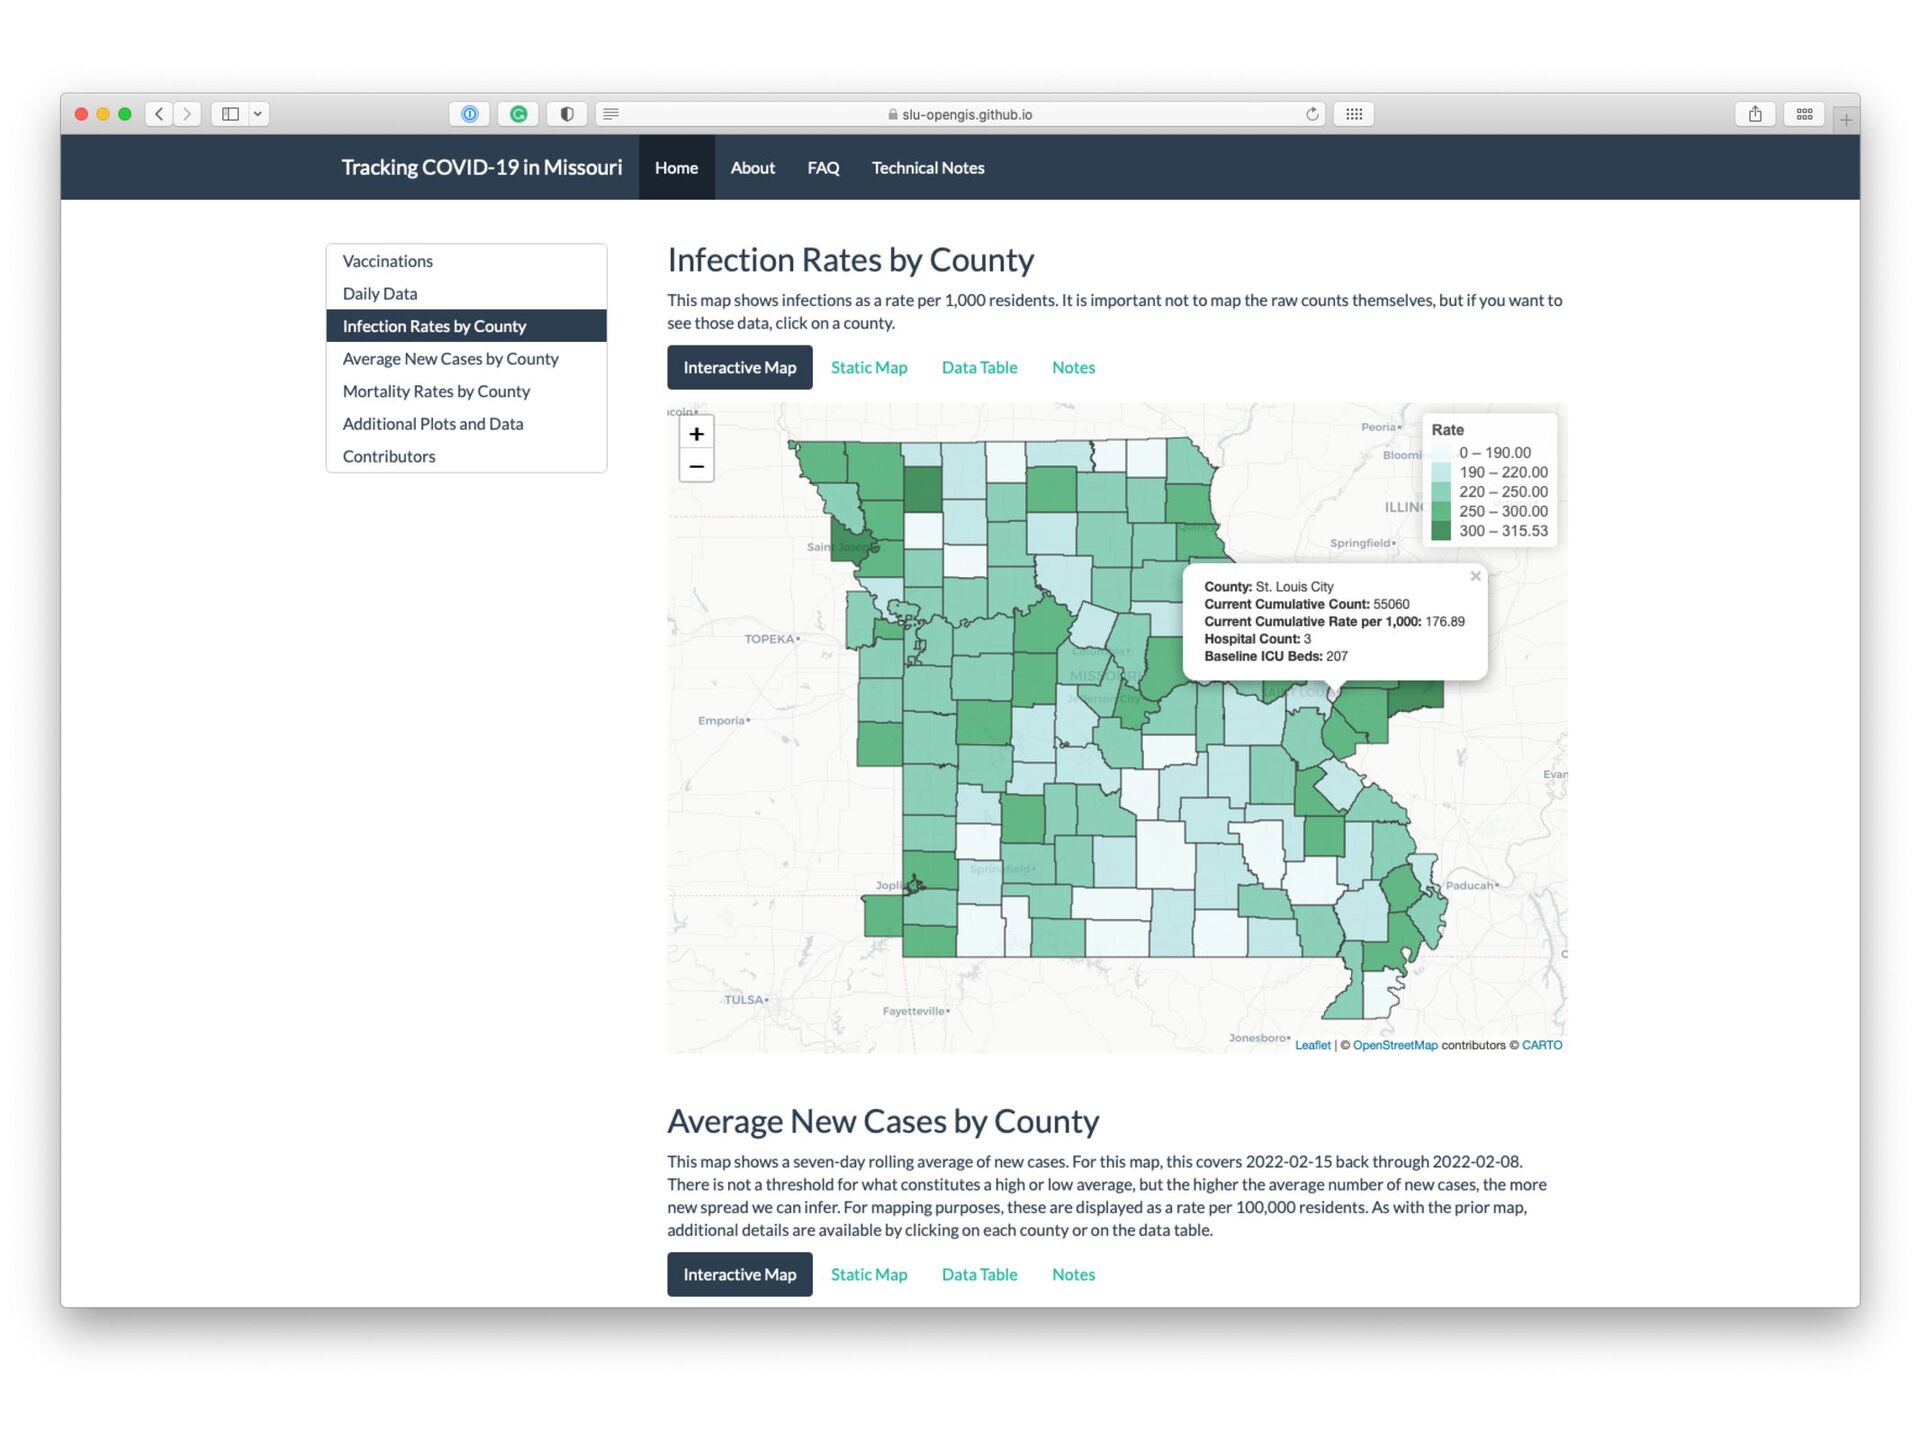
York Times COVID-19 Database (via GitHub) County Public Health Zip Code Data (via scrapers+API calls) Missouri COVID Tracking Data Sets State of Missouri and Illinois (via scrapers) CMS Nursing Home Data & HHS Hospitalization Data (via API) Census Bureau (via API)
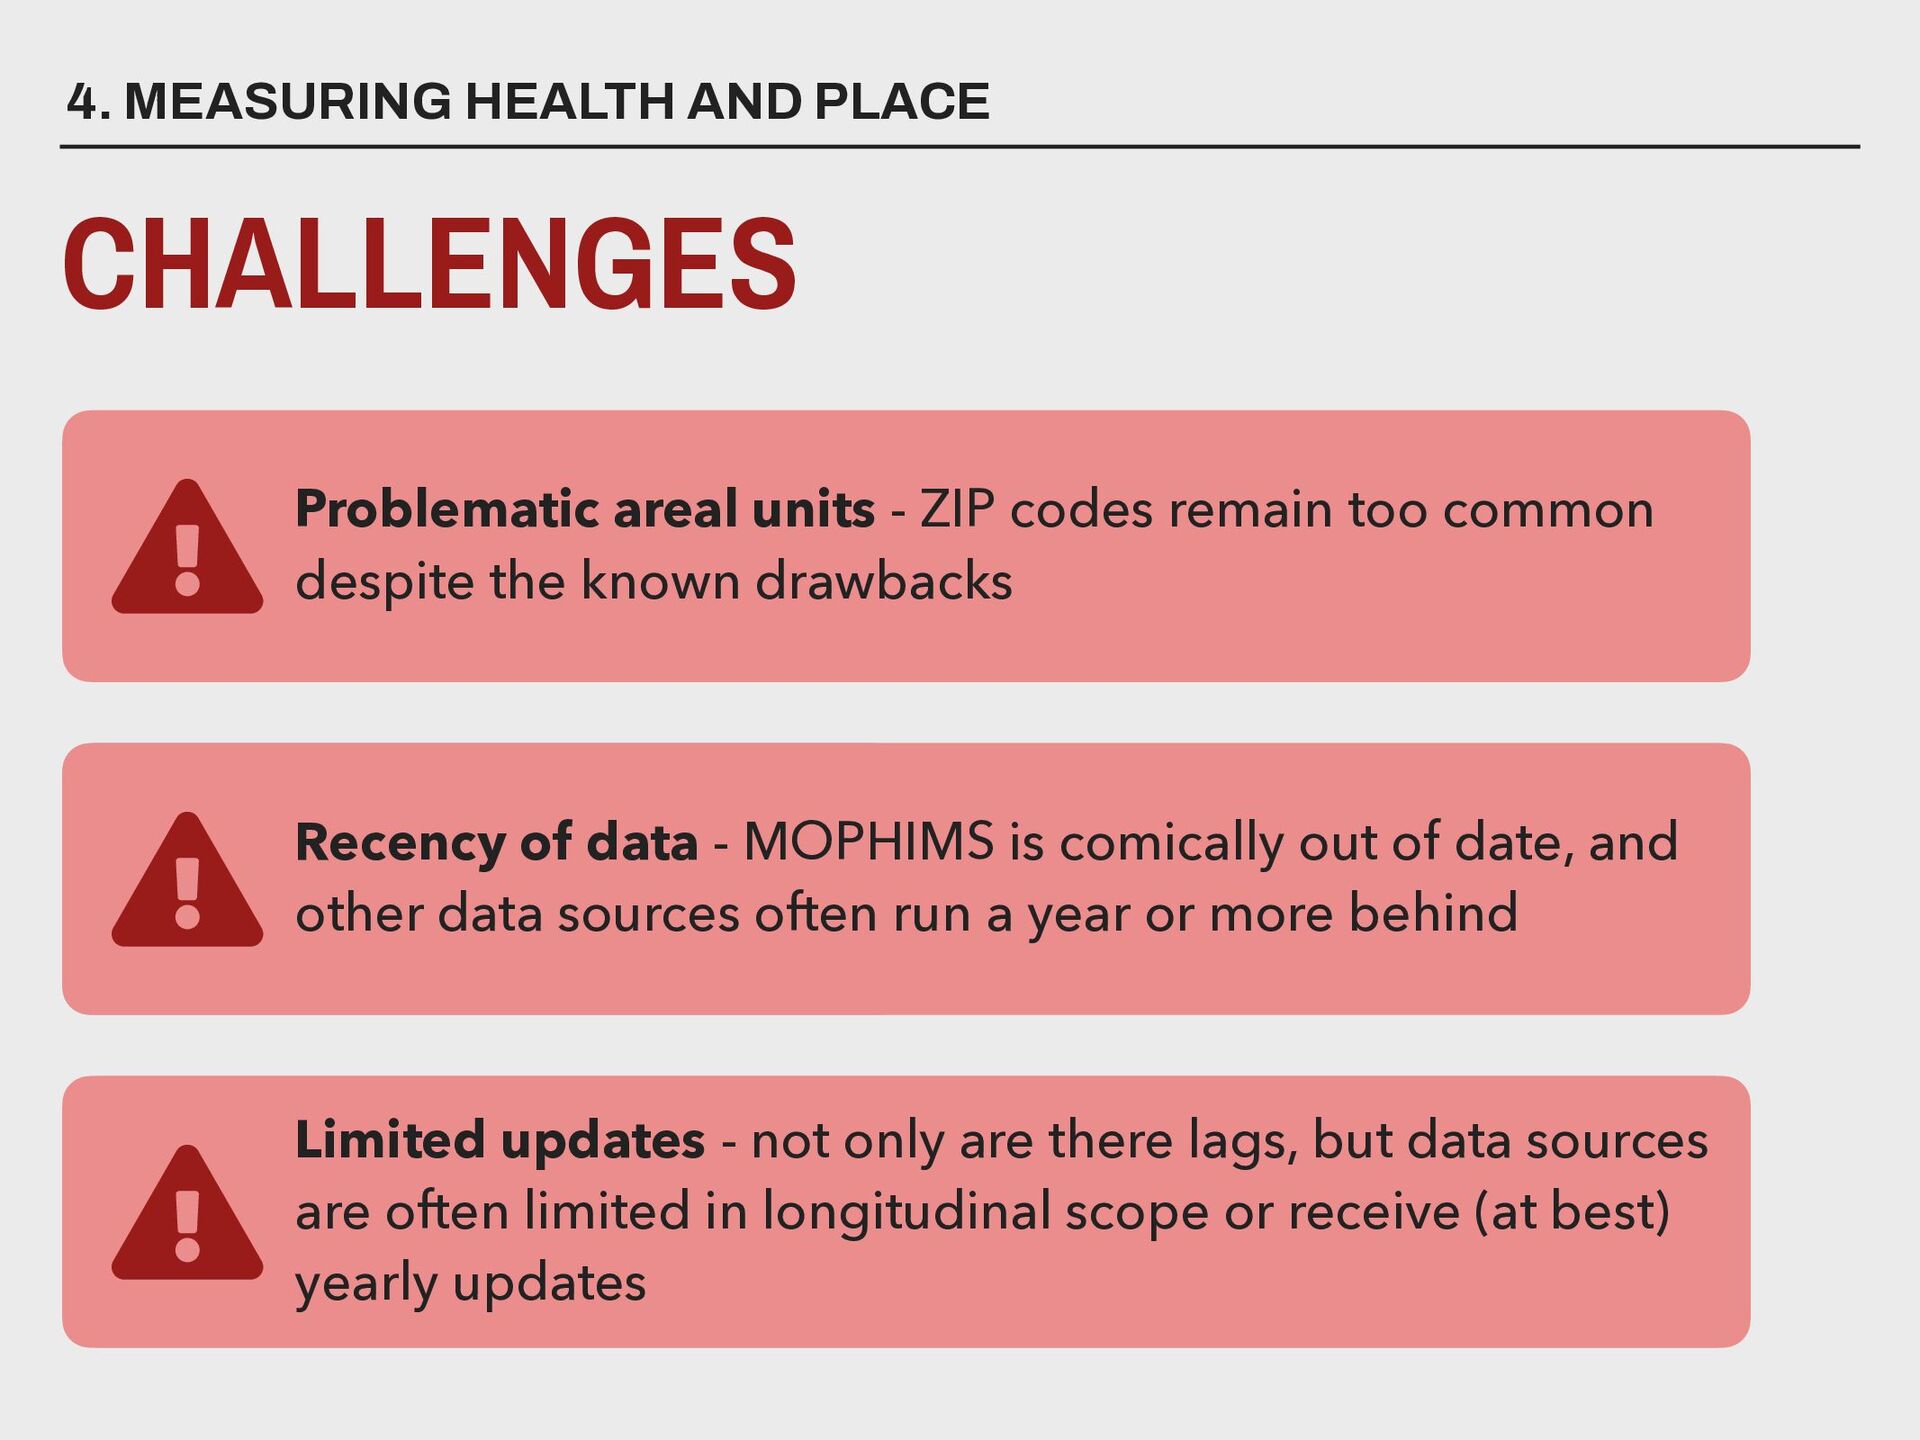
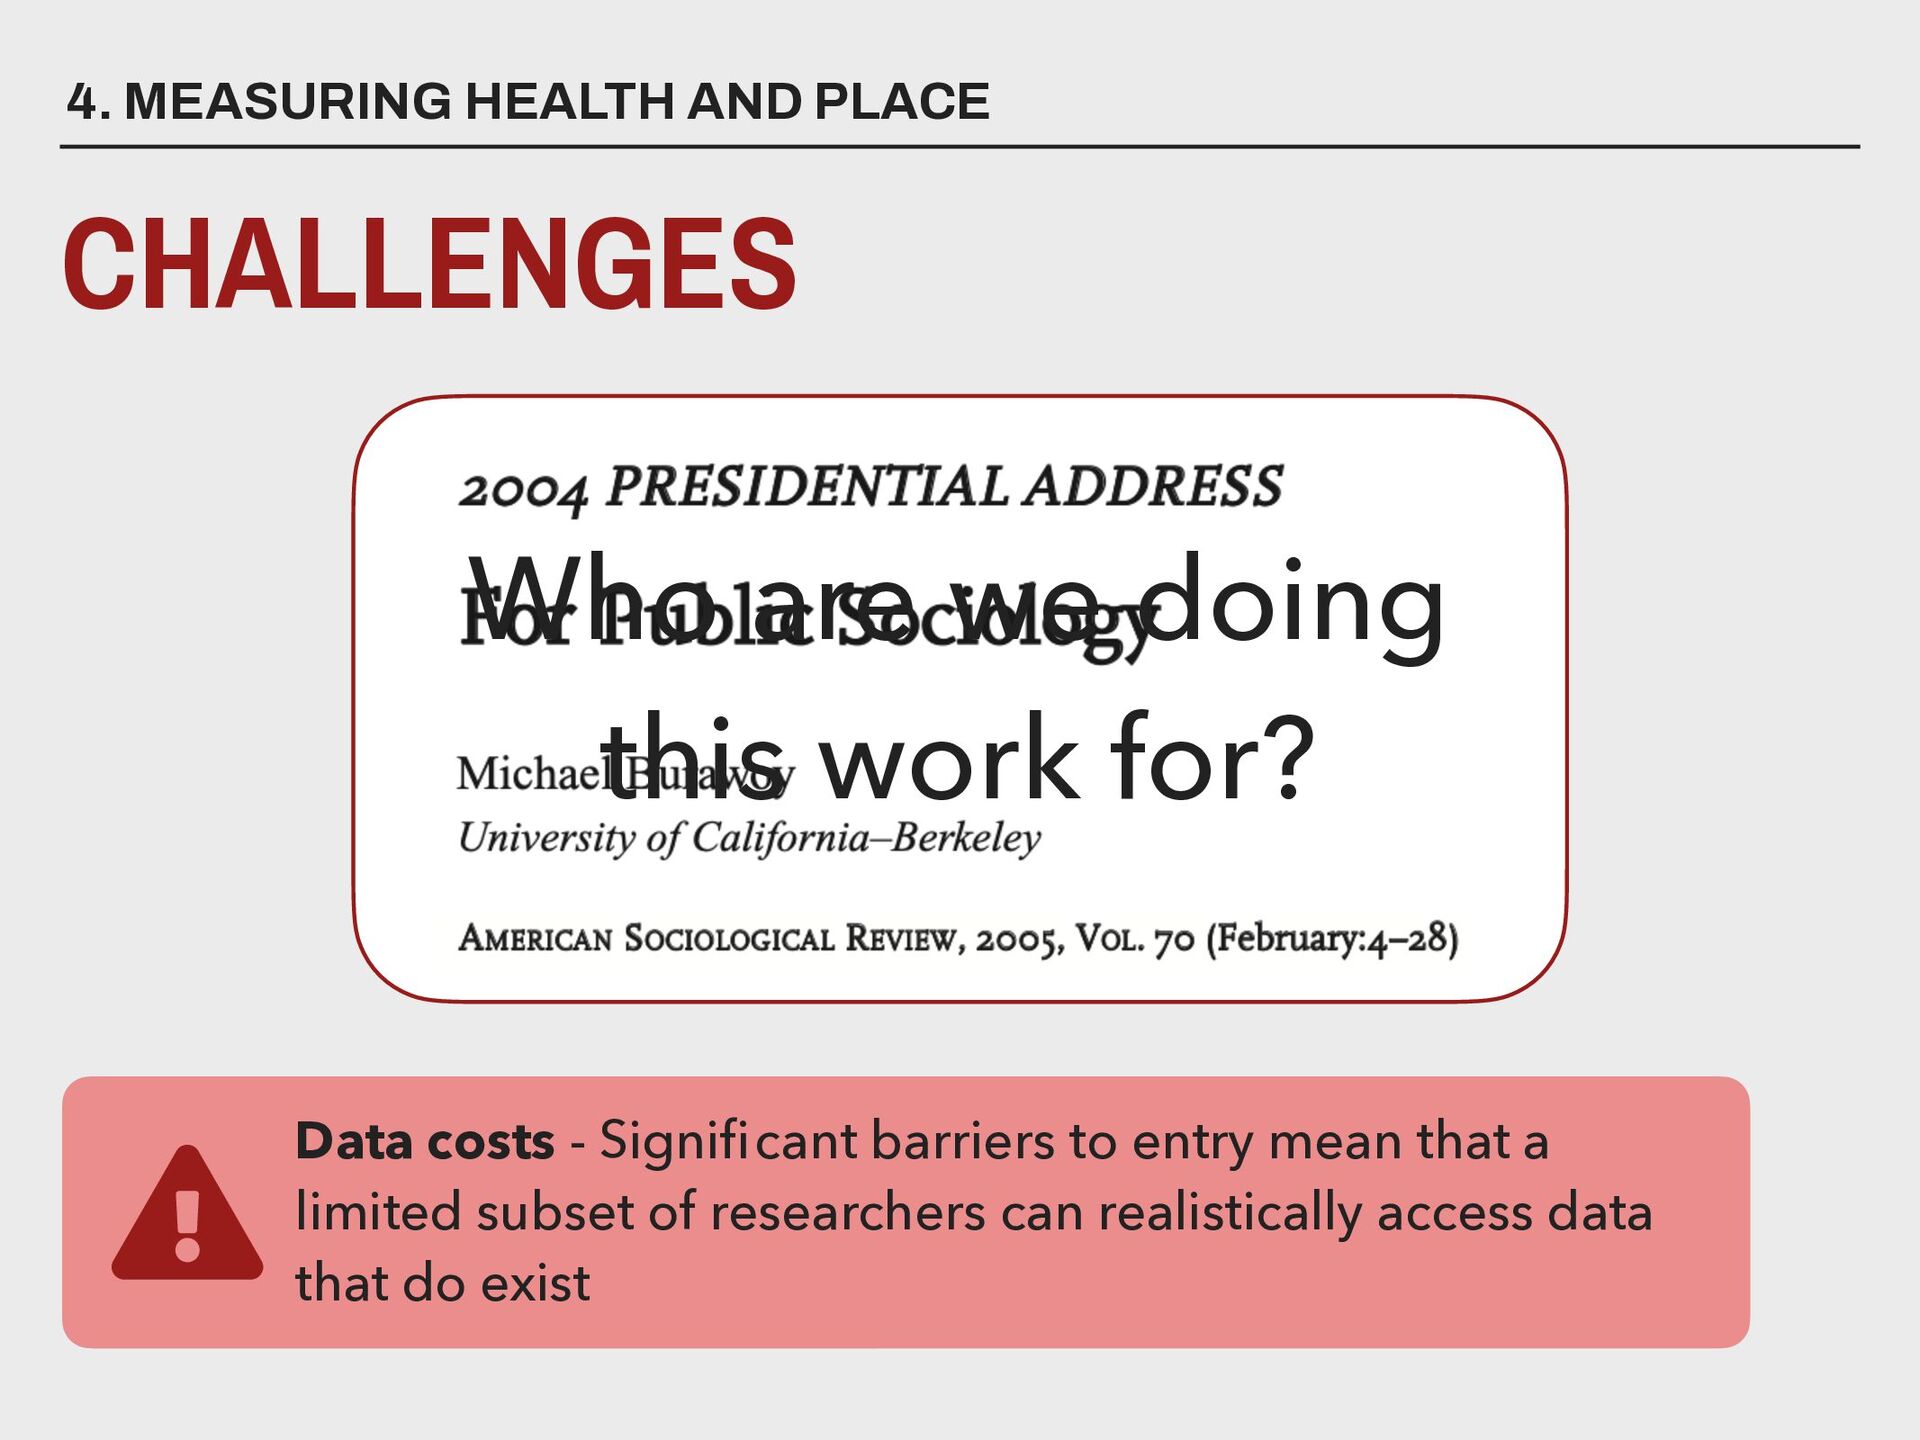
sources are often limited in longitudinal scope or receive (at best) yearly updates Problematic areal units - ZIP codes remain too common despite the known drawbacks Announcement Text CHALLENGES 4. MEASURING HEALTH AND PLACE Recency of data - MOPHIMS is comically out of date, and other data sources often run a year or more behind
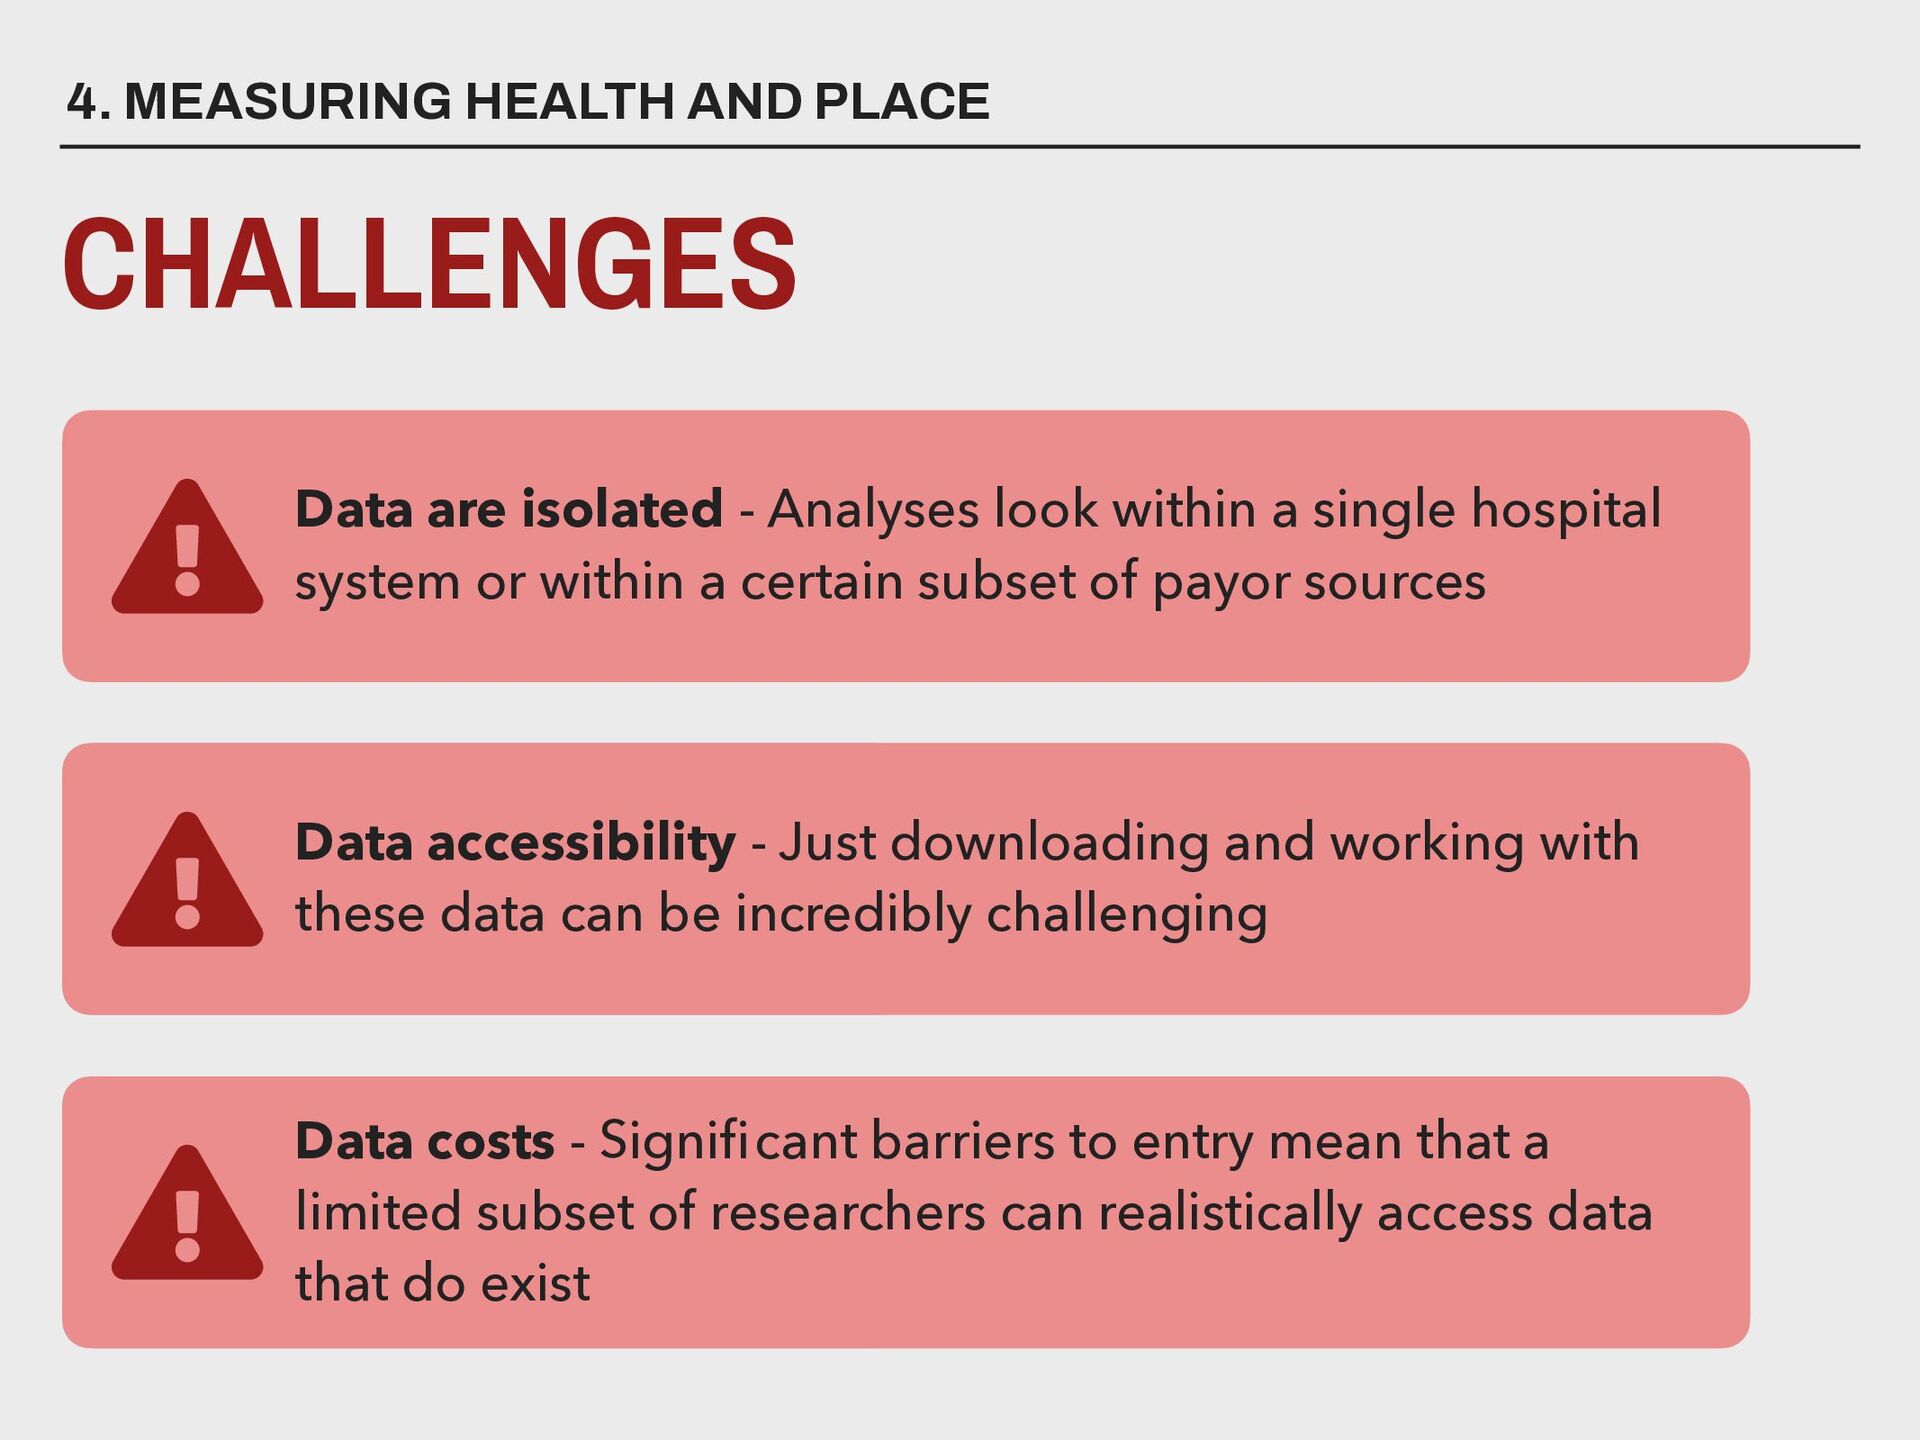
system or within a certain subset of payor sources CHALLENGES 4. MEASURING HEALTH AND PLACE Announcement Text Data accessibility - Just downloading and working with these data can be incredibly challenging Announcement Text Data costs - Significant barriers to entry mean that a limited subset of researchers can realistically access data that do exist
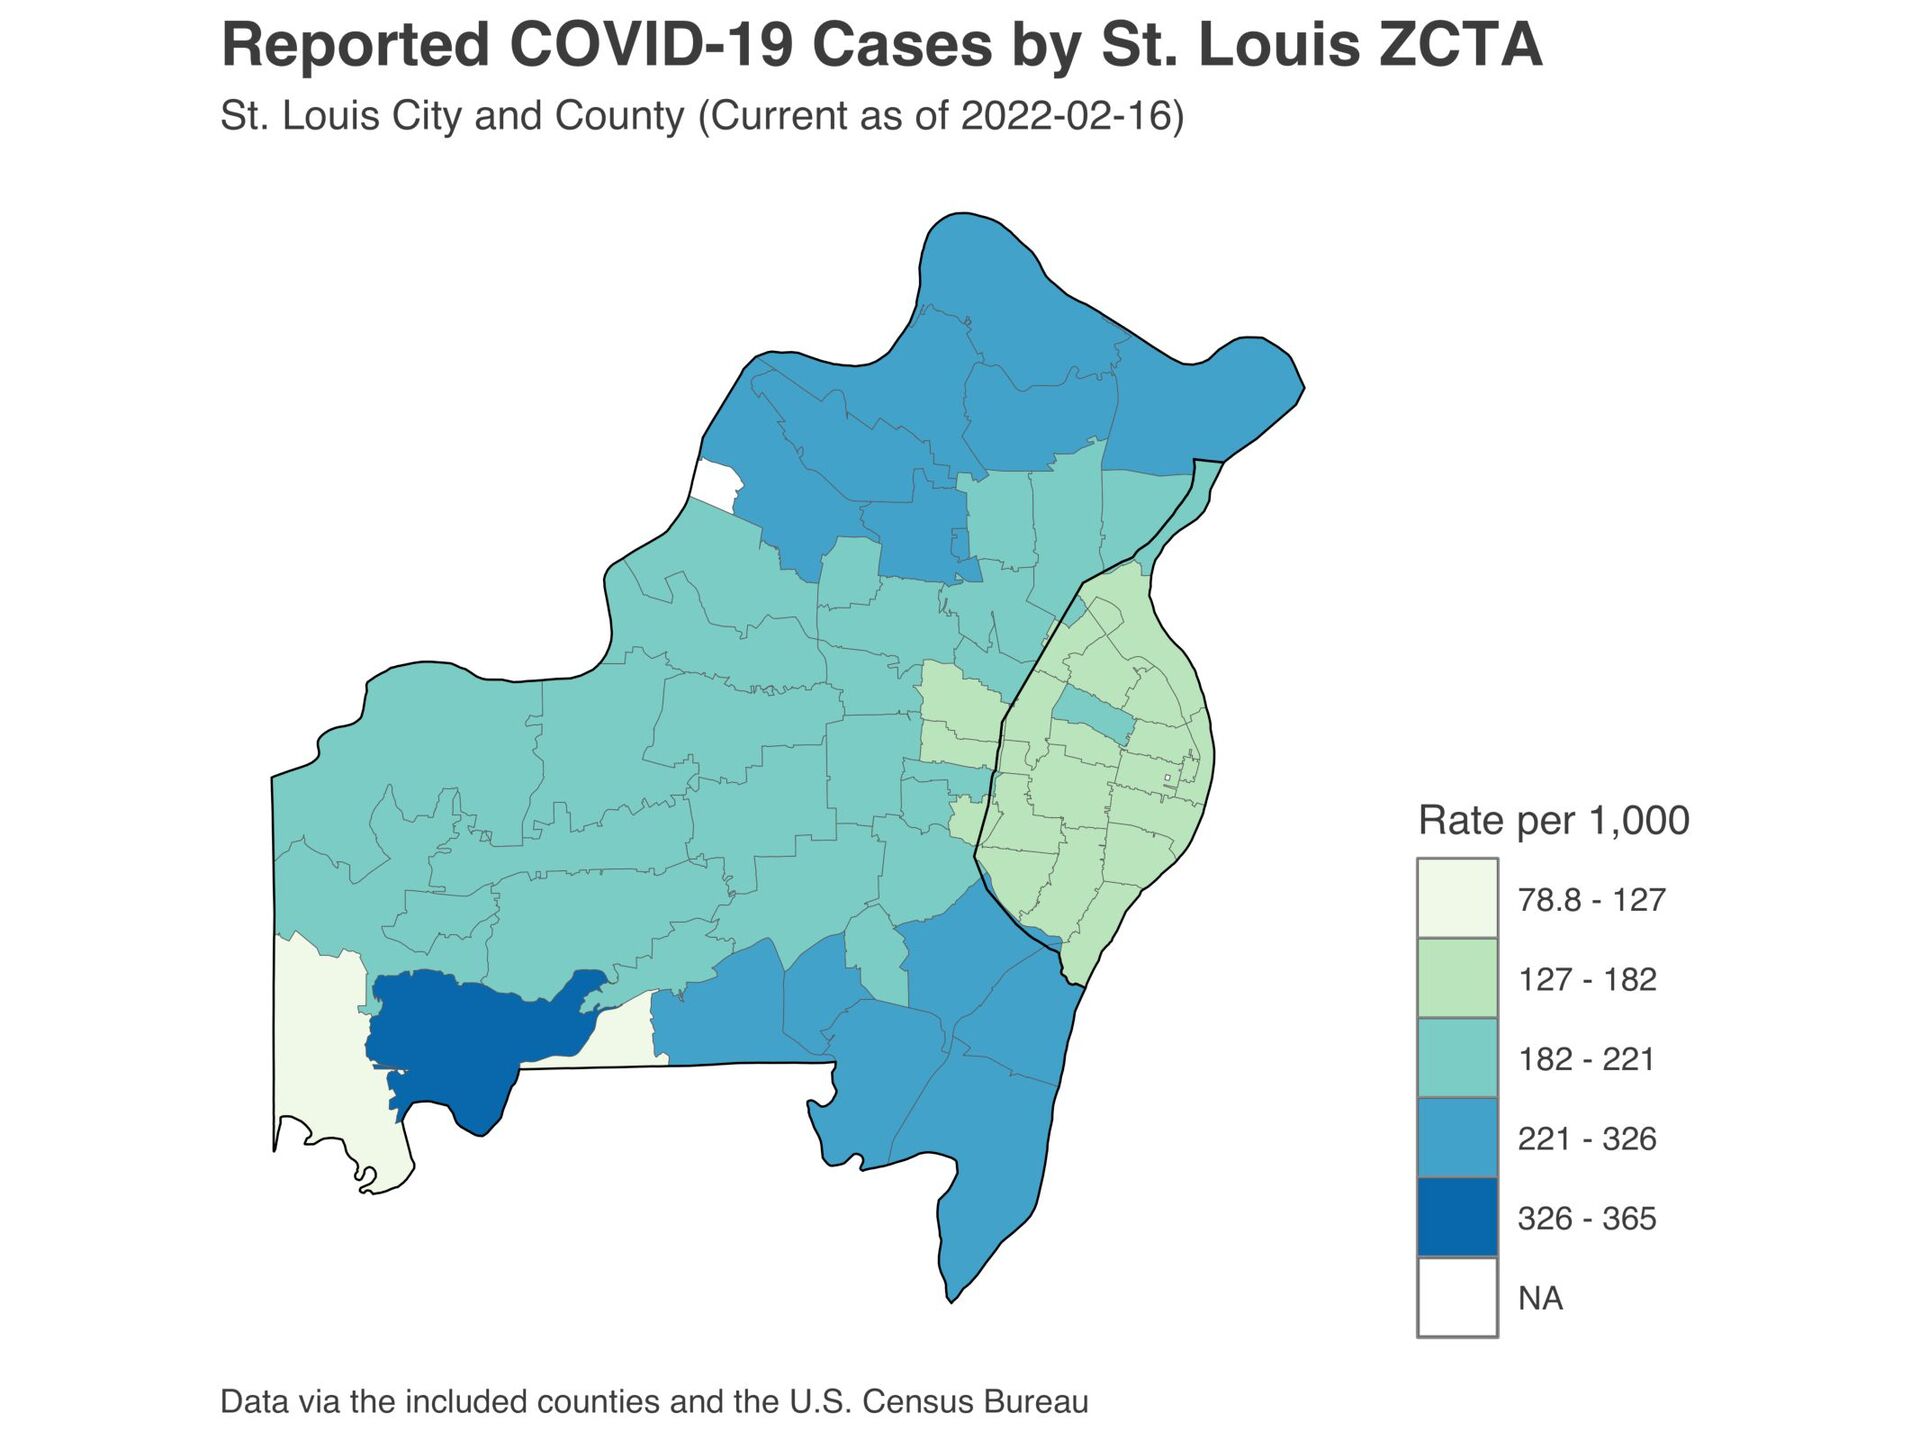
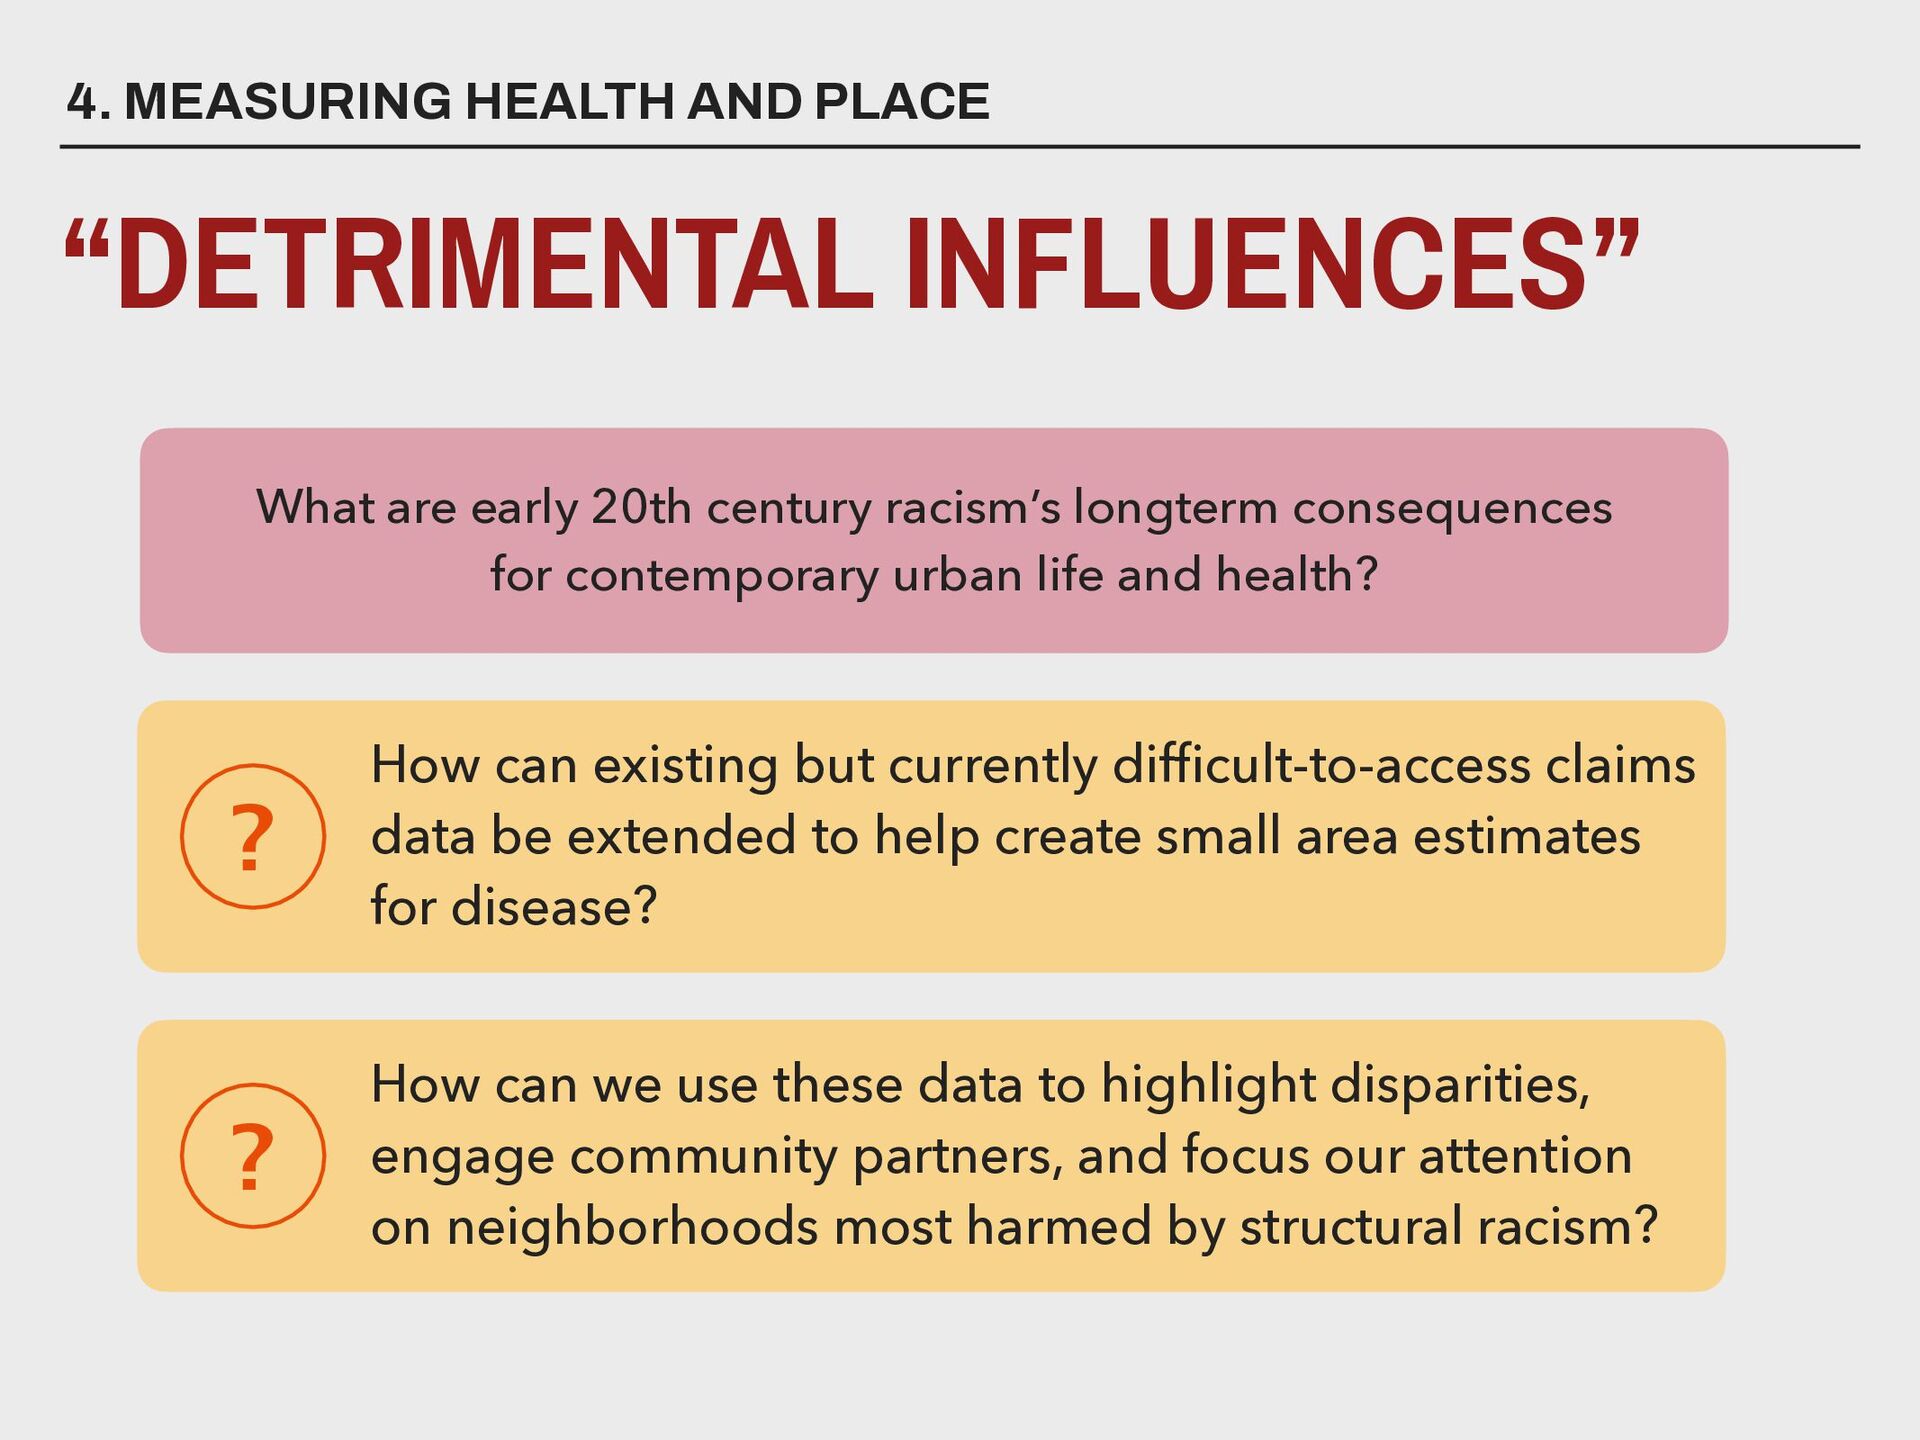
but currently difficult-to-access claims data be extended to help create small area estimates for disease? ? How can we use these data to highlight disparities, engage community partners, and focus our attention on neighborhoods most harmed by structural racism? ? What are early 20th century racism’s longterm consequences for contemporary urban life and health?
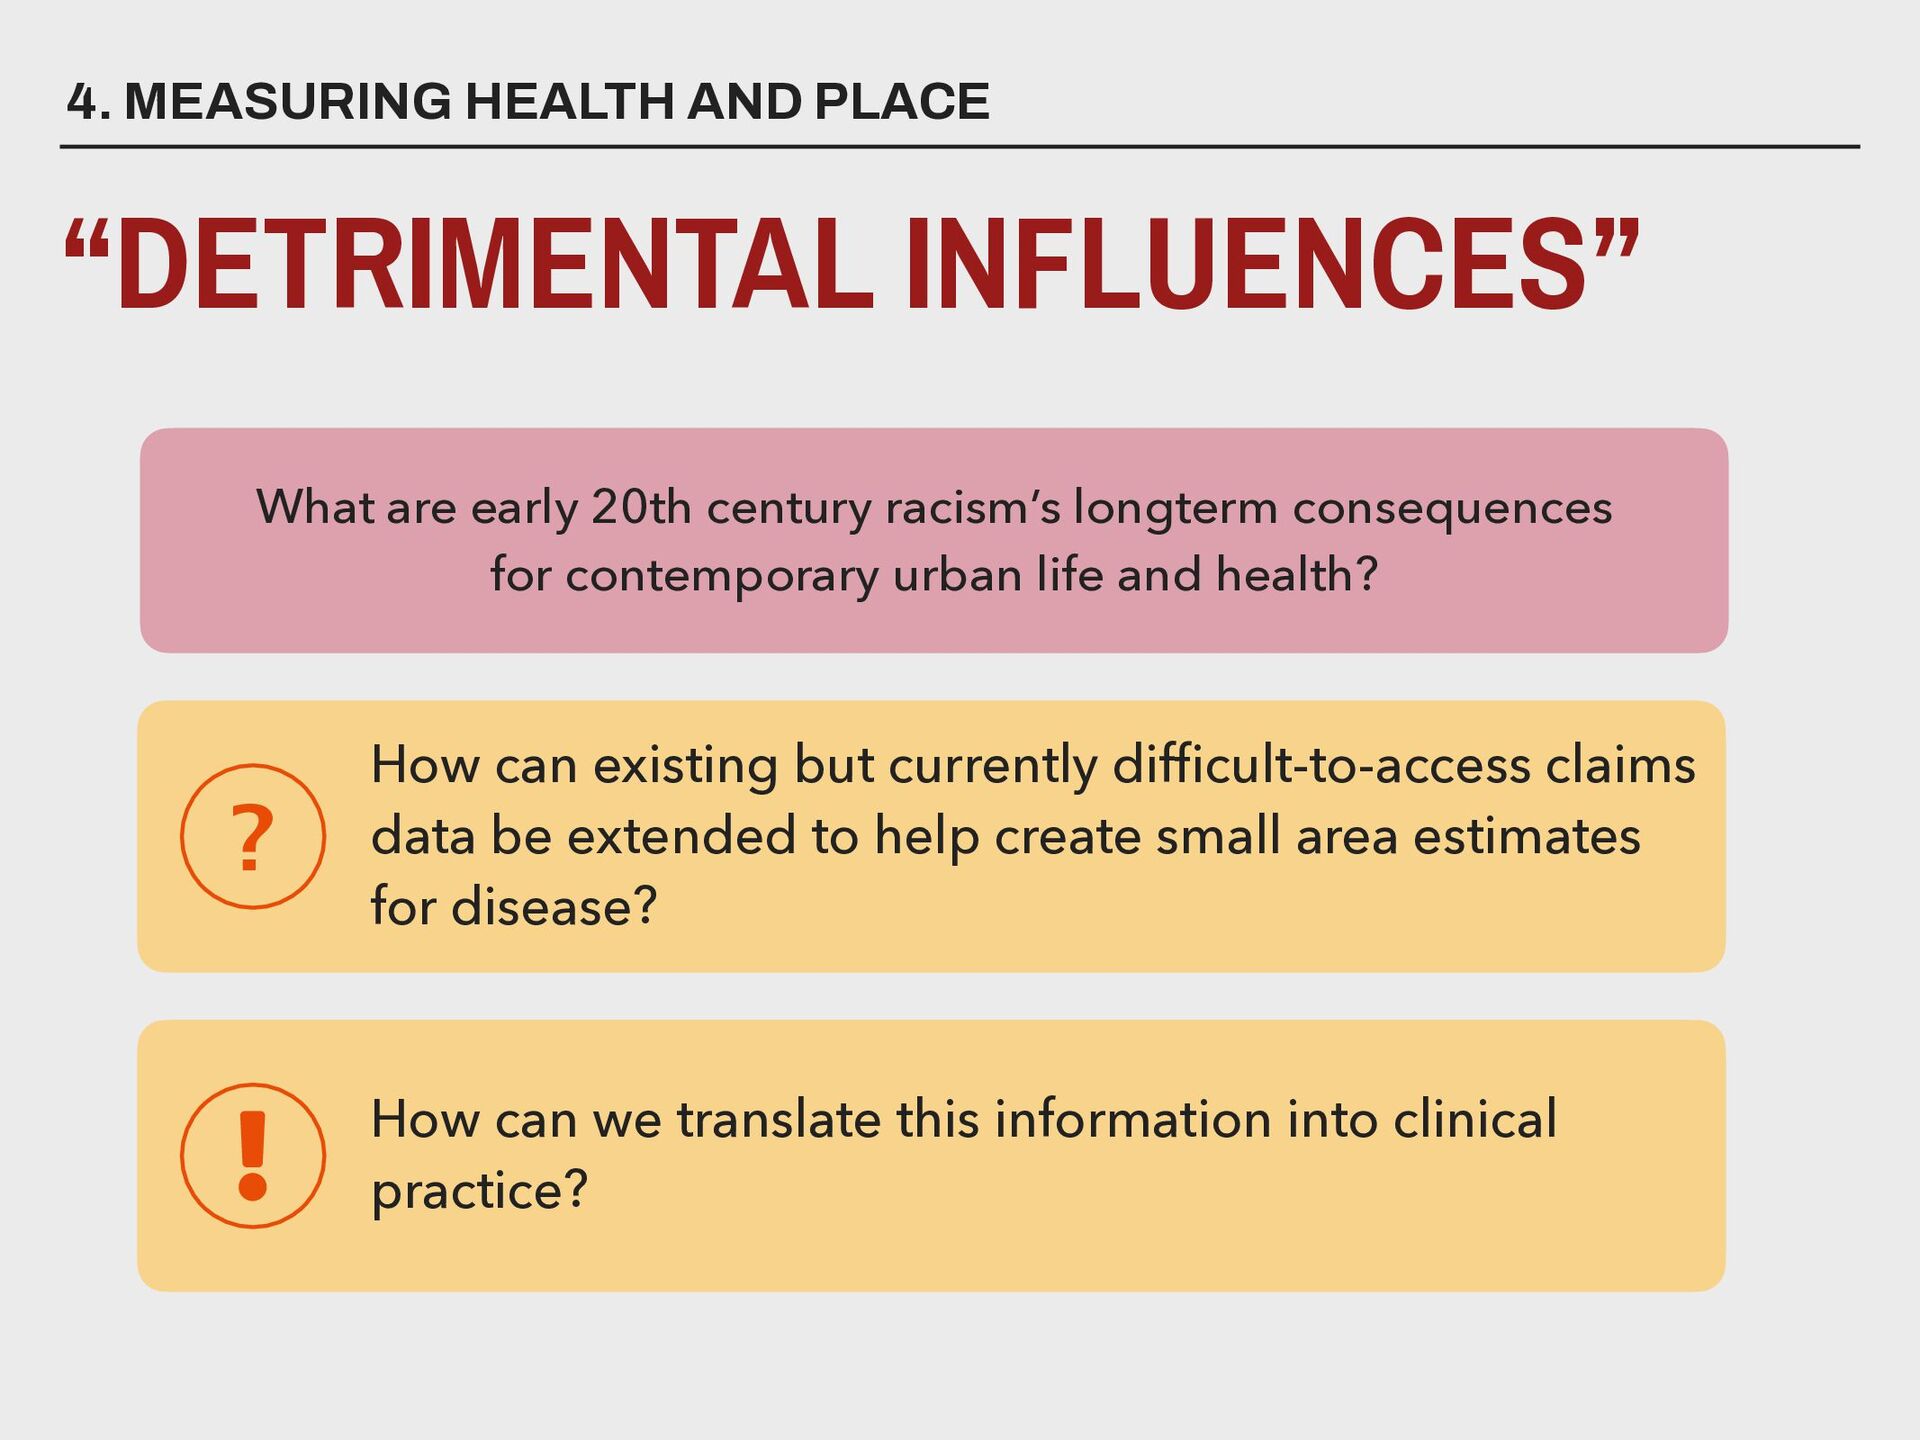
but currently difficult-to-access claims data be extended to help create small area estimates for disease? ? How can we translate this information into clinical practice? What are early 20th century racism’s longterm consequences for contemporary urban life and health?
![Slides available via SpeakerDeck https://speakerdeck.com/chrisprener/washu-lec [email protected] chris-prener.github.io LEARN MORE THANKS](https://files.speakerdeck.com/presentations/7433f937f4bb40b7880c10481efe7a57/slide_59.jpg)