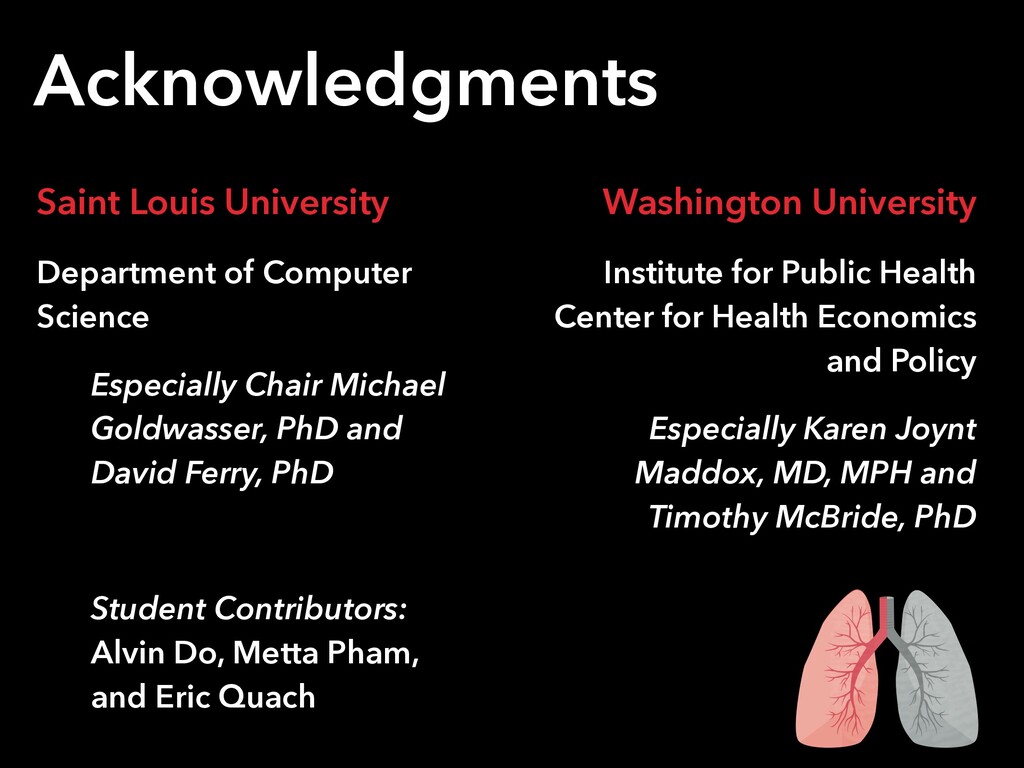
Michael Goldwasser, PhD and David Ferry, PhD Student Contributors: Alvin Do, Metta Pham, and Eric Quach Washington University Institute for Public Health Center for Health Economics and Policy Especially Karen Joynt Maddox, MD, MPH and Timothy McBride, PhD
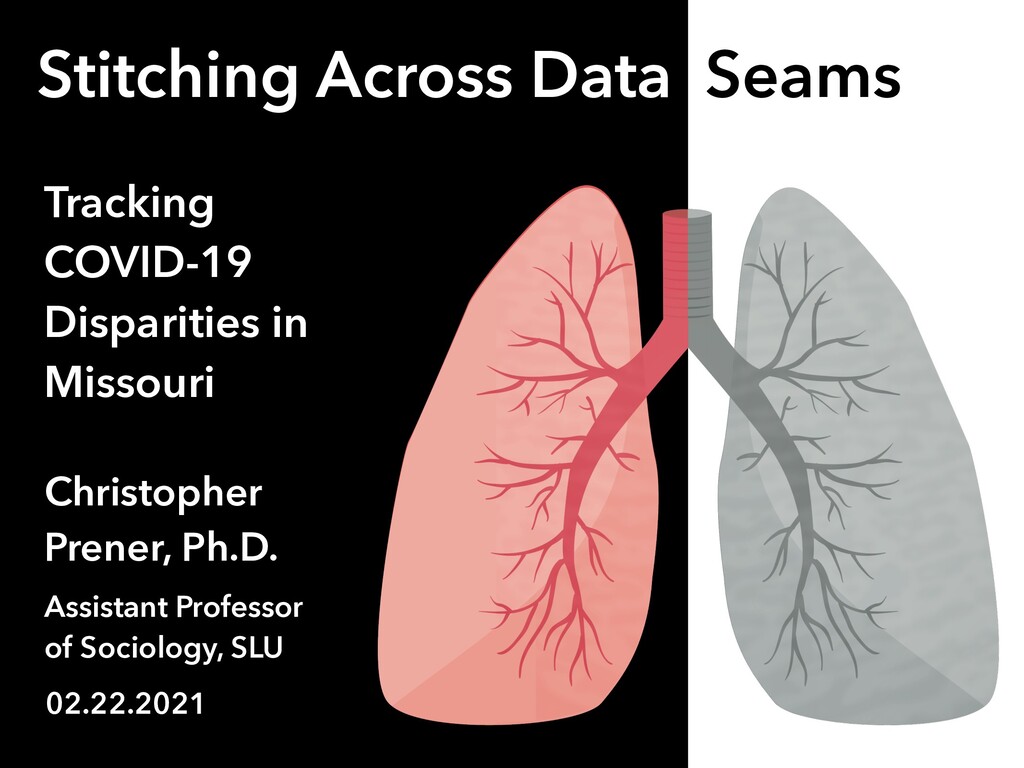
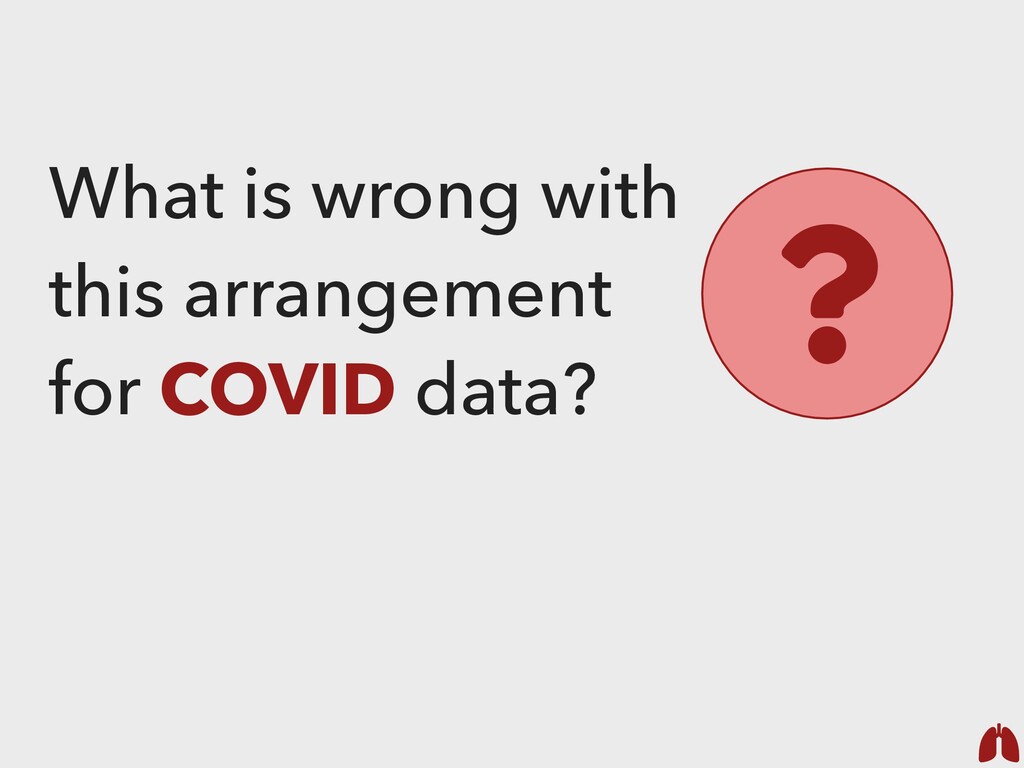
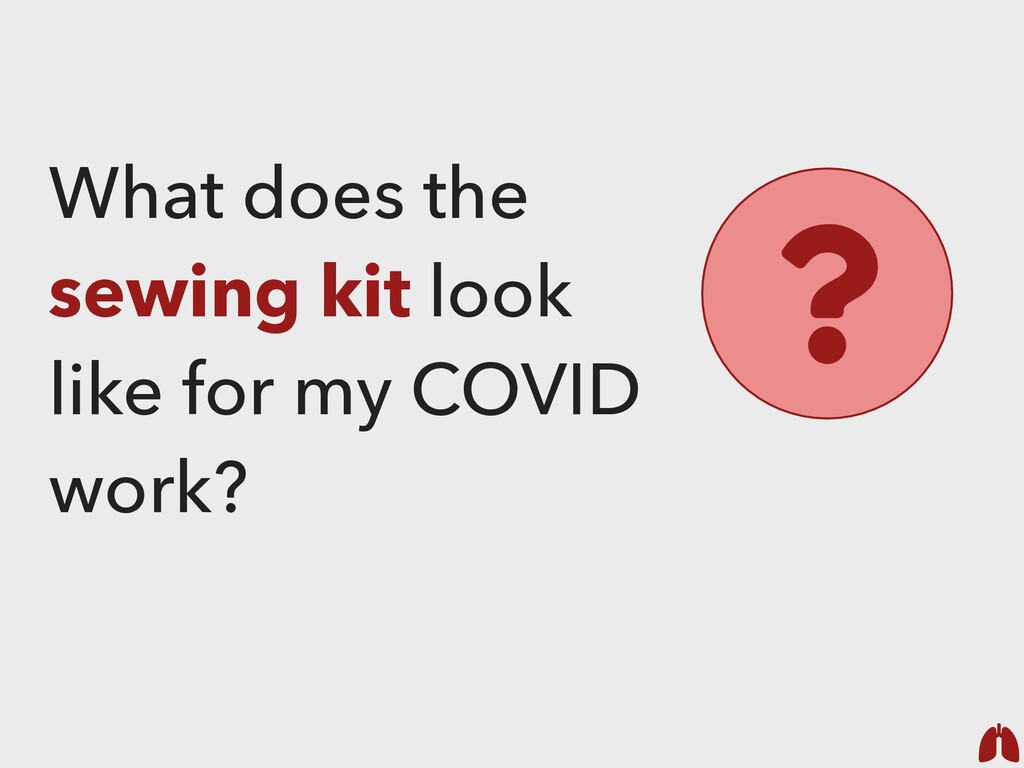
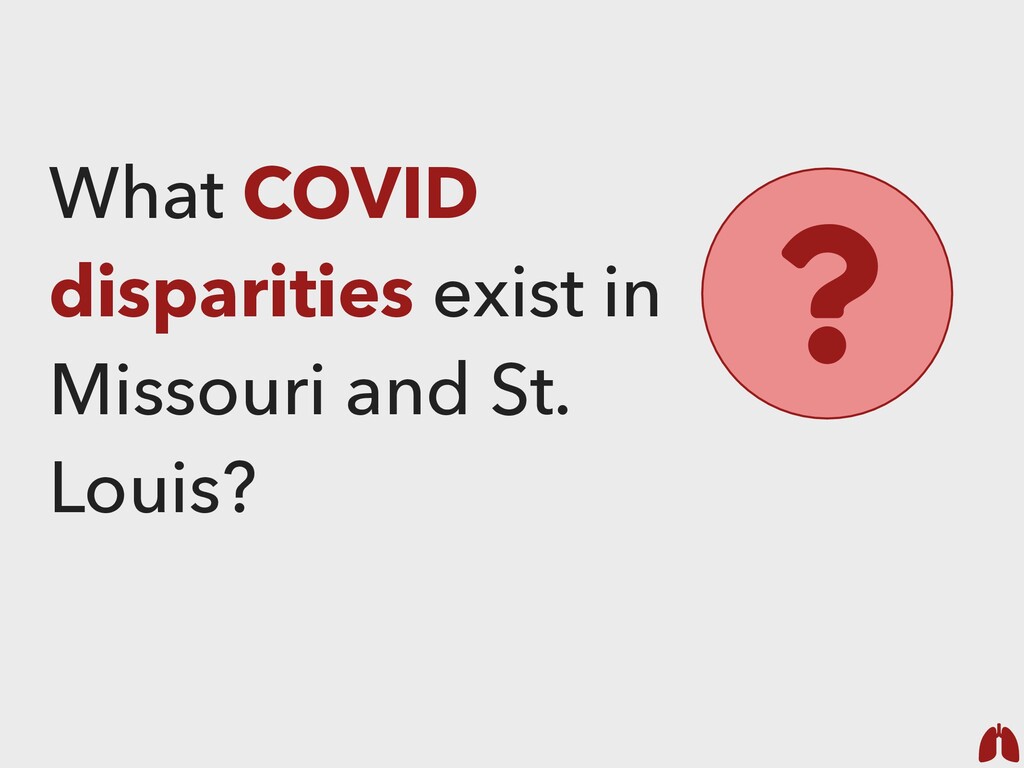
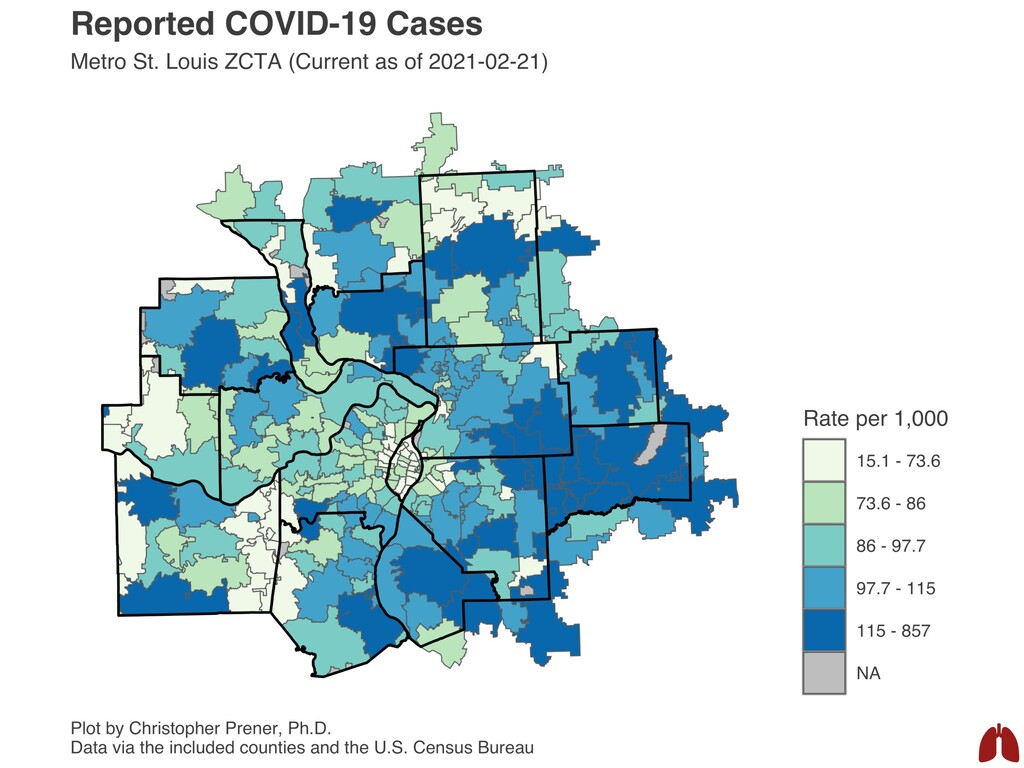
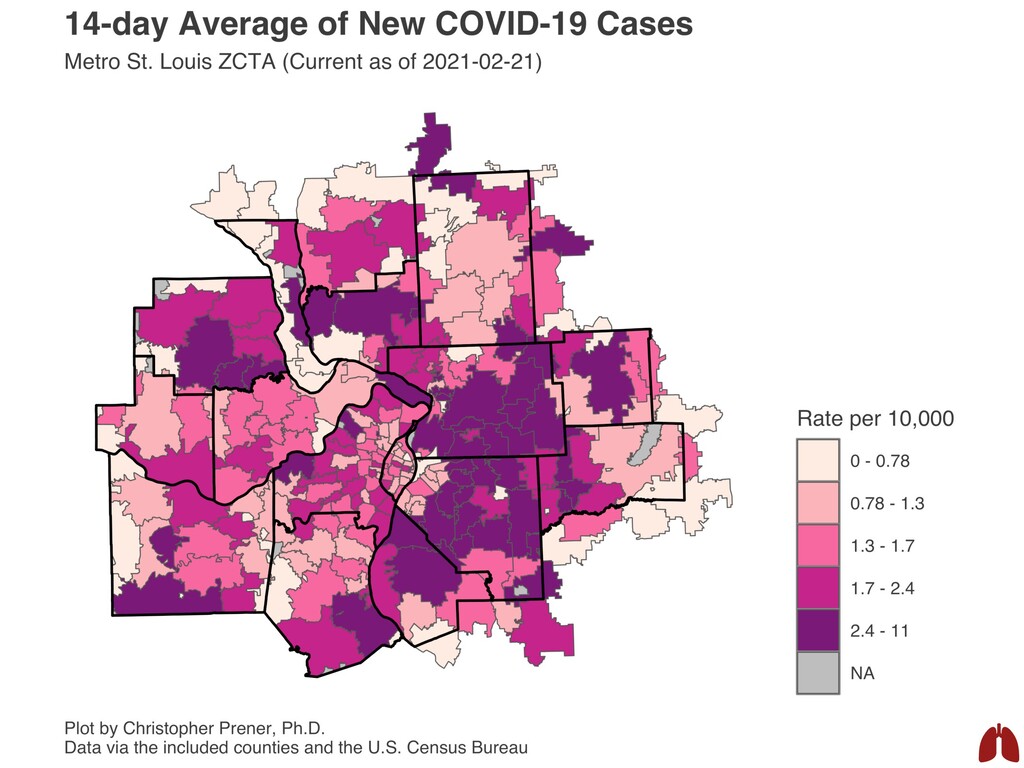
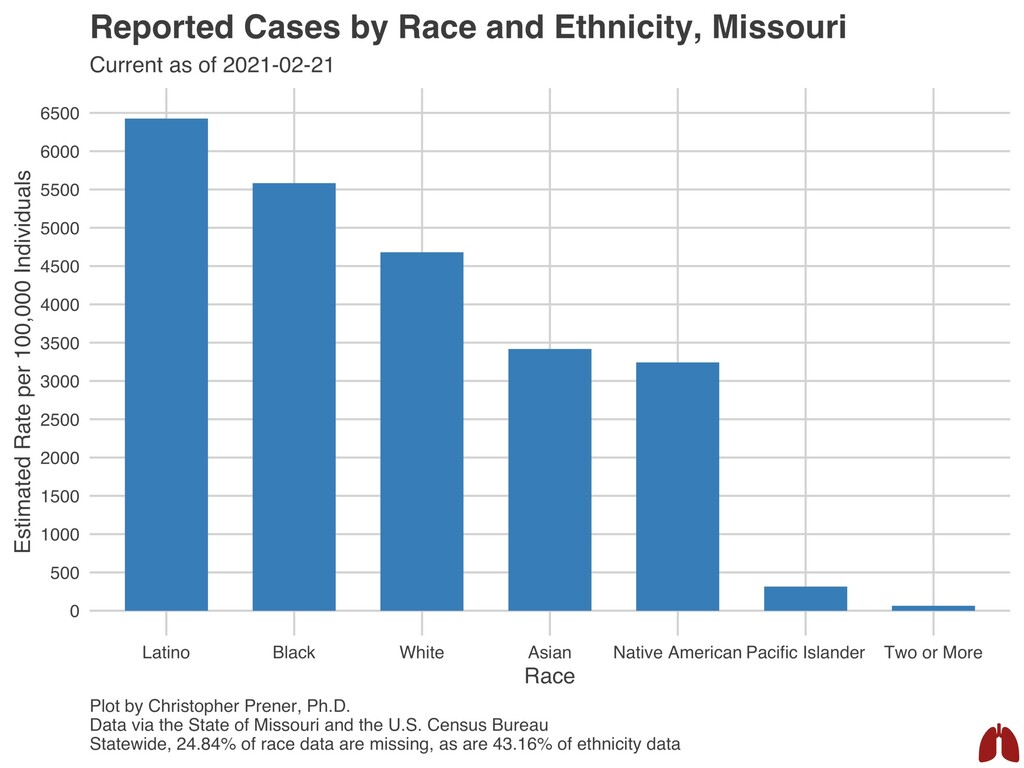
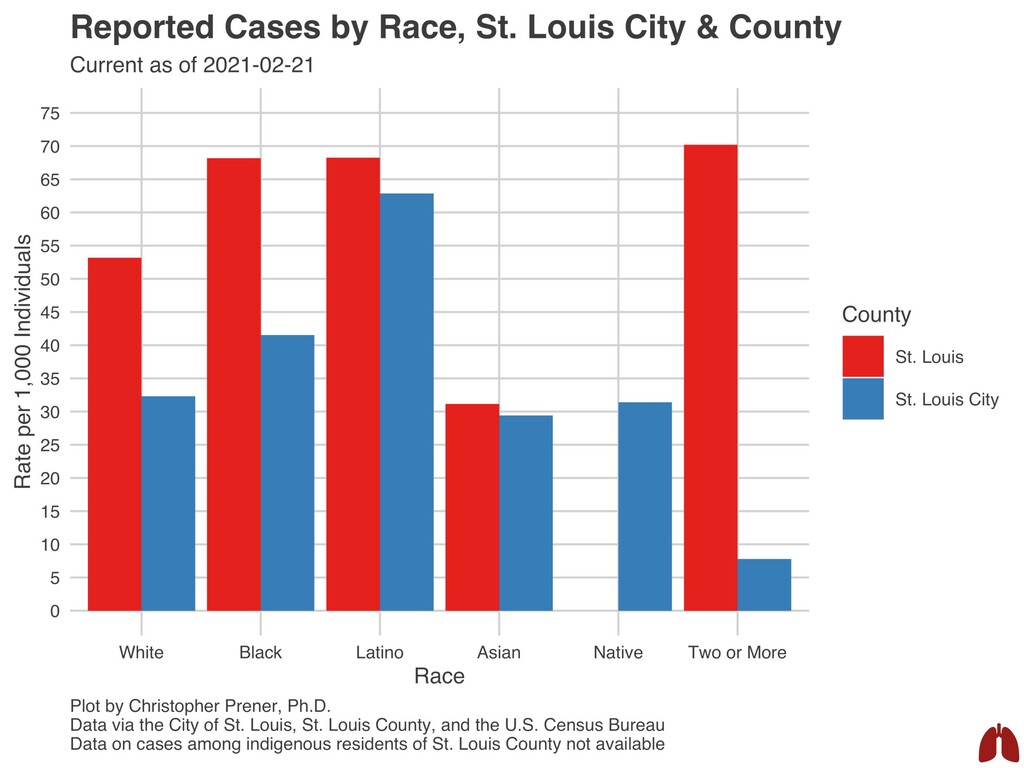
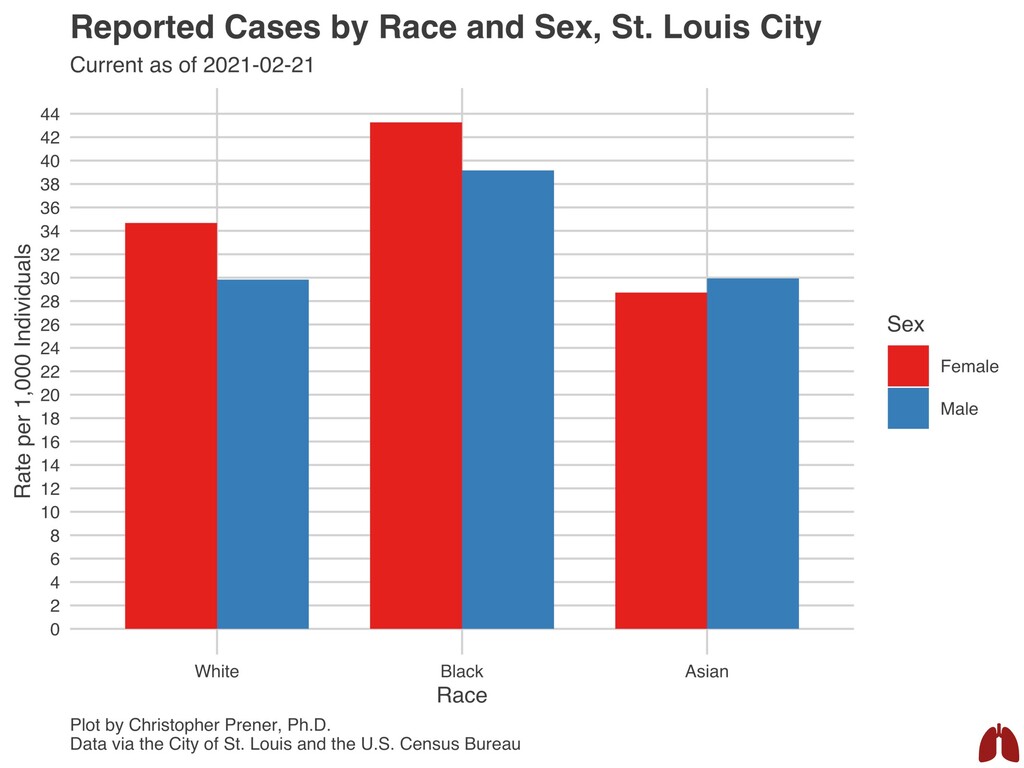
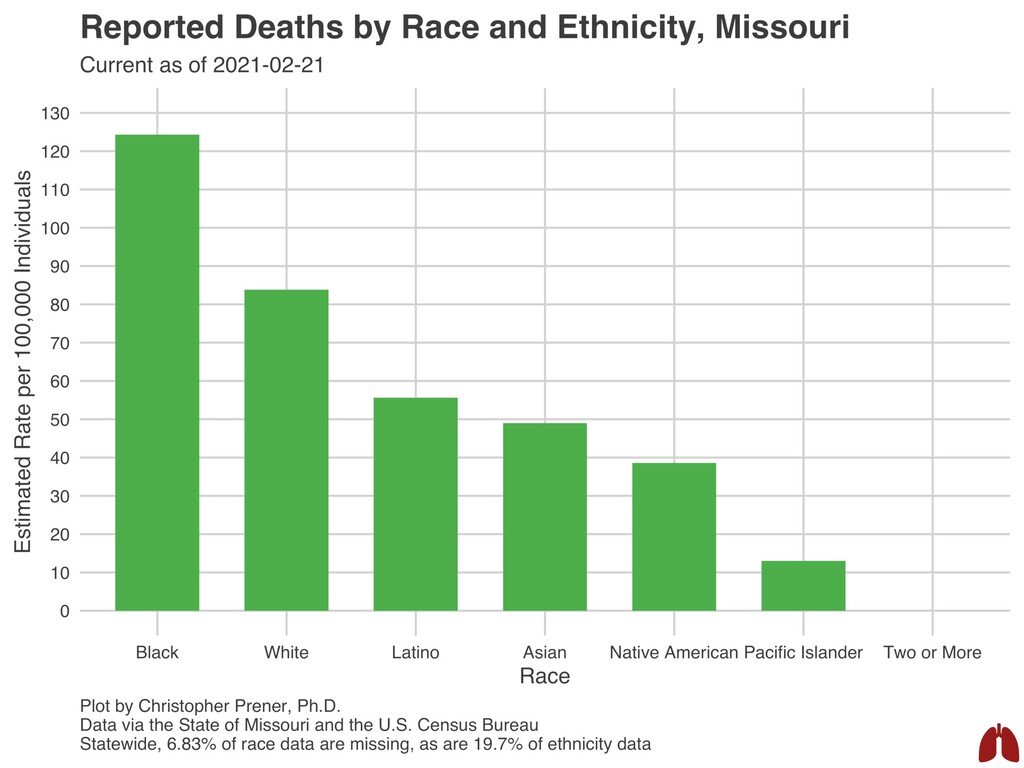
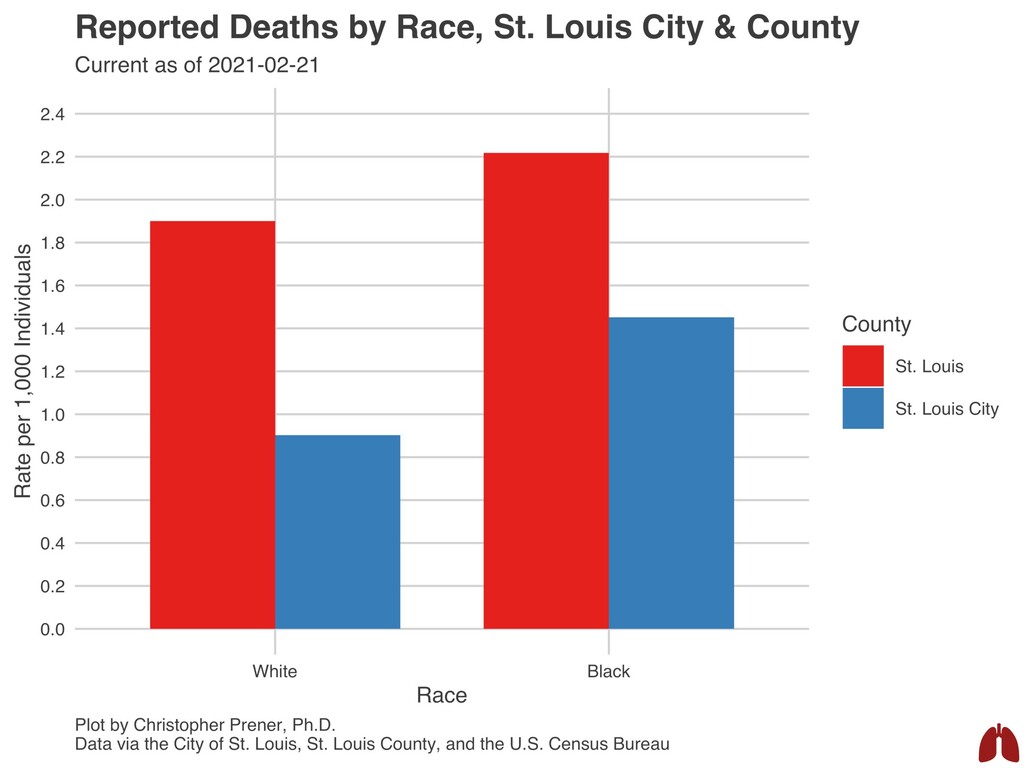
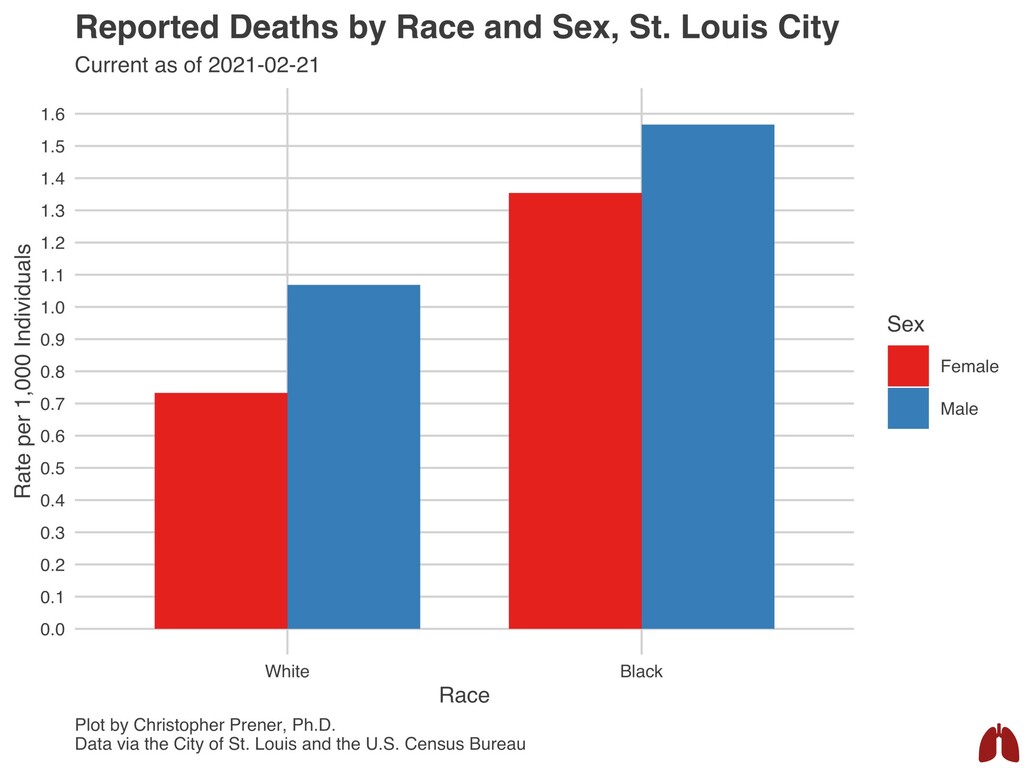
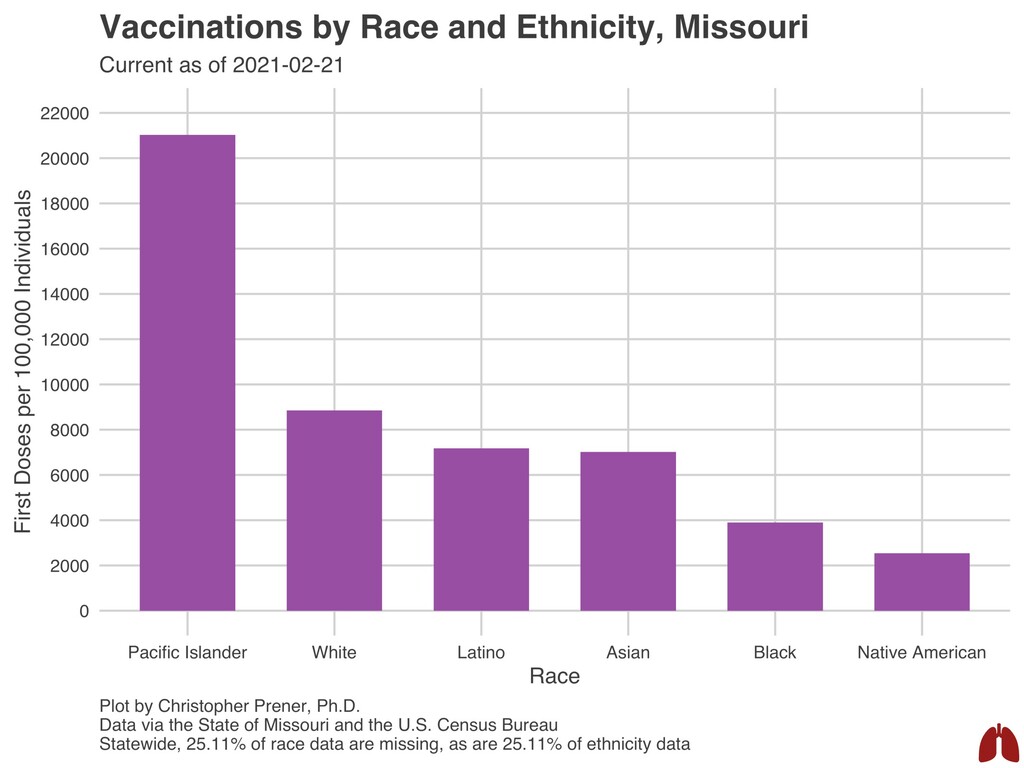
on COVID? 3. What is wrong with this arrangement for COVID data? 4. What does the sewing kit look like for my COVID work? 5. What COIVD disparities exist in Missouri and St. Louis? WASHINGTON UNIVERSITY IN ST. LOUIS | ST. LOUIS, MO | 02.22.2021
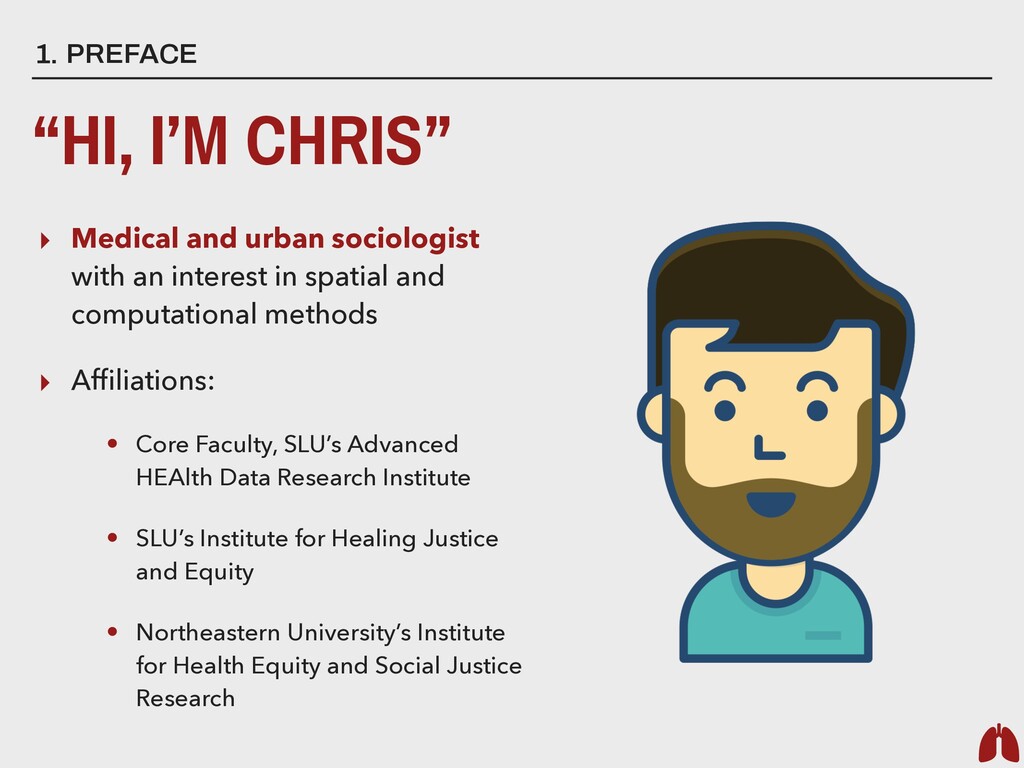
and computational methods ▸ Affiliations: • Core Faculty, SLU’s Advanced HEAlth Data Research Institute • SLU’s Institute for Healing Justice and Equity • Northeastern University’s Institute for Health Equity and Social Justice Research 1. PREFACE “HI, I’M CHRIS”
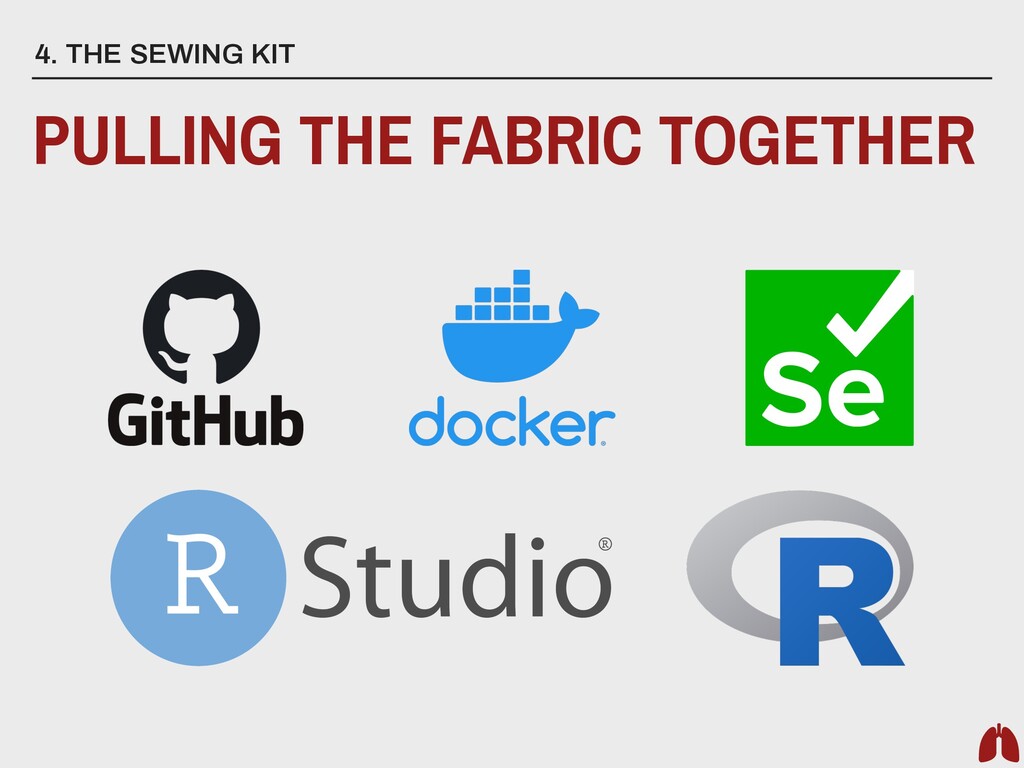
Times COVID-19 Database (via GitHub) County Public Health Zip Code Data (via scrapers+API calls) Missouri COVID Tracking Database State of Missouri and Illinois (via scrapers) CMS Nursing Home Data (via API) Census Bureau (via API)
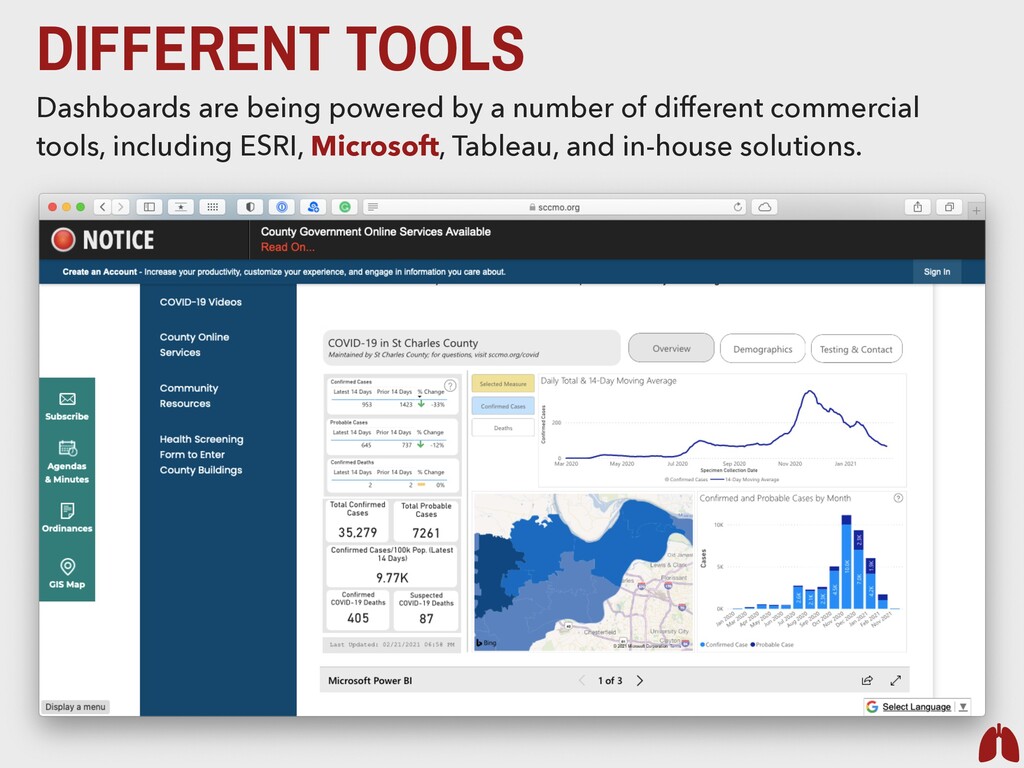
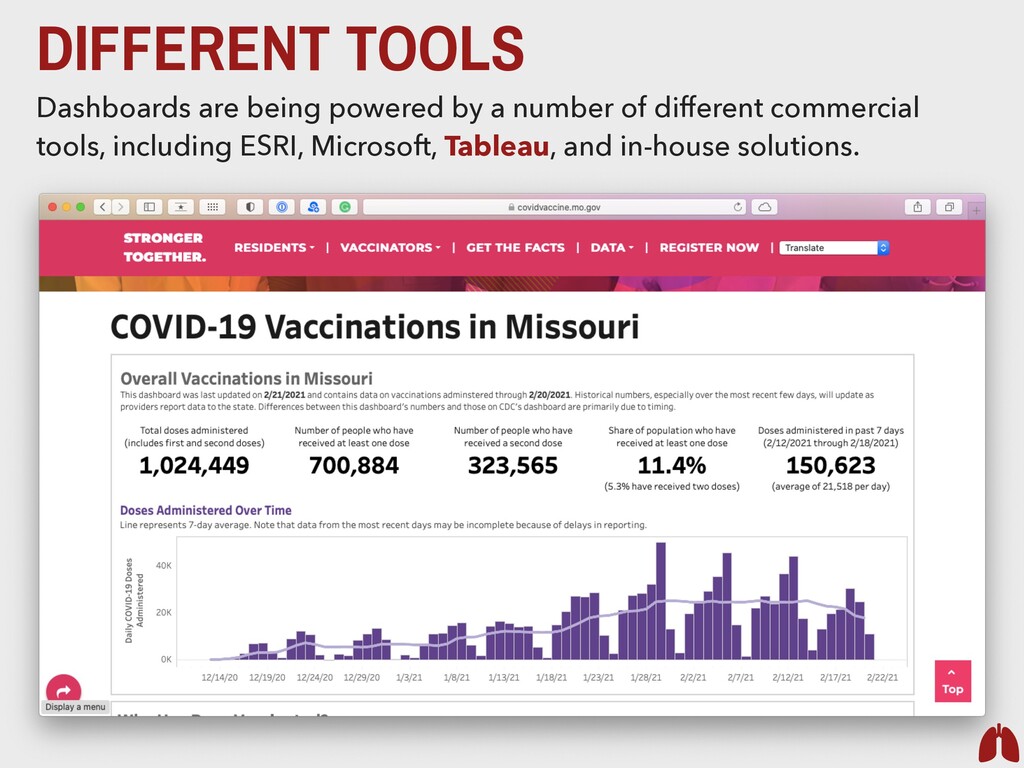
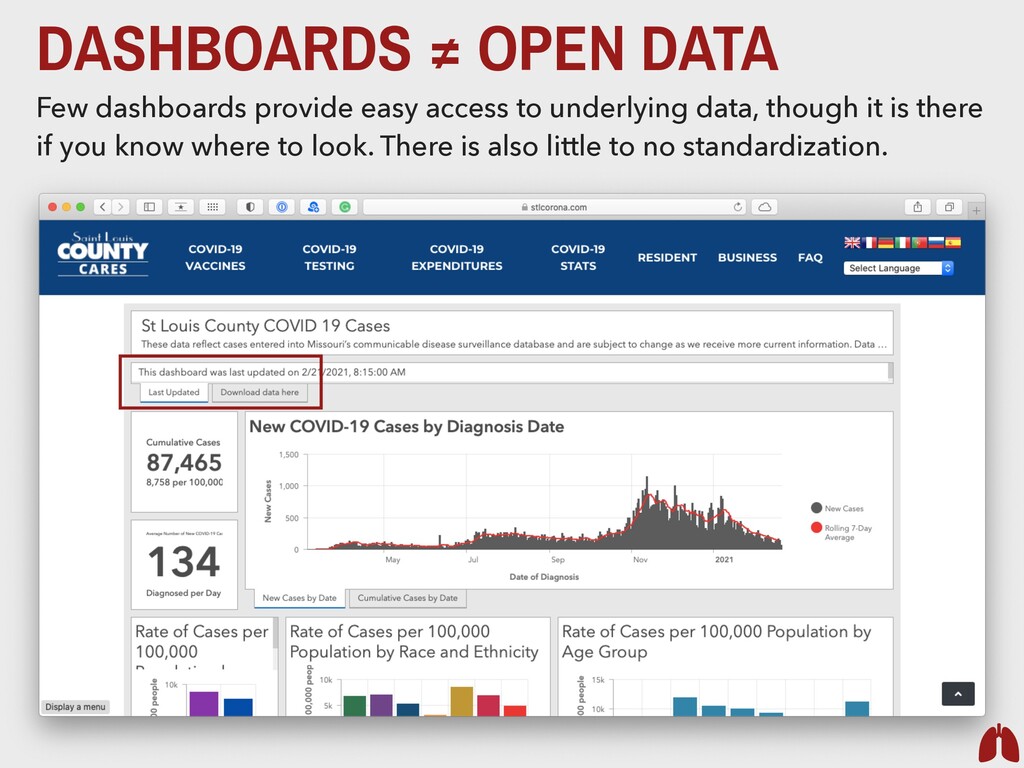
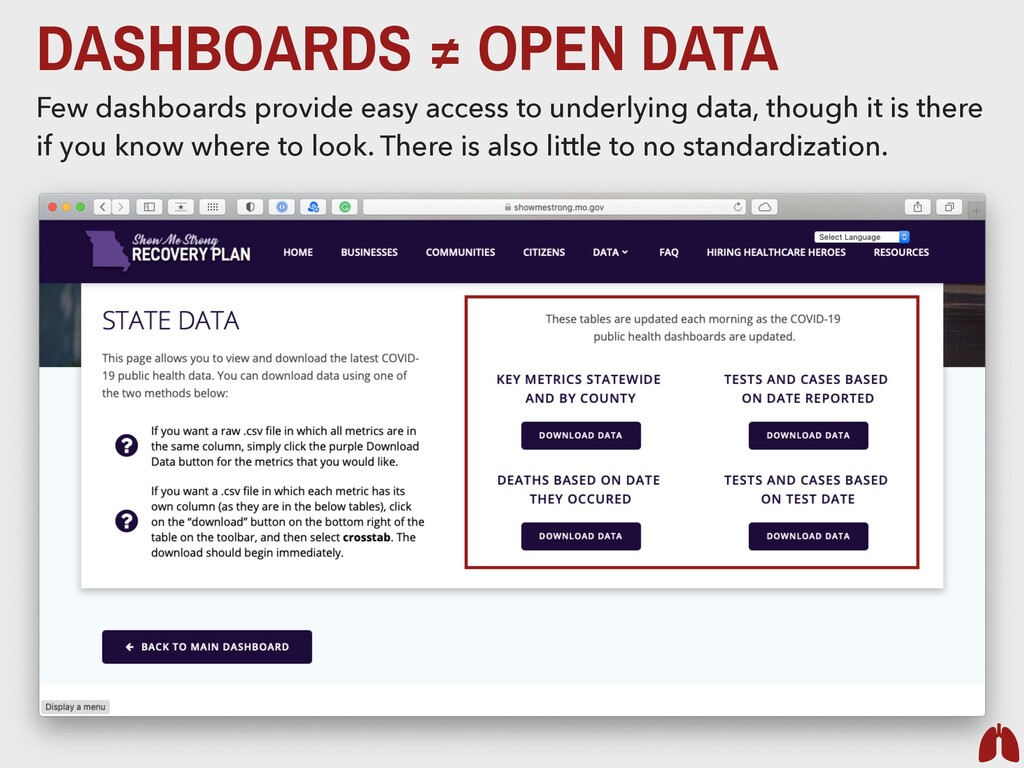
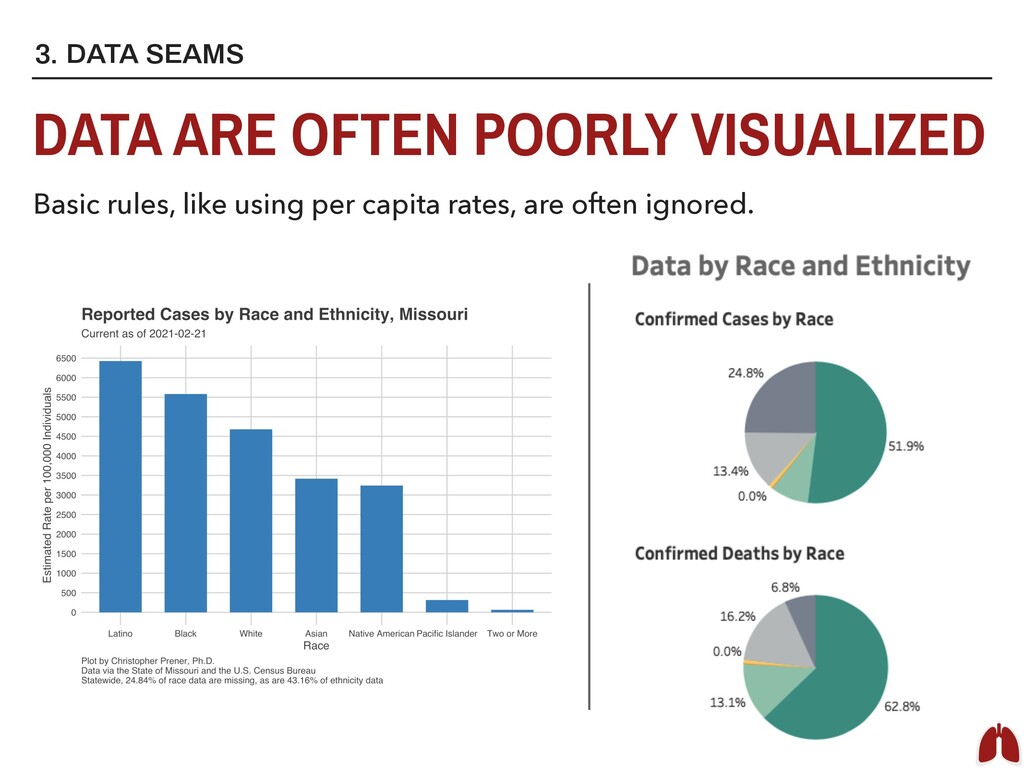
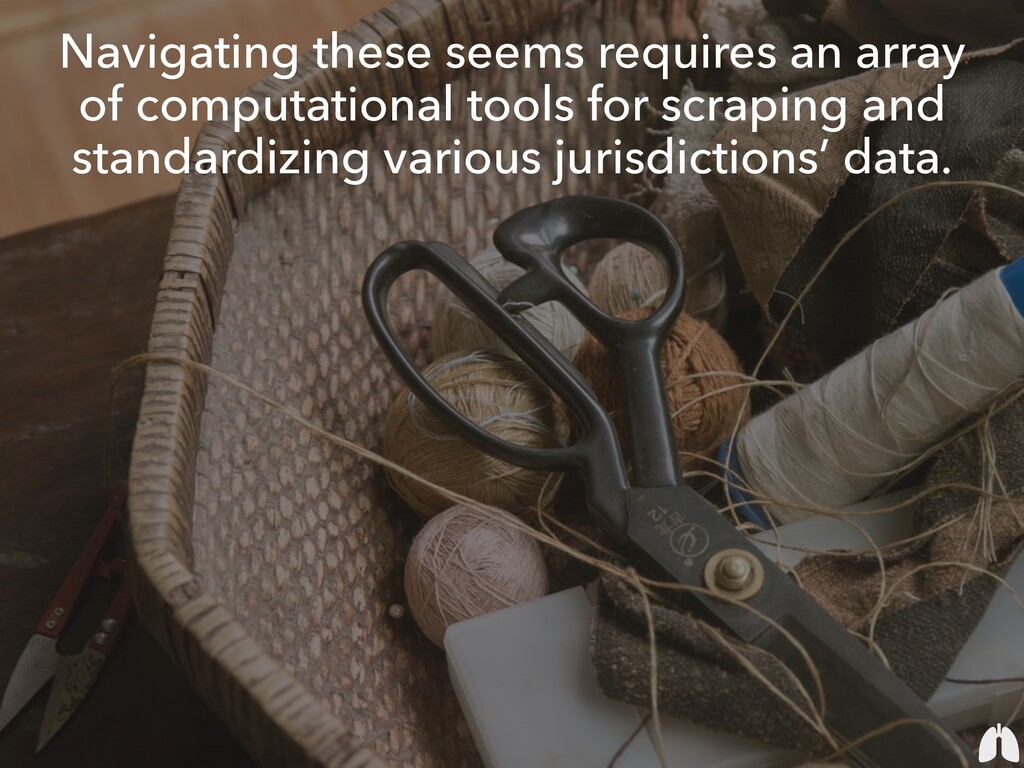
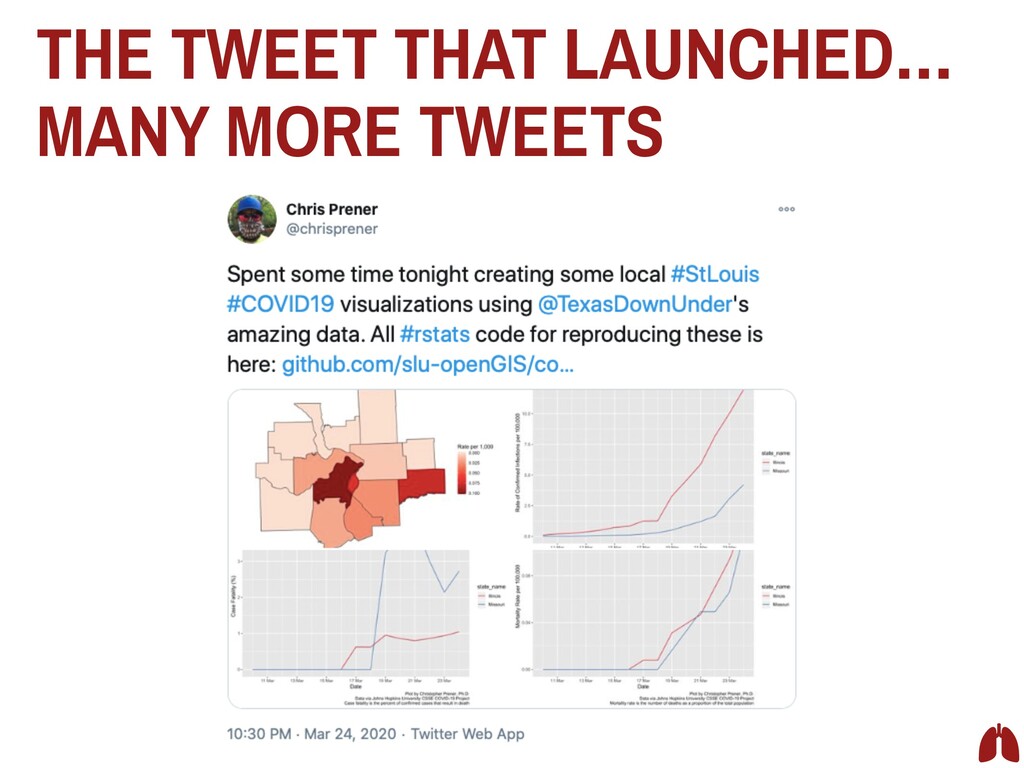
not the first priority: ▸ COVID-19 data sources suffer from a lack of standardization, often cannot be accessed. ▸ COVID-19 “dashboards” are all the rage, but there are frequent issues across jurisdictions with how similar metrics are being communicated. ▸ This has increased demand for my COVID tracking project. ▸ Iterating on analyses is not something we always get to do, but it is tremendously gratifying. ▸ Open data and science are also about community and communication.
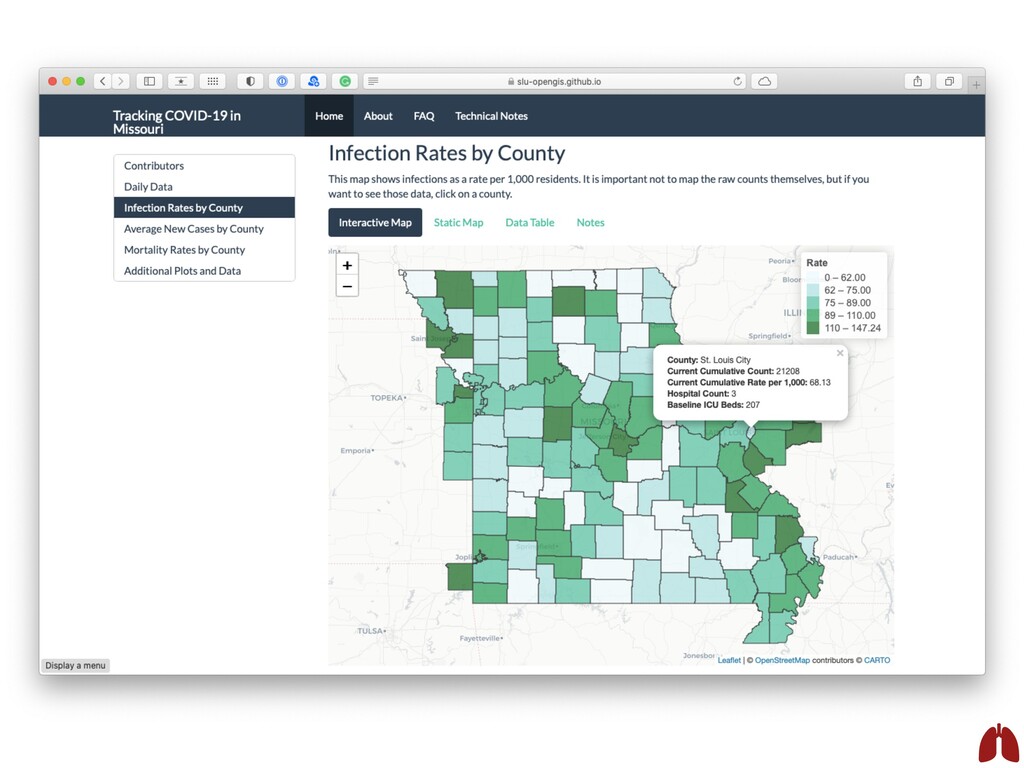
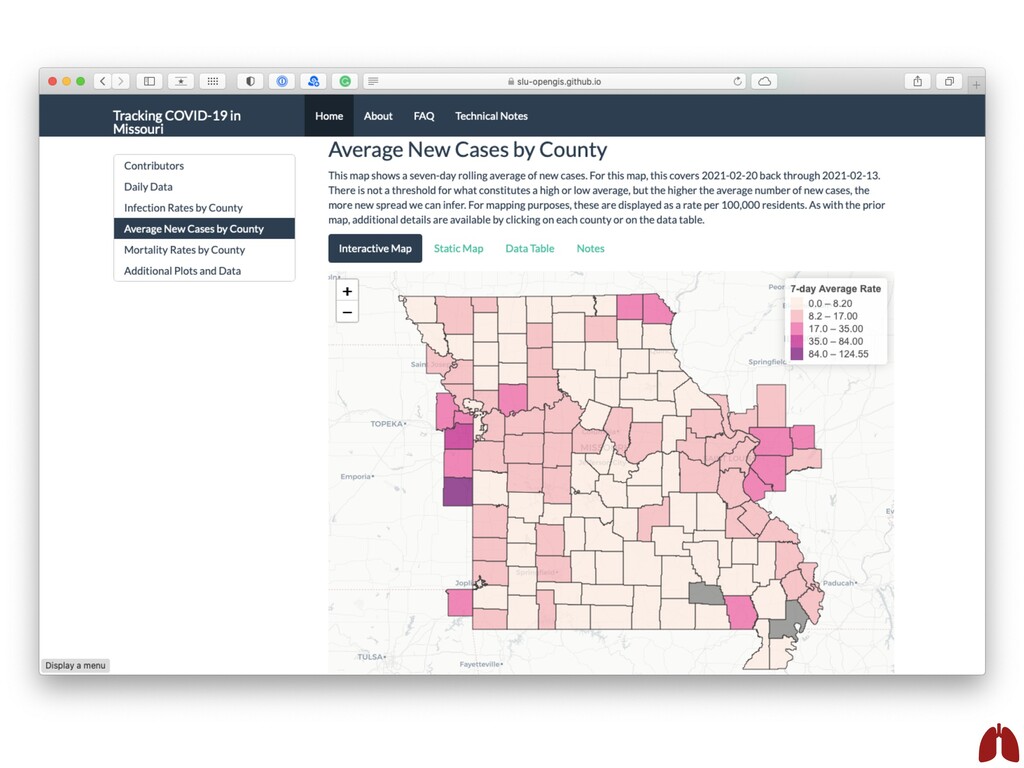
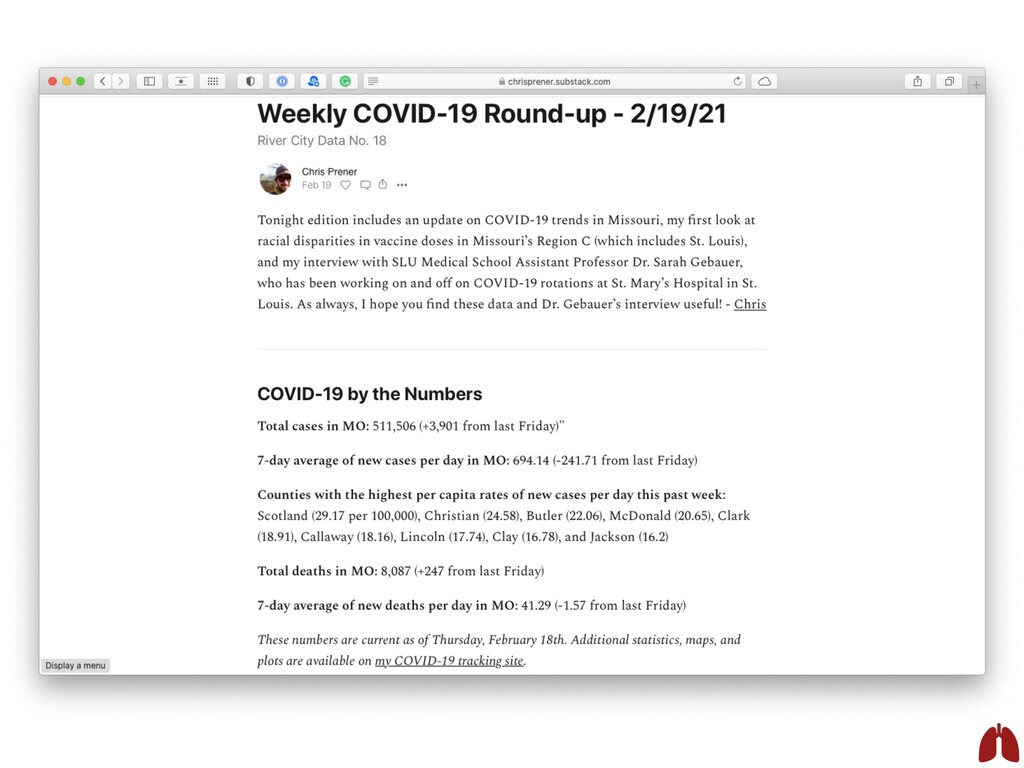
Raw data, code available via GitHub github.com/slu-openGIS/ MO_HEALTH_Covid_Tracking [email protected] chris-prener.github.io LEARN MORE THANKS FOR COMING! @chrisprener Visualization code available via GitHub github.com/slu-openGIS/ covid_daily_viz slu-opengis.github.io/ covid_daily_viz/ chrisprener.substack.com