Upgrade to Pro — share decks privately, control downloads, hide ads and more …

Automated Performance Testing With WebDriver - Christian Bromann, Sauce Labs

Automated Performance Testing With WebDriver - Christian Bromann, Sauce Labs

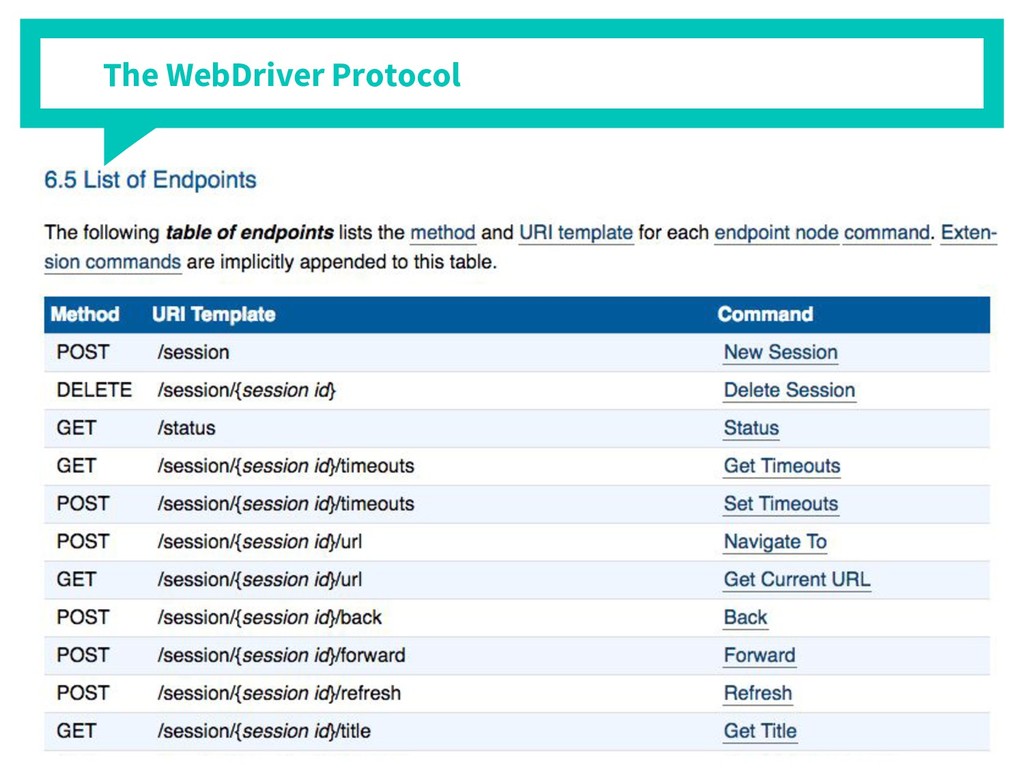
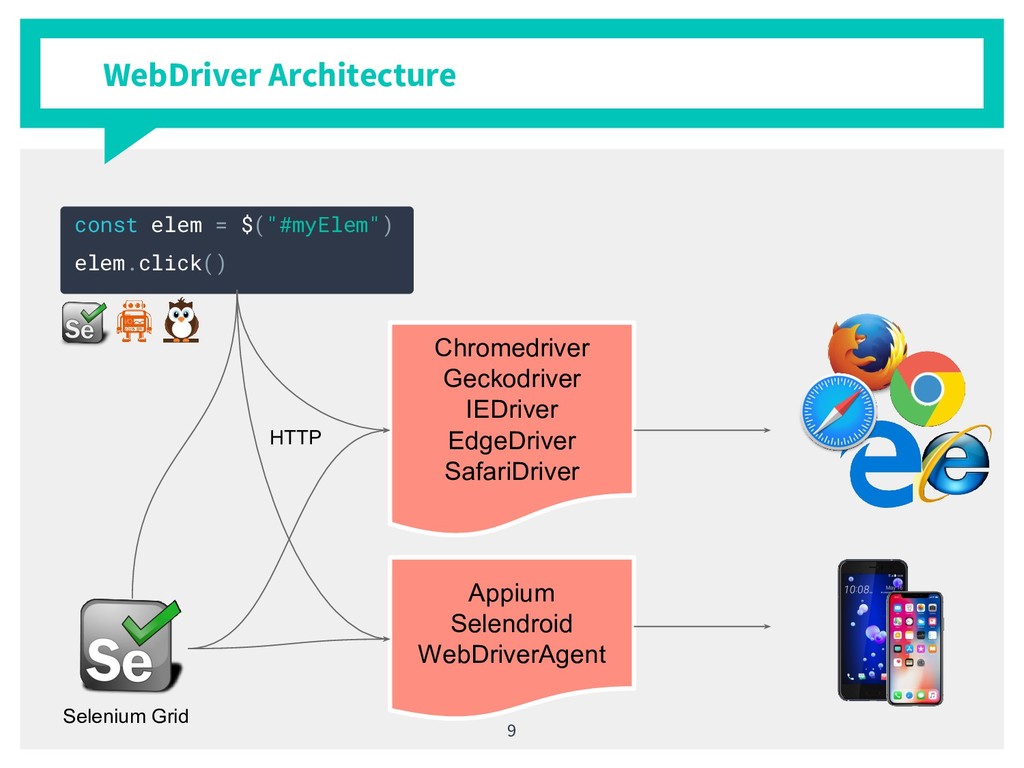
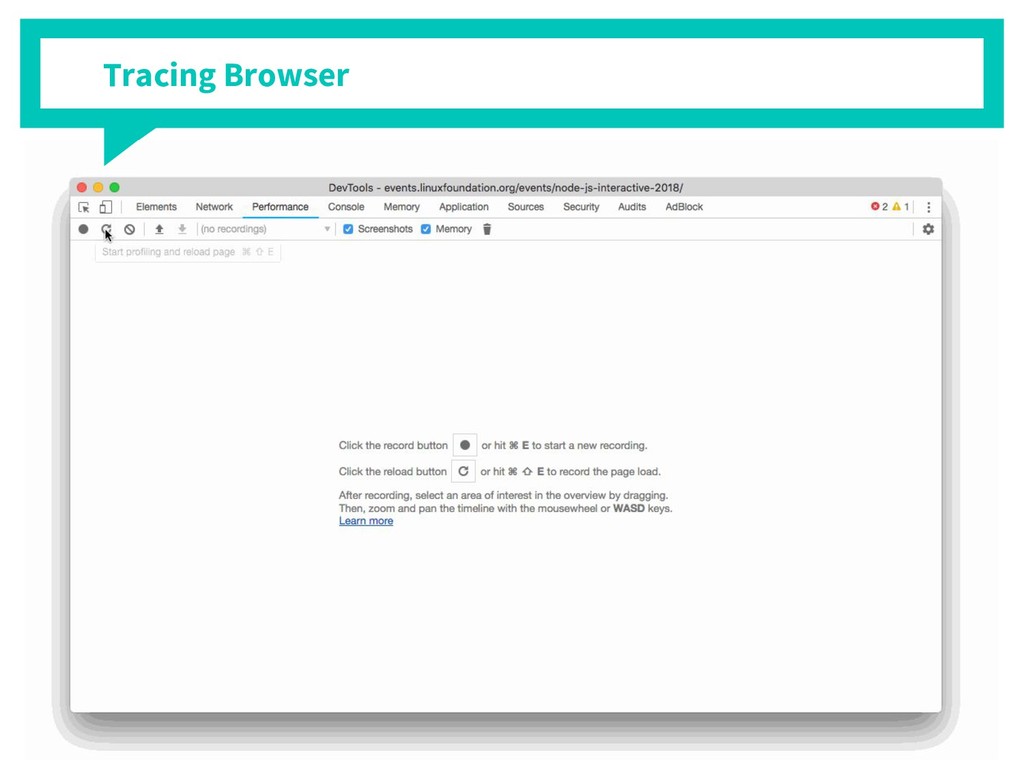
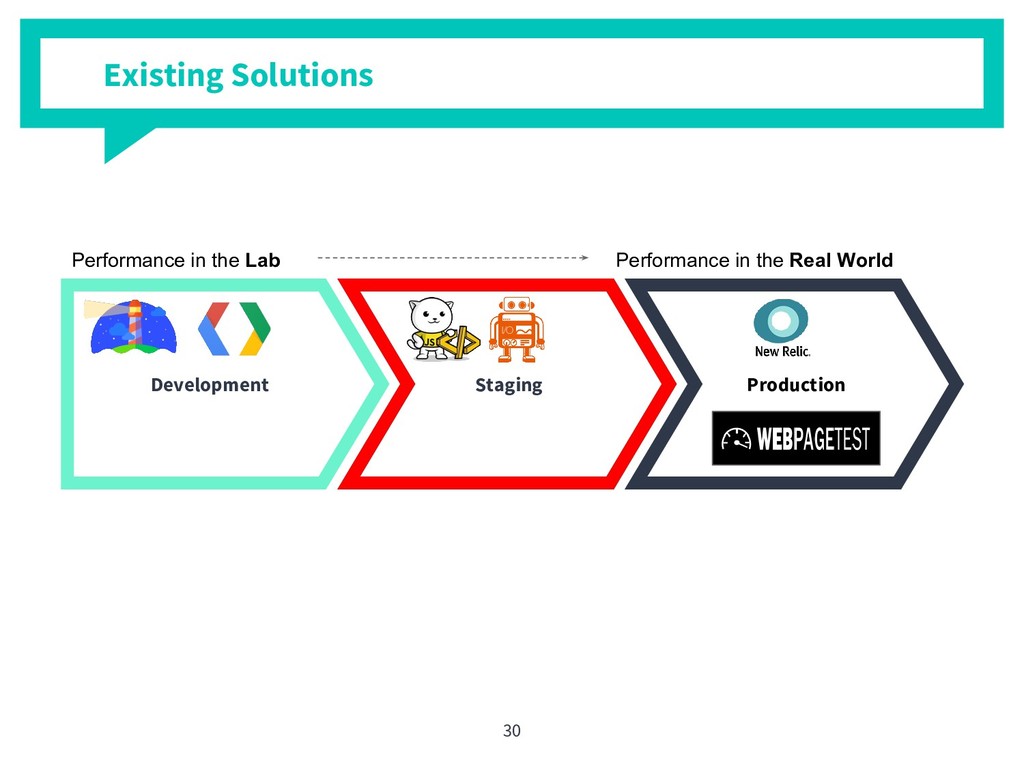
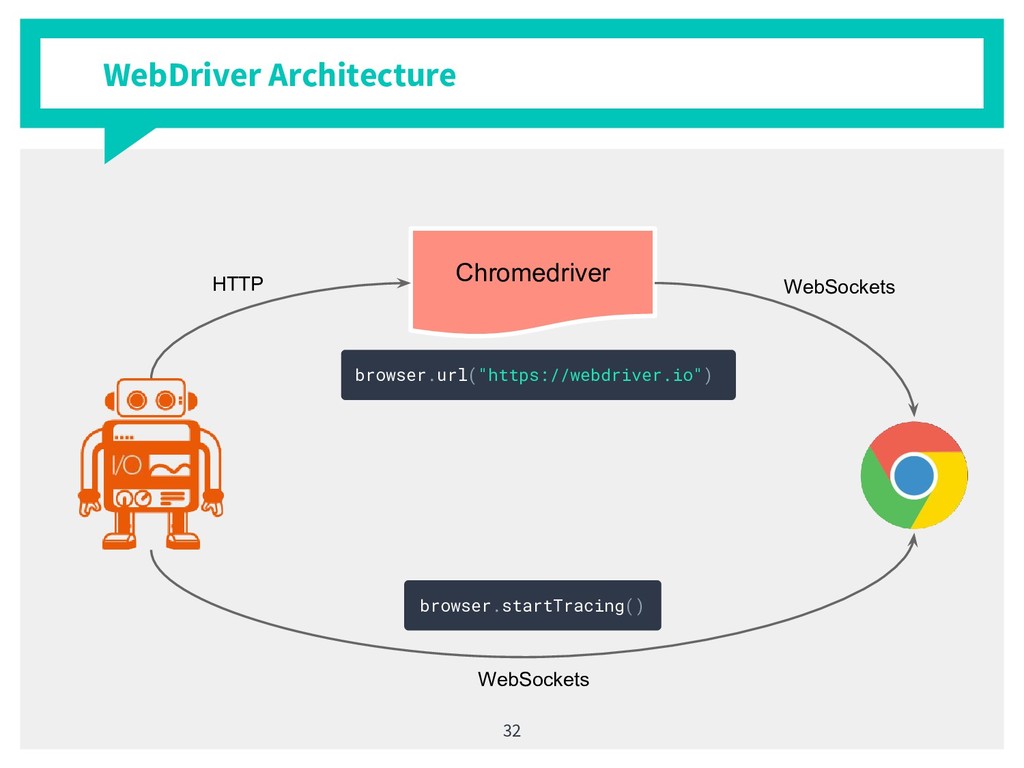
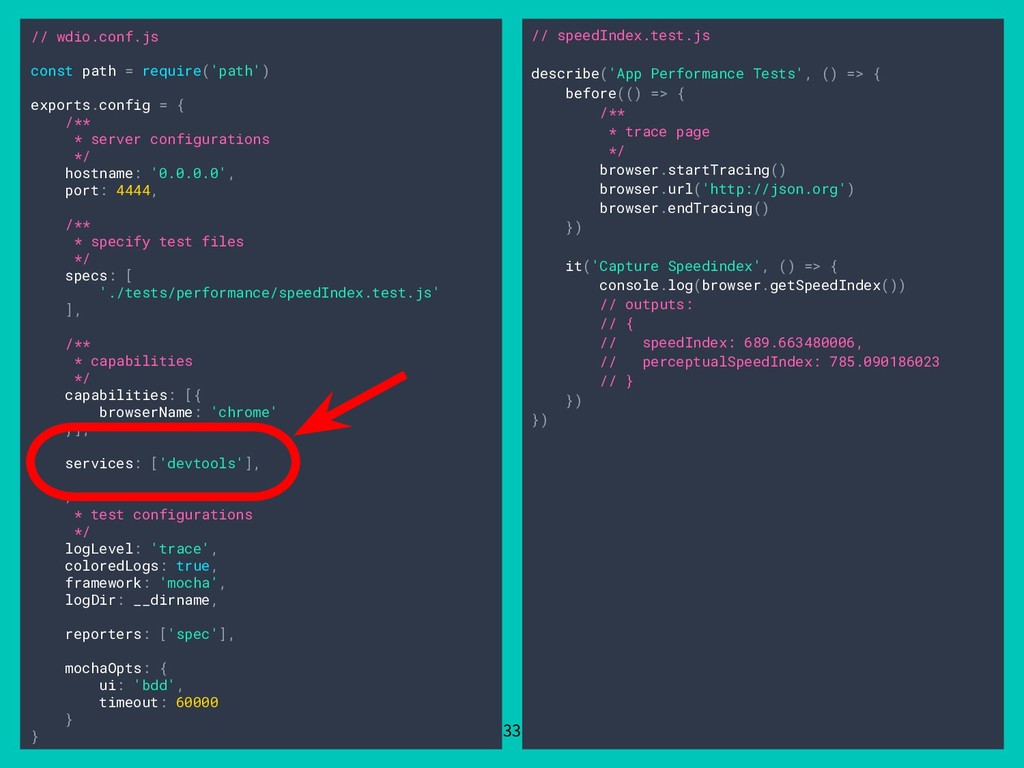
This talk will look into solutions to automatically capture and assert the performance as part of your functional tests using WebDriver and Chrome DevTools technologies. By looking into the workflow of a browser driver, you will learn not only how a WebDriver actually automates web pages, you will also get insights on how you need to tweak this setup to start capturing live tracing data from the browser.

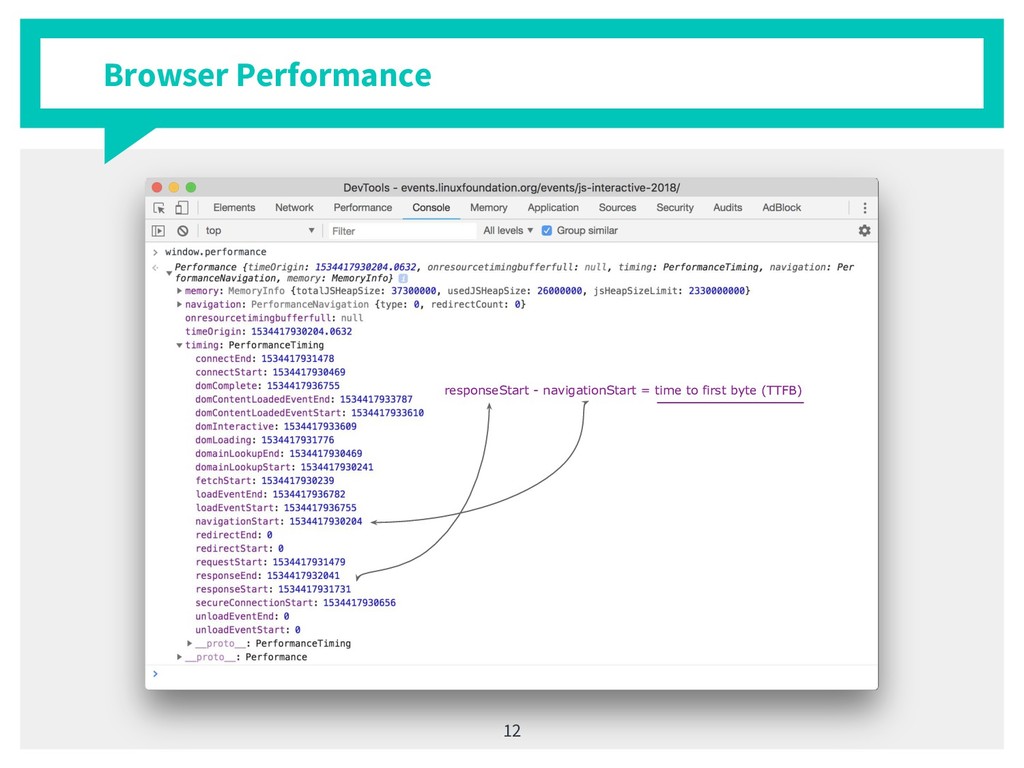
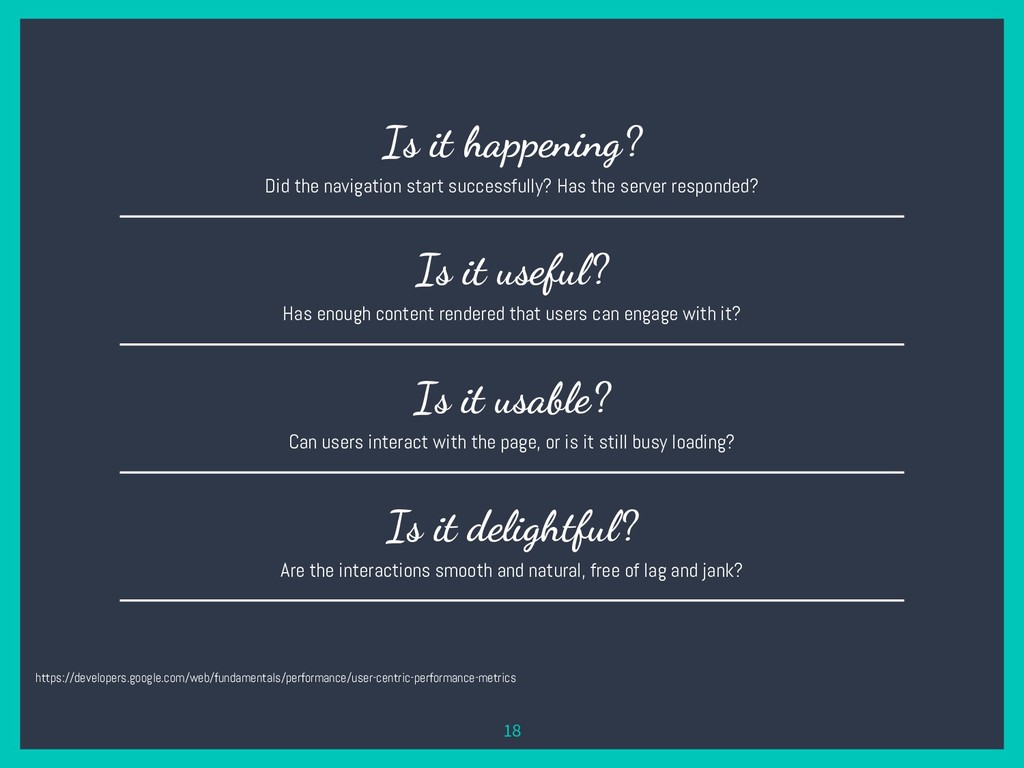
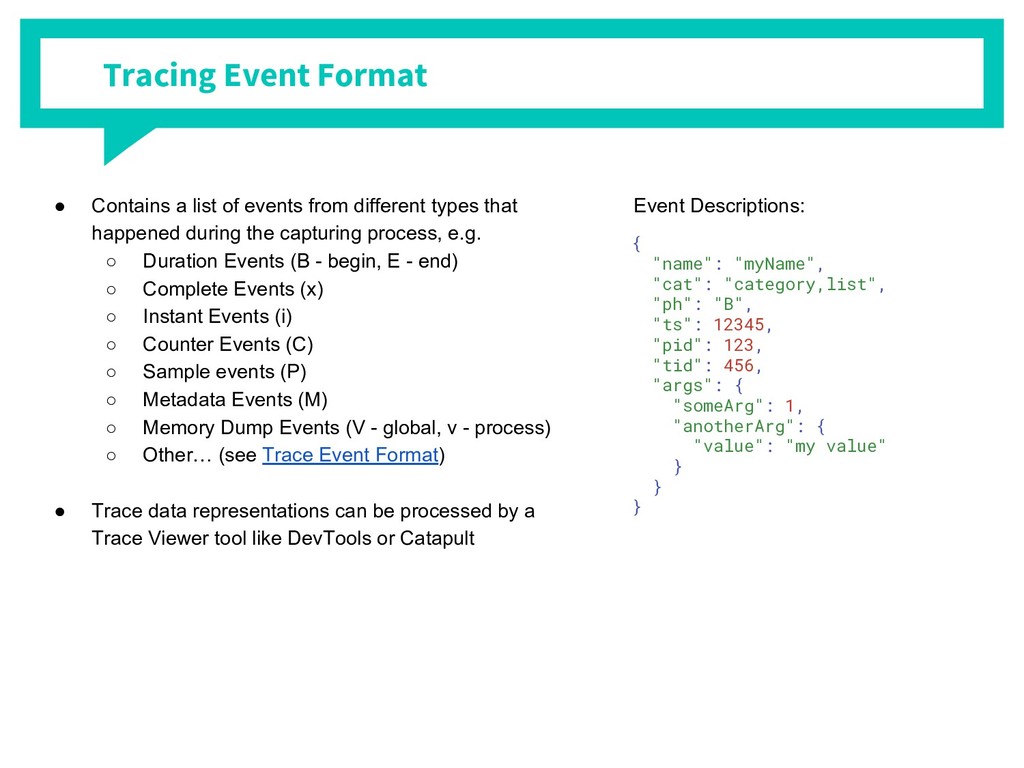
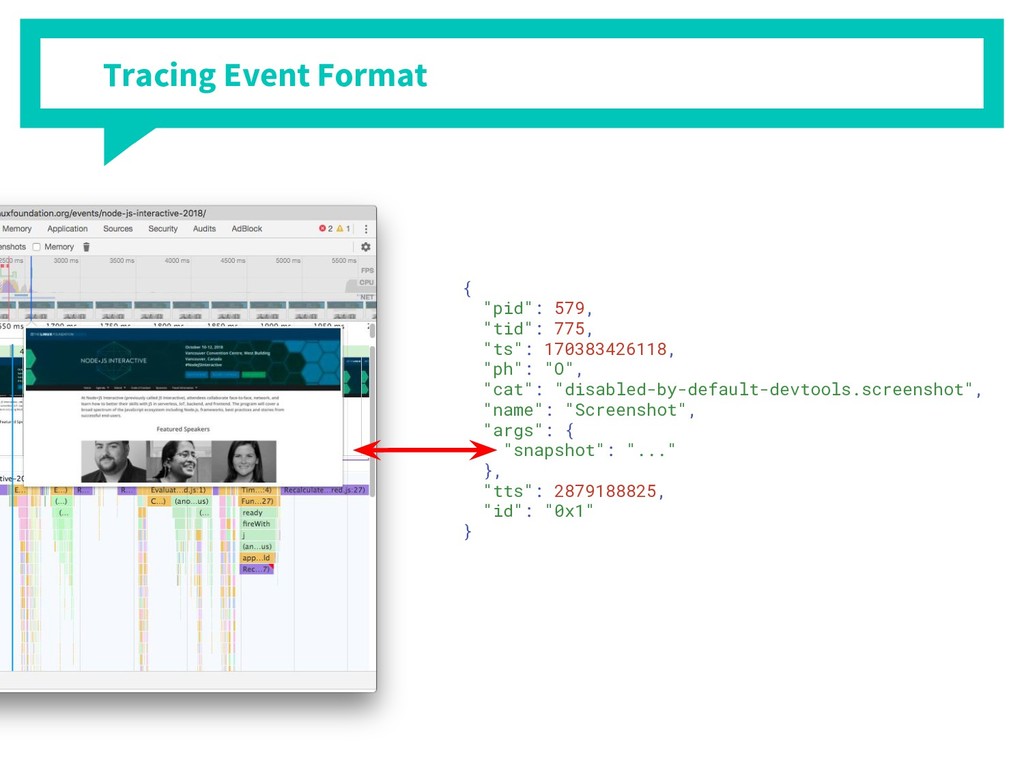
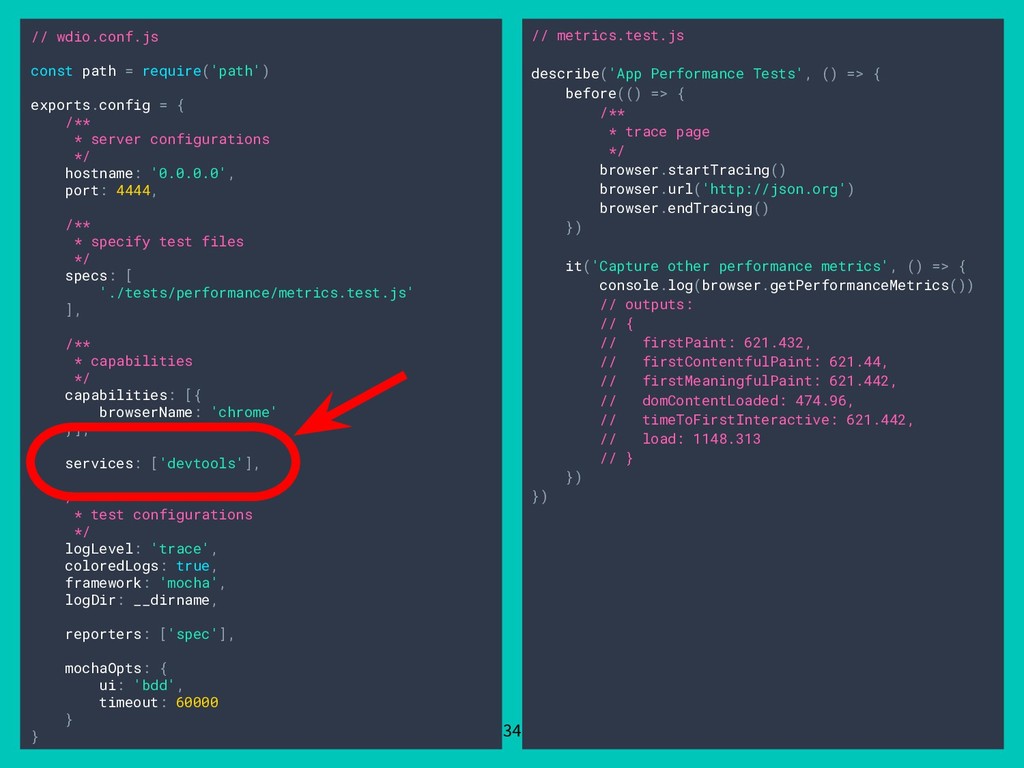
Analyzing the performance of a web application is hard and can’t be done by just looking at the raw captured data. Therefore you will learn how tracing data is structured and which Node.js tools you can use to compute the important user experience metrics out of it. With this knowledge, you will be able to ensure that your PWA stays within your defined performance budget every time you run your end-to-end test in CI/CD.

Christian Bromann

October 10, 2018
Tweet

More Decks by Christian Bromann

Other Decks in Programming

Transcript

  1. Hello! I am Christian Bromann Software Engineer for the DevTools

    team at SauceLabs @bromann 2 christian-bromann
  2. 53% of mobile site visits are abandoned if pages take

    longer than 3 seconds to load. (Study by DoubleClick owned by Google) 3.21s Is the average load of a webpage (Pingdom/2018) 3034 kb is the average web page size in 2018, trend: increasing (https://speedcurve.com/blog/web-performance-page-bloat/) 3
  3. “ How fast your website loads is critical but often

    a completely ignored element in any online business and that includes search marketing and search engine optimisation. Google. 4
  4. “ Performance stands out like a ton of diamonds. Nonperformance

    can always be explained away. Harold S. Geneen. 6
  5. The WebDriver Protocol ▪ Here you have a list of

    items ▪ And some text ▪ But remember not to overload your slides with content Your audience will listen to you or read the content, but won’t do both. 8
  6. WebDriver Architecture 9 const elem = $("#myElem") elem.click() Chromedriver Geckodriver

    IEDriver EdgeDriver SafariDriver Appium Selendroid WebDriverAgent HTTP Selenium Grid
  7. WebDriver Limitations 10 ▪ Only a limited set of commands

    ▪ No debugging capabilities ▪ Stateless ▪ Slow ▪ Stagnant innovation
  8. Paint Metrics 15 First Paint (FP) First Contentful Paint (FCP)

    First Meaningful Paint (FMP) Time To Interactive (TTI) First Pain first render to the screen First Contentful Paint is triggered when any content is painted – i.e. something defined in the DOM First Meaningful Paint measures how long it takes for the most meaningful content to be fully rendered on the site. Time To Interactive number of seconds from the time the navigation started until the layout is stabilized
  9. 18 Is it happening? Did the navigation start successfully? Has

    the server responded? Is it useful? Has enough content rendered that users can engage with it? Is it usable? Can users interact with the page, or is it still busy loading? Is it delightful? Are the interactions smooth and natural, free of lag and jank? https://developers.google.com/web/fundamentals/performance/user-centric-performance-metrics
  10. 19

  11. “ Fast forward to today and we see that window.onload

    doesn’t reflect the user perception as well as it once did. Steve Souders. 20
  12. Tracing Event Format 23 • Contains a list of events

    from different types that happened during the capturing process, e.g. ◦ Duration Events (B - begin, E - end) ◦ Complete Events (x) ◦ Instant Events (i) ◦ Counter Events (C) ◦ Sample events (P) ◦ Metadata Events (M) ◦ Memory Dump Events (V - global, v - process) ◦ Other… (see Trace Event Format) • Trace data representations can be processed by a Trace Viewer tool like DevTools or Catapult { "name": "myName", "cat": "category,list", "ph": "B", "ts": 12345, "pid": 123, "tid": 456, "args": { "someArg": 1, "anotherArg": { "value": "my value" } } } Event Descriptions:
  13. Tracing Event Format 26 { "pid": 41316, "tid": 775, "ts":

    170385299237, "ph": "I", "cat": "devtools.timeline", "name": "UpdateCounters", "args": { "data": { "jsEventListeners": 31, "nodes": 4089, "documents": 9, "jsHeapSizeUsed": 11140520 } }, "tts": 20811400, "s": "t" }
  14. Tracing Event Format 27 { "pid": 579, "tid": 775, "ts":

    170383426118, "ph": "O", "cat": "disabled-by-default-devtools.screenshot", "name": "Screenshot", "args": { "snapshot": "..." }, "tts": 2879188825, "id": "0x1" }
  15. White Is the color of milk and fresh snow, the

    color produced by the combination of all the colors of the visible spectrum. // wdio.conf.js const path = require('path') exports.config = { /** * server configurations */ hostname: '0.0.0.0', port: 4444, /** * specify test files */ specs: [ './tests/performance/speedIndex.test.js' ], /** * capabilities */ capabilities: [{ browserName: 'chrome' }], services: ['devtools'], /** * test configurations */ logLevel: 'trace', coloredLogs: true, framework: 'mocha', logDir: __dirname, reporters: ['spec'], mochaOpts: { ui: 'bdd', timeout: 60000 } } 33 // speedIndex.test.js describe('App Performance Tests', () => { before(() => { /** * trace page */ browser.startTracing() browser.url('http://json.org') browser.endTracing() }) it('Capture Speedindex', () => { console.log(browser.getSpeedIndex()) // outputs: // { // speedIndex: 689.663480006, // perceptualSpeedIndex: 785.090186023 // } }) })
  16. White Is the color of milk and fresh snow, the

    color produced by the combination of all the colors of the visible spectrum. // wdio.conf.js const path = require('path') exports.config = { /** * server configurations */ hostname: '0.0.0.0', port: 4444, /** * specify test files */ specs: [ './tests/performance/metrics.test.js' ], /** * capabilities */ capabilities: [{ browserName: 'chrome' }], services: ['devtools'], /** * test configurations */ logLevel: 'trace', coloredLogs: true, framework: 'mocha', logDir: __dirname, reporters: ['spec'], mochaOpts: { ui: 'bdd', timeout: 60000 } } 34 // metrics.test.js describe('App Performance Tests', () => { before(() => { /** * trace page */ browser.startTracing() browser.url('http://json.org') browser.endTracing() }) it('Capture other performance metrics', () => { console.log(browser.getPerformanceMetrics()) // outputs: // { // firstPaint: 621.432, // firstContentfulPaint: 621.44, // firstMeaningfulPaint: 621.442, // domContentLoaded: 474.96, // timeToFirstInteractive: 621.442, // load: 1148.313 // } }) })
  17. White Is the color of milk and fresh snow, the

    color produced by the combination of all the colors of the visible spectrum. // wdio.conf.js const path = require('path') exports.config = { /** * server configurations */ hostname: '0.0.0.0', port: 4444, /** * specify test files */ specs: [ './tests/performance/pageWeight.test.js' ], /** * capabilities */ capabilities: [{ browserName: 'chrome' }], services: ['devtools'], /** * test configurations */ logLevel: 'trace', coloredLogs: true, framework: 'mocha', logDir: __dirname, reporters: ['spec'], mochaOpts: { ui: 'bdd', timeout: 60000 } } 35 // pageWeight.test.js describe('App Performance Tests', () => { before(() => { browser.url('http://saucelabs.com') }) it('Get Page Weights', () => { console.log(browser.getPageWeight()) // outputs: // { // pageWeight: 2438485, // transferred: 1139136, // requestCount: 72, // details: { // Document: { // size: 221705, // encoded: 85386, // count: 11 // }, // Stylesheet: { ... }, // Image: { ... }, // Script: { ... }, // Font: { ... }, // Other: { ... }, // XHR: { ... } // } }) })
  18. White Is the color of milk and fresh snow, the

    color produced by the combination of all the colors of the visible spectrum. // wdio.conf.js const path = require('path') exports.config = { /** * server configurations */ hostname: '0.0.0.0', port: 4444, /** * specify test files */ specs: [ './tests/performance/tracelog.test.js' ], /** * capabilities */ capabilities: [{ browserName: 'chrome' }], services: ['devtools'], /** * test configurations */ logLevel: 'trace', coloredLogs: true, framework: 'mocha', logDir: __dirname, reporters: ['spec'], mochaOpts: { ui: 'bdd', timeout: 60000 } } 36 // tracelog.test.js describe('App Performance Tests', () => { before(() => { /** * trace page */ browser.startTracing() browser.url('http://json.org') browser.endTracing() }) it('Store tracing logs as artifact', () => { fs.writeFileSync( '/path/to/tracelog.json', JSON.stringify(browser.getTraceLogs()) ) }) })