Upgrade to Pro — share decks privately, control downloads, hide ads and more …

Using concrete data for a more predictable flow of work

Using concrete data for a more predictable flow of work

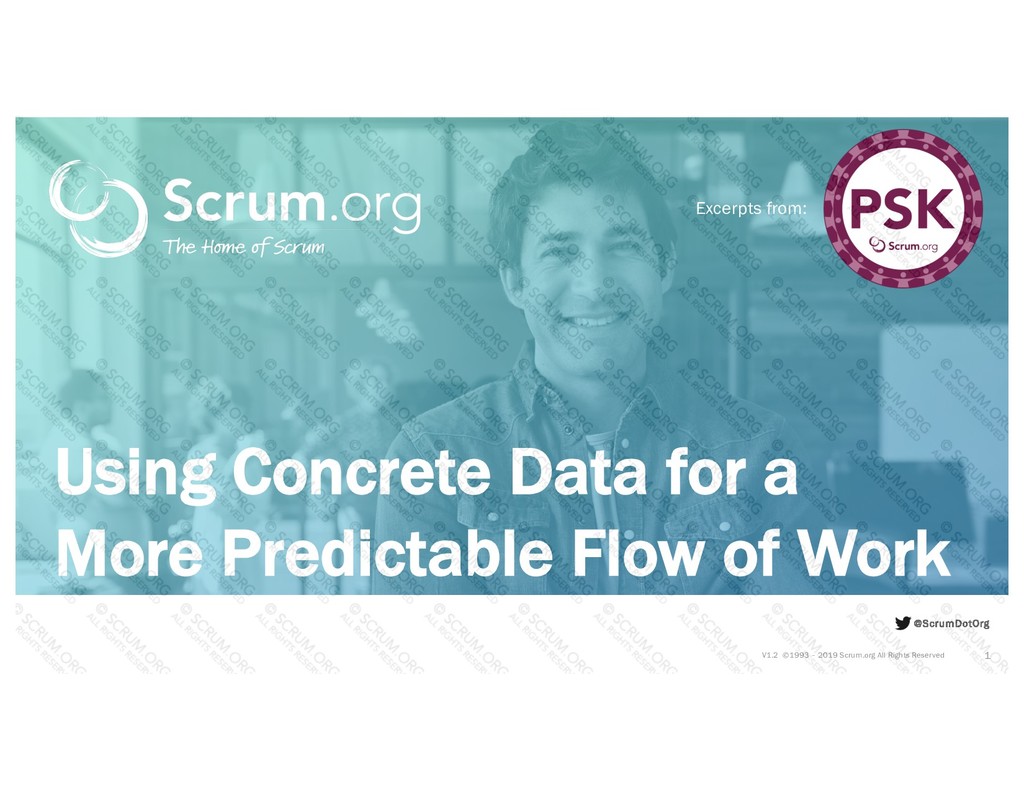
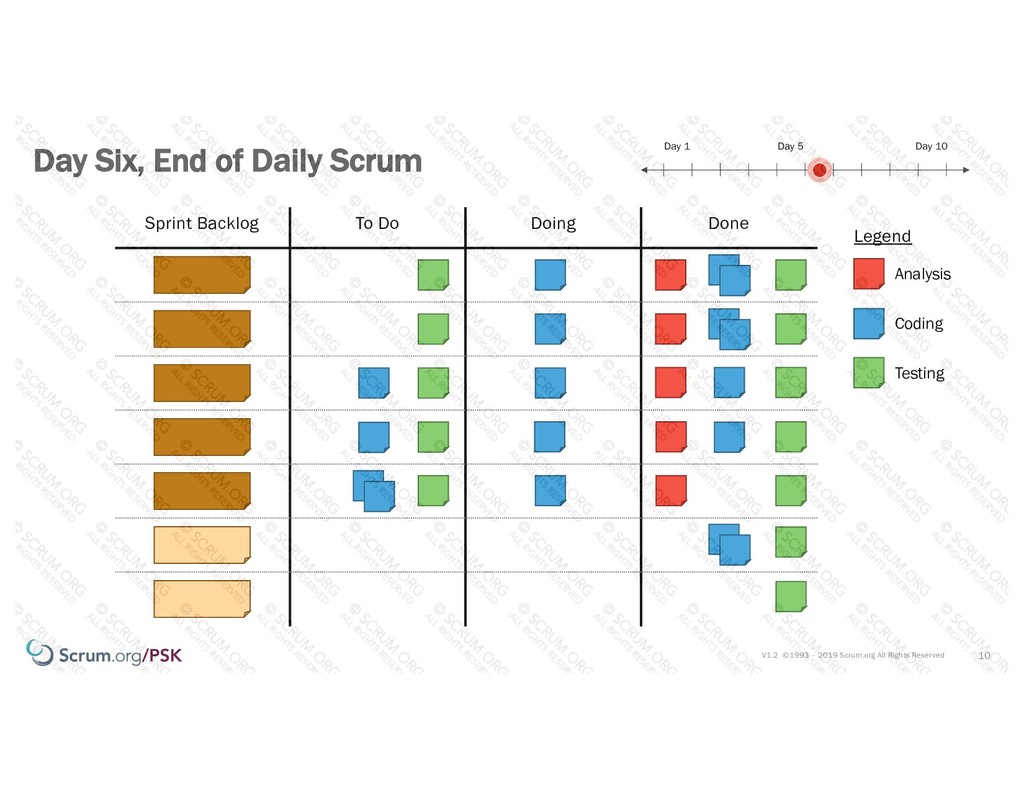
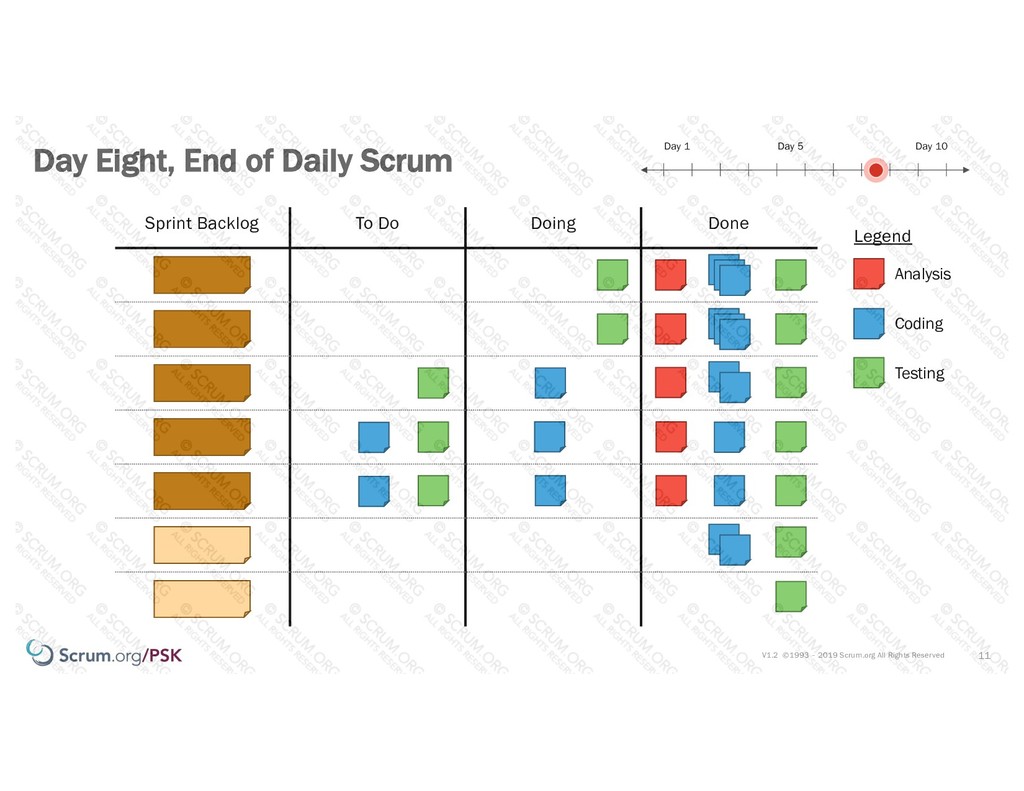
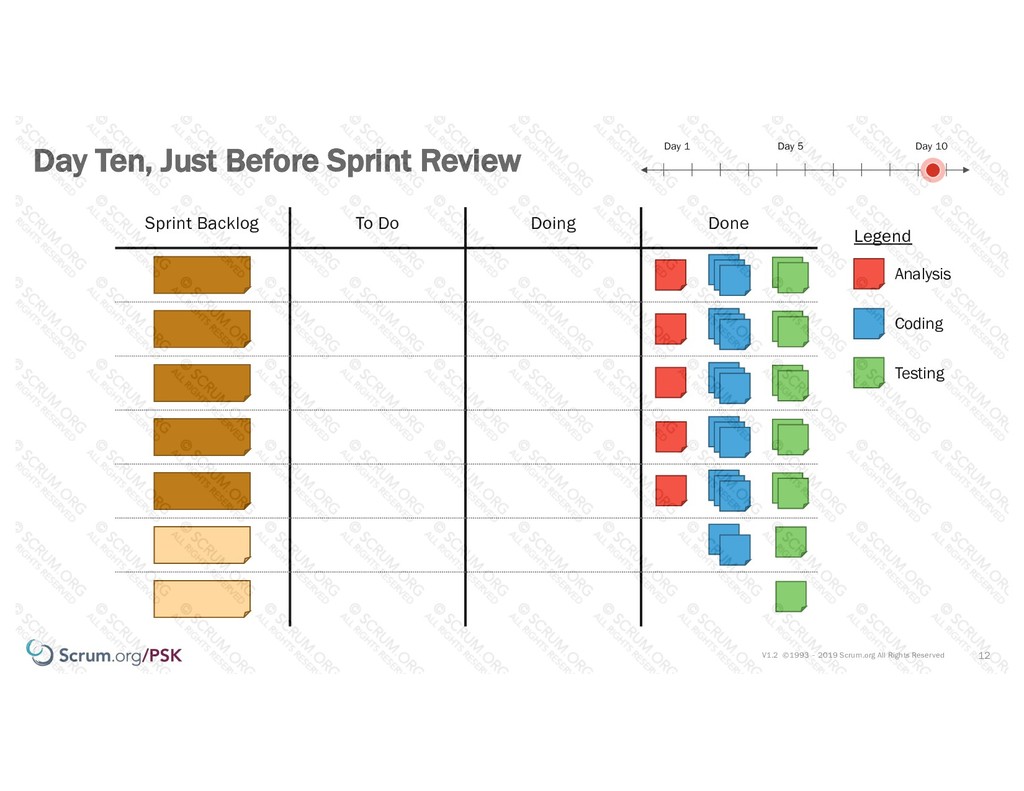
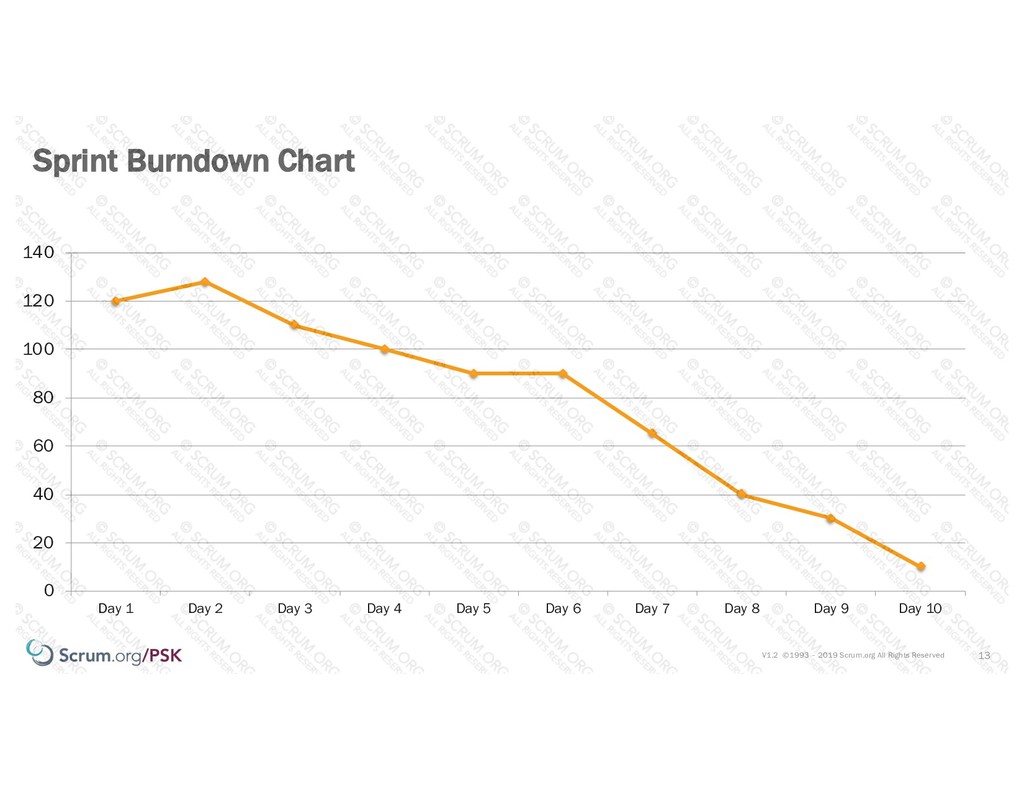
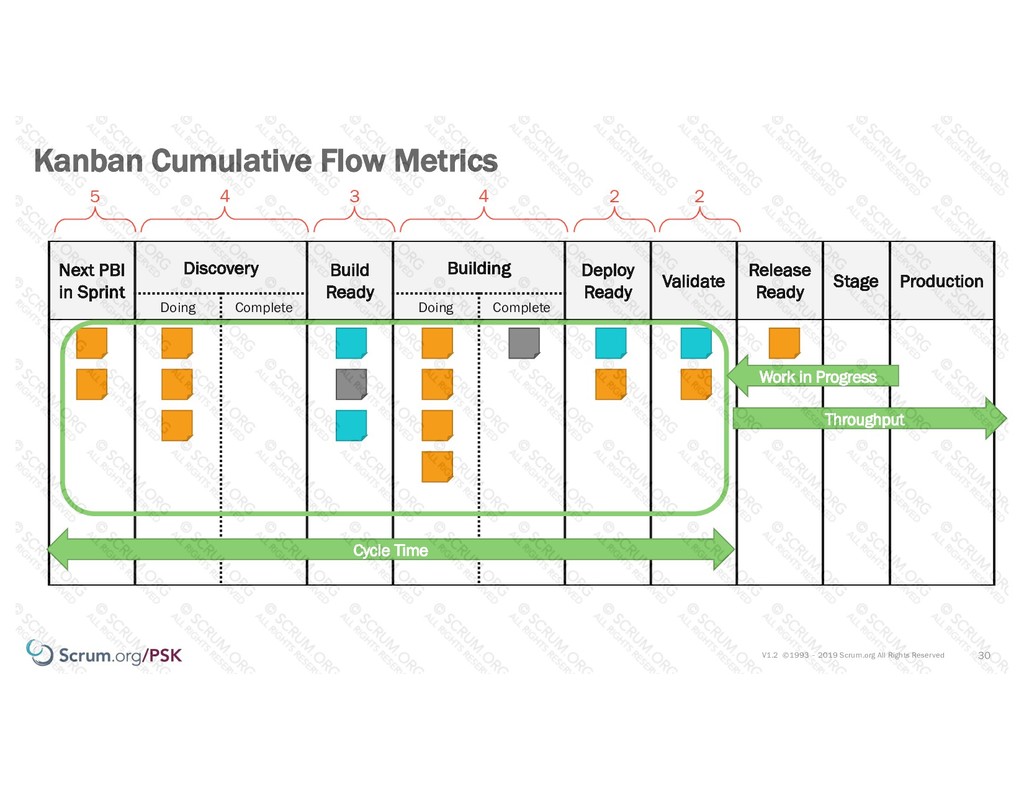
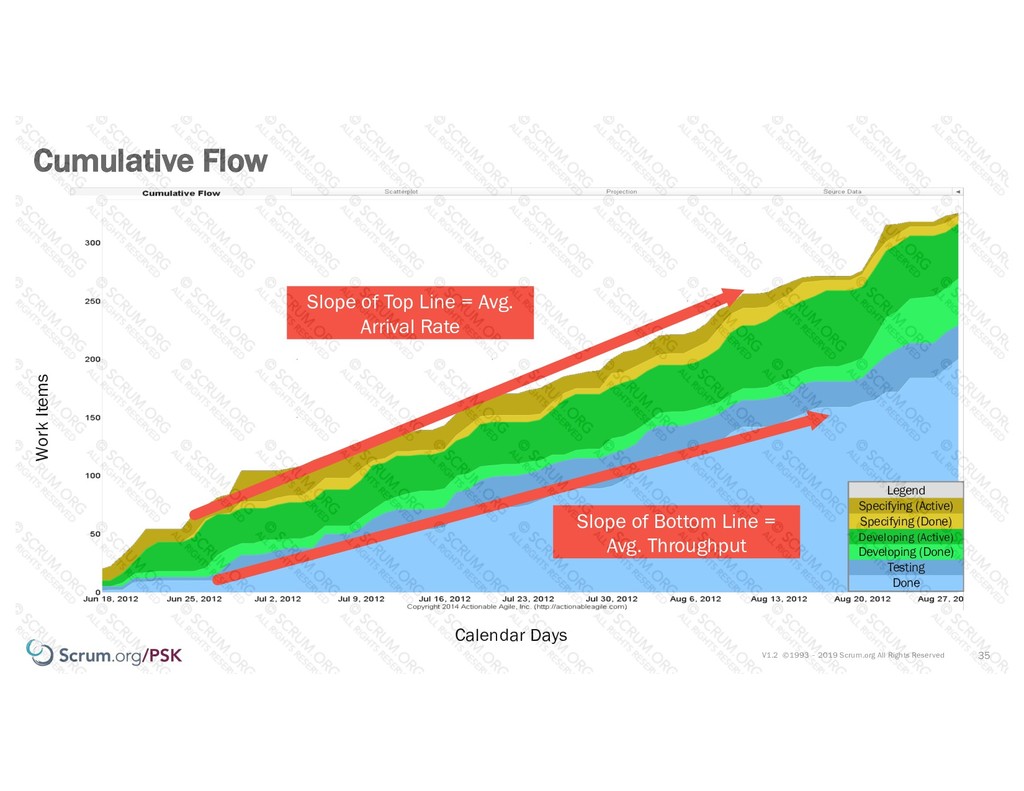
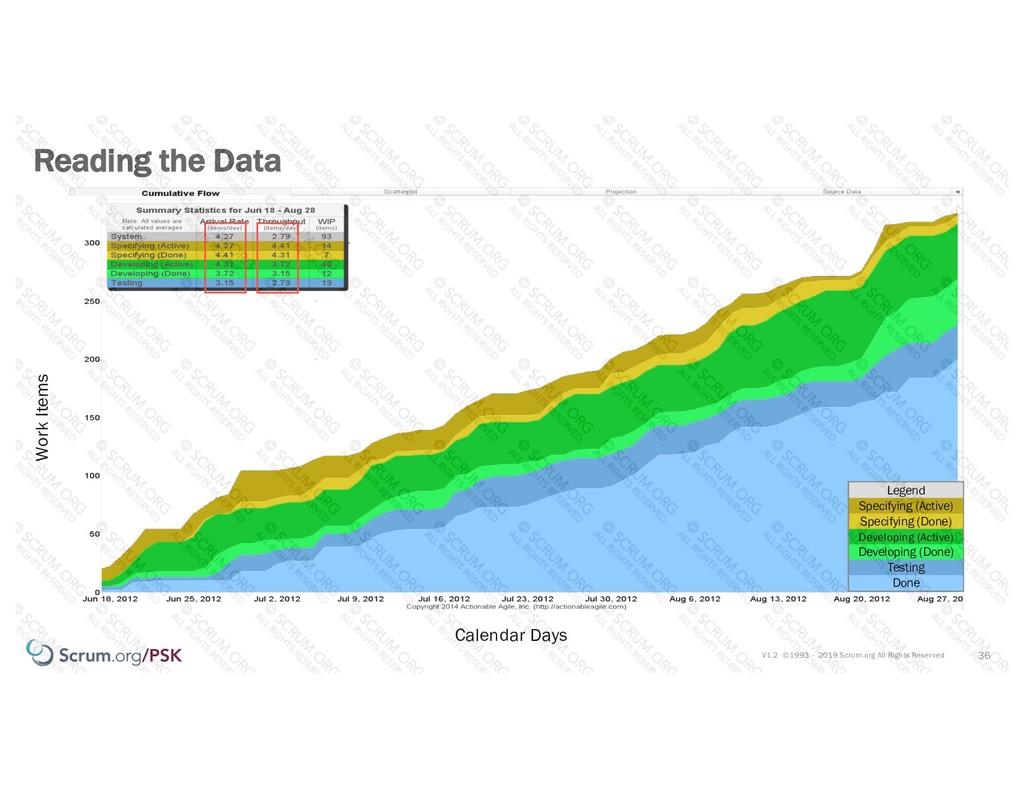
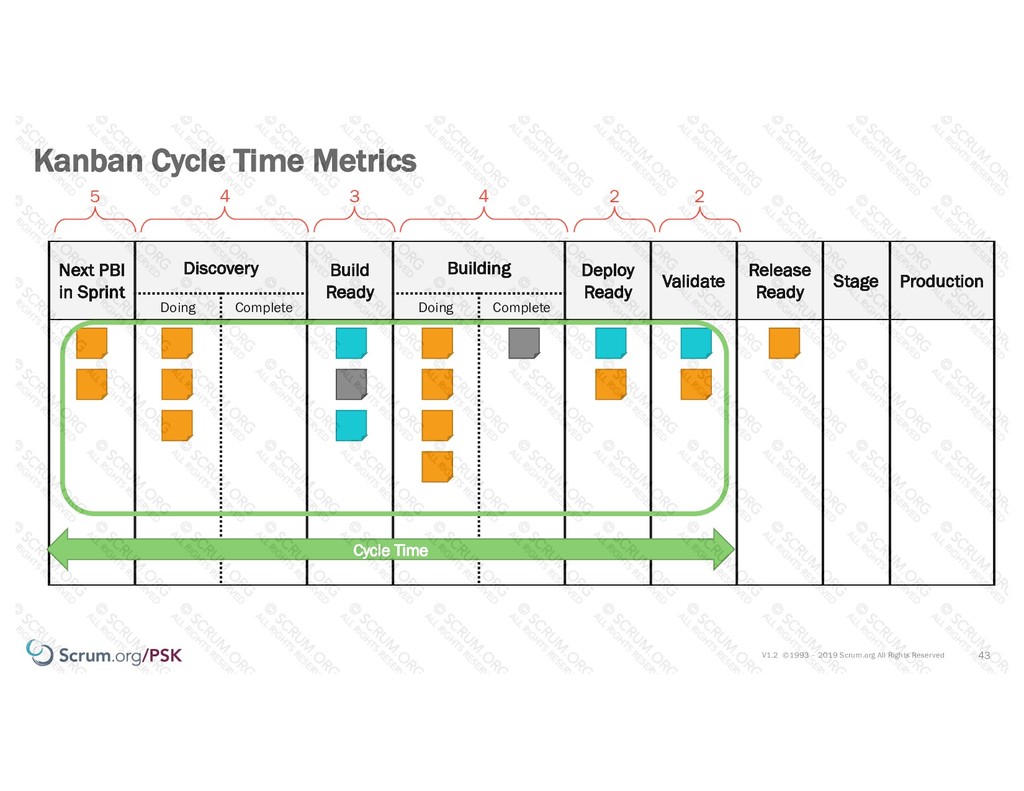
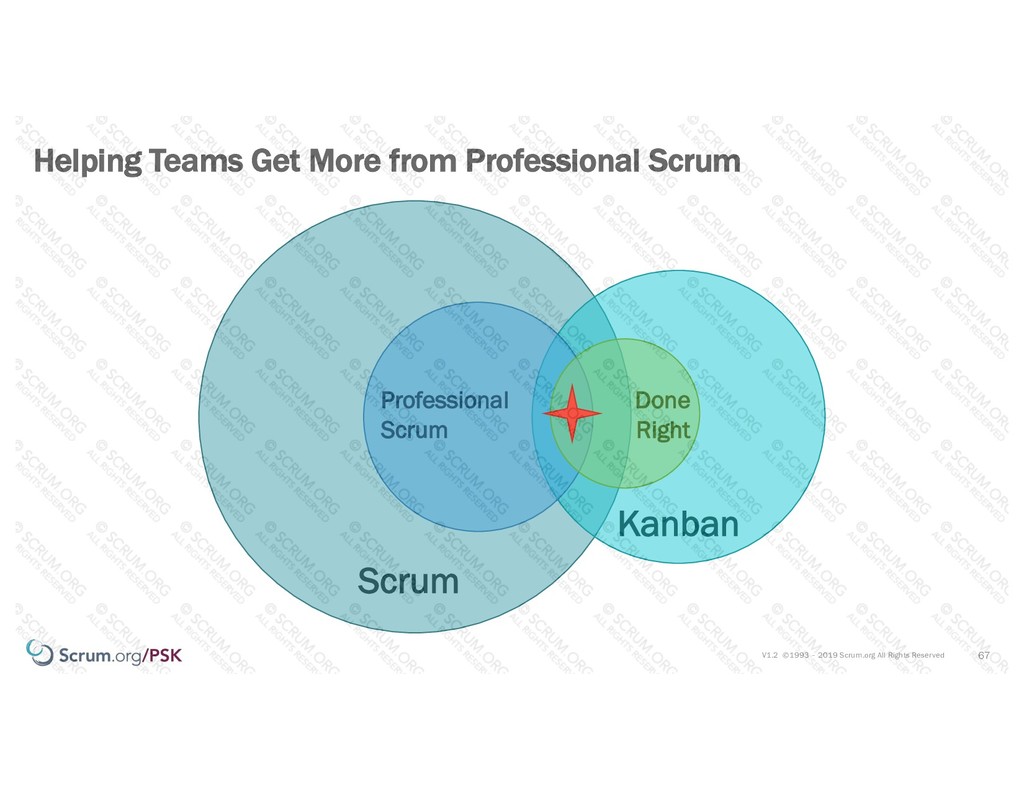
Wouldn’t it be nice if you could use an agile approach and have good data for forecasting when something was going to be done, could shorten cycle time, optimize predictability and delivery speed? I’ll bet it would!

This presentation addresses these questions by using a Kanban with Scrum approach, focusing on metrics around a flow-driven work effort for predictability. By the end of the session you’ll have a strategy for collecting and understanding data that can be applied to any of the above questions.

chuck suscheck

July 26, 2019
Tweet

More Decks by chuck suscheck

Other Decks in Technology

Transcript

  1. V1.2 ©1993 – 2019 Scrum.org All Rights Reserved Using Concrete

    Data for a More Predictable Flow of Work @ScrumDotOrg 1 Excerpts from:
  2. V1.2 ©1993 – 2019 Scrum.org All Rights Reserved This is

    me PST Developer Strategist Consultant Trainer
  3. V1.2 ©1993 – 2019 Scrum.org All Rights Reserved This is

    a Kanban board 4 Sprint Backlog To Do Doing Done
  4. V1.2 ©1993 – 2019 Scrum.org All Rights Reserved Day One,

    End of Sprint Planning 7 Sprint Backlog To Do Doing Done Analysis Coding Testing Legend Tasks Day 1 Day 10 Day 5
  5. V1.2 ©1993 – 2019 Scrum.org All Rights Reserved Day Two,

    End of Daily Scrum 8 Sprint Backlog To Do Doing Done Analysis Coding Testing Legend Day 1 Day 10 Day 5
  6. V1.2 ©1993 – 2019 Scrum.org All Rights Reserved Day Four,

    End of Daily Scrum 9 Sprint Backlog To Do Doing Done Analysis Coding Testing Legend Day 1 Day 10 Day 5
  7. V1.2 ©1993 – 2019 Scrum.org All Rights Reserved Day Six,

    End of Daily Scrum 10 Sprint Backlog To Do Doing Done Analysis Coding Testing Legend Day 1 Day 10 Day 5
  8. V1.2 ©1993 – 2019 Scrum.org All Rights Reserved Day Eight,

    End of Daily Scrum 11 Sprint Backlog To Do Doing Done Analysis Coding Testing Legend Day 1 Day 10 Day 5
  9. V1.2 ©1993 – 2019 Scrum.org All Rights Reserved Day Ten,

    Just Before Sprint Review 12 Sprint Backlog To Do Doing Done Analysis Coding Testing Legend Day 1 Day 10 Day 5
  10. V1.2 ©1993 – 2019 Scrum.org All Rights Reserved Sprint Burndown

    Chart 13 0 20 40 60 80 100 120 140 Day 1 Day 2 Day 3 Day 4 Day 5 Day 6 Day 7 Day 8 Day 9 Day 10
  11. V1.2 ©1993 – 2019 Scrum.org All Rights Reserved May Use

    Colors to Identify Types of PBIs (optional) 17 Type 1 Type 2 Type 3 Legend
  12. V1.2 ©1993 – 2019 Scrum.org All Rights Reserved Input Queue

    Analysis Dev Ready Development Deploy Ready Test Release Ready In Progress Done In Progress Done 18 Add a workflow Type 1 Type 2 Type 3 Legend
  13. V1.2 ©1993 – 2019 Scrum.org All Rights Reserved Identify workflow

    items 19 Next PBI in Sprint Discovery Build Ready Building Deploy Ready Validate Release Ready Doing Complete Doing Complete Type 1 Type 2 Type 3 Legend
  14. V1.2 ©1993 – 2019 Scrum.org All Rights Reserved Add WIP

    20 Next PBI in Sprint Discovery Build Ready Building Deploy Ready Validate Release Ready Doing Complete Doing Complete Type 1 Type 2 Type 3 Legend 5 4 3 4 2 2 Flow
  15. V1.2 ©1993 – 2019 Scrum.org All Rights Reserved Next PBI

    in Sprint Discovery Build Ready Building Deploy Ready Validate Release Ready Stage Production Doing Complete Doing Complete Kanban Tracks 4 Metrics 21 5 4 3 4 2 2 Cycle Time Throughput Work in Progress Work item Age SLE – 85% of work items will be finished in eight days or less
  16. V1.2 ©1993 – 2019 Scrum.org All Rights Reserved 1.Defining and

    visualizing the “Workflow” 2.Limiting work-in-progress (WIP) 3.Actively managing the items in progress 4.Inspecting and adapting your “Workflow” 22 Kanban for Scrum Teams – Summary
  17. V1.2 ©1993 – 2019 Scrum.org All Rights Reserved Start With

    the Work 23 Everything To Do WIP Done To Do A Done B C D
  18. V1.2 ©1993 – 2019 Scrum.org All Rights Reserved Starting here

    24 Sprint Backlog To Do Doing Done Analysis Coding Testing Legend
  19. V1.2 ©1993 – 2019 Scrum.org All Rights Reserved Identify the

    Value Stream 25 To Do A Done B C D Sprint Backlog A B C D Done
  20. V1.2 ©1993 – 2019 Scrum.org All Rights Reserved Now we

    are ready for Kanban! 26 Next PBI in Sprint Discovery Build Ready Building Deploy Ready Validate Release Ready Doing Complete Doing Complete Type 1 Type 2 Type 3 Legend 5 4 3 4 2 2
  21. V1.2 ©1993 – 2019 Scrum.org All Rights Reserved WIP needs

    to be set low enough to have an impact 1.5 – 2 items per person to start? You shouldn’t name your columns after roles Can’t pull? Work elsewhere (even at a lower productivity) WIP is trigger to pull 27 Some rules of thumb
  22. V1.2 ©1993 – 2019 Scrum.org All Rights Reserved • Cumulative

    Flow Diagram (CFD) • Cycle Time Scatterplot • Work Item Aging Chart • SLE • Throughput Run Chart • Throughput Monte Carlo 28 Using Lean/Flow Metrics/Charts we will go over
  23. V1.2 ©1993 – 2019 Scrum.org All Rights Reserved Next PBI

    in Sprint Discovery Build Ready Building Deploy Ready Validate Release Ready Stage Production Doing Complete Doing Complete Kanban Cumulative Flow Metrics 30 5 4 3 4 2 2 Cycle Time Throughput Work in Progress
  24. V1.2 ©1993 – 2019 Scrum.org All Rights Reserved Cumulative Flow

    31 Work Items Calendar Days Done Testing Developing (Done) Developing (Active) Specifying (Done) Specifying (Active) Legend Calendar Time Cumulative Work Item Count Process States
  25. V1.2 ©1993 – 2019 Scrum.org All Rights Reserved Cumulative Flow

    32 Work Items Calendar Days Done Testing Developing (Done) Developing (Active) Specifying (Done) Specifying (Active) Legend Total Work in Progress (WIP)
  26. V1.2 ©1993 – 2019 Scrum.org All Rights Reserved Cumulative Flow

    33 Work Items Calendar Days Approximate Average Cycle Time Done Testing Developing (Done) Developing (Active) Specifying (Done) Specifying (Active) Legend
  27. V1.2 ©1993 – 2019 Scrum.org All Rights Reserved Reading the

    Data 34 Calendar Days Done Testing Developing (Done) Developing (Active) Specifying (Done) Specifying (Active) Legend Work Items
  28. V1.2 ©1993 – 2019 Scrum.org All Rights Reserved Cumulative Flow

    35 Work Items Calendar Days Done Testing Developing (Done) Developing (Active) Specifying (Done) Specifying (Active) Legend Slope of Top Line = Avg. Arrival Rate Slope of Bottom Line = Avg. Throughput
  29. V1.2 ©1993 – 2019 Scrum.org All Rights Reserved Reading the

    Data 36 Calendar Days Done Testing Developing (Done) Developing (Active) Specifying (Done) Specifying (Active) Legend Work Items
  30. V1.2 ©1993 – 2019 Scrum.org All Rights Reserved Analyze the

    Data 37 What’s going on? Is this good? Why?
  31. V1.2 ©1993 – 2019 Scrum.org All Rights Reserved Analyze the

    Data 38 What’s going on? Is this good? Why?
  32. V1.2 ©1993 – 2019 Scrum.org All Rights Reserved Little’s Law

    of Queuing Theory 39 Average Cycle Time = Average Work in Progress Average Throughput Where: Cycle Time = how long it takes one item to go through the process Work in Progress = how many items are in the process at any time Throughput = how many items are produced per unit of time John Little - Little’s Law Image:https://en.wikipedia.org/wiki/Little%27s_law
  33. V1.2 ©1993 – 2019 Scrum.org All Rights Reserved CFD: Cycle

    Time, WIP, and Throughput 40 Time Cumulative Quantity Average Completion Rate (Throughput) Average Arrival Rate WIP Approx. Avg. Cycle Time Avg. Cycle Time = Avg. Work in Progress Avg. Throughput
  34. V1.2 ©1993 – 2019 Scrum.org All Rights Reserved CFD: Cycle

    Time, WIP, and Throughput 41 Time Cumulative Quantity Average Arrival Rate WIP Approx. Avg. Cycle Time Average Completion Rate (Throughput) Avg. Cycle Time = Avg. Work in Progress Avg. Throughput
  35. V1.2 ©1993 – 2019 Scrum.org All Rights Reserved Cycle Time

    Scatter Plot 42 Purpose: visualize forecasts
  36. V1.2 ©1993 – 2019 Scrum.org All Rights Reserved Next PBI

    in Sprint Discovery Build Ready Building Deploy Ready Validate Release Ready Stage Production Doing Complete Doing Complete Kanban Cycle Time Metrics 43 5 4 3 4 2 2 Cycle Time
  37. V1.2 ©1993 – 2019 Scrum.org All Rights Reserved Cycle Time

    Scatterplot Chart 44 Cycle Time (Days) Completion Date 44 Calendar time – X axis marks when a specific item was completed Y axis marks Elapsed Time for a specific item
  38. V1.2 ©1993 – 2019 Scrum.org All Rights Reserved Cycle Time

    Scatterplot Chart 45 Cycle Time (Days) Completion Date
  39. V1.2 ©1993 – 2019 Scrum.org All Rights Reserved Cycle Time

    Scatterplot Chart 46 Cycle Time (Days) Completion Date
  40. V1.2 ©1993 – 2019 Scrum.org All Rights Reserved Cycle Time

    Scatterplot Chart 47 Cycle Time (Days) Completion Date
  41. V1.2 ©1993 – 2019 Scrum.org All Rights Reserved Cycle Time

    Scatterplot Chart 48 Cycle Time (Days) Completion Date This chart is called a Cycle Time Scatterplot
  42. V1.2 ©1993 – 2019 Scrum.org All Rights Reserved Cycle Time

    Scatterplot Chart 49 Cycle Time (Days) Completion Date How do we make sense of this “randomness”?
  43. V1.2 ©1993 – 2019 Scrum.org All Rights Reserved Cycle Time

    Scatterplot Chart – Confidence levels 50 Completion Date 7 50% 16 85% 20 95% Cycle Time (Days)
  44. V1.2 ©1993 – 2019 Scrum.org All Rights Reserved Service Level

    Agreement (SLE) 51 Purpose: visualize schedule risks
  45. V1.2 ©1993 – 2019 Scrum.org All Rights Reserved Next PBI

    in Sprint Discovery Build Ready Building Deploy Ready Validate Release Ready Stage Production Doing Complete Doing Complete Kanban SLE Metrics 52 5 4 3 4 2 2 Cycle Time SLE – 85% of work items will be finished in eight days or less
  46. V1.2 ©1993 – 2019 Scrum.org All Rights Reserved Cycle Time

    Scatterplot Chart – Confidence levels 53 Completion Date 50% Confidence = 7 Days or Less 7 50% 16 85% 95% Confidence = 20 Days or Less 20 95% Cycle Time (Days) 85% Confidence = 16 Days or Less
  47. V1.2 ©1993 – 2019 Scrum.org All Rights Reserved Analyze the

    Data 54 Cycle Time (Days) Calendar Days Anything interesting here?
  48. V1.2 ©1993 – 2019 Scrum.org All Rights Reserved Work Item

    Aging Chart 57 Purpose: Visualizing items in process
  49. V1.2 ©1993 – 2019 Scrum.org All Rights Reserved Next PBI

    in Sprint Discovery Build Ready Building Deploy Ready Validate Release Ready Stage Production Doing Complete Doing Complete Kanban Work Item Age Metrics 58 5 4 3 4 2 2 Work item Age
  50. V1.2 ©1993 – 2019 Scrum.org All Rights Reserved Work Item

    Aging Chart 59 Age (Days) Analysis Active Analysis Done Dev Active Dev Done Testing Done https://analytics.actionableagile.com/ Cycle Time (Days) Cycle Time Scatterplot Chart Work Item Aging Chart =
  51. V1.2 ©1993 – 2019 Scrum.org All Rights Reserved Work Item

    Aging Chart 60 Age (Days) Analysis Active Analysis Done Dev Active Dev Done Testing Done https://analytics.actionableagile.com/ CFD Work Item Aging Chart WIP
  52. V1.2 ©1993 – 2019 Scrum.org All Rights Reserved Work Item

    Aging Chart 61 Age (Days) 30% 70% 85% 50% Analysis Active Analysis Done Dev Active Dev Done Testing Done https://analytics.actionableagile.com/ 4 10 15 7 SLAs Stages
  53. V1.2 ©1993 – 2019 Scrum.org All Rights Reserved Work Item

    Aging Chart 62 Age (Days) https://analytics.actionableagile.com/ Likely not happening Looking good At risk Analysis Active Analysis Done Dev Active Dev Done Testing Done
  54. V1.2 ©1993 – 2019 Scrum.org All Rights Reserved Kanban –

    Inside and outside the Sprint… 64 Downstream Upstream
  55. V1.2 ©1993 – 2019 Scrum.org All Rights Reserved 65 Some

    powerful Lean/Flow Metrics/Charts Chart Sprint Planning Daily Scrum Sprint Review Sprint Retrospective Cumulative Flow Diagram (CFD) Cycle Time Scatterplot Work Item Aging Chart SLE Throughput Monte Carlo Throughput Run Chart
  56. V1.2 ©1993 – 2019 Scrum.org All Rights Reserved 66 Some

    powerful Lean/Flow Metrics/Charts Chart Sprint Planning Daily Scrum Sprint Review Sprint Retrospective Cumulative Flow Diagram (CFD) Also Key Cycle Time Scatterplot Also Key Work Item Aging Chart Key Also SLE Key Key Also Throughput Monte Carlo Key Key Throughput Run Chart Key Key Key
  57. V1.2 ©1993 – 2019 Scrum.org All Rights Reserved 67 Helping

    Teams Get More from Professional Scrum Scrum Kanban Professional Scrum Done Right
  58. V1.2 ©1993 – 2019 Scrum.org All Rights Reserved 68 Suggested

    Reading “Actionable Agile Metrics for Predictability” (Daniel S. Vacanti) “Practical Kanban” (Klaus Leopold) • THE KANBAN GUIDE FOR SCRUM TEAMS The Kanban Guide for Scrum Teams February 2018 Developed and sustained by Scrum.org and Daniel Vacaniti [email protected]
  59. V1.2 ©1993 – 2019 Scrum.org All Rights Reserved MAX Technical

    Training delivers a wide variety of customized education solutions in Scrum as well as Scrum.Org certification training and consulting. w w w. m a x t r a i n . c o m | 51 3 - 3 2 2 - 8 8 8 8
  60. V1.2 ©1993 – 2019 Scrum.org All Rights Reserved Using Concrete

    Data for a More Predictable Flow of Work @ScrumDotOrg 72 Excerpts from:
  61. V1.2 ©1993 – 2019 Scrum.org All Rights Reserved CFD Worksheet

    74 0 2 4 6 8 10 12 14 16 18 20 22 24 26 28 30 0 1 2 3 4 5 6 7 8 9 10 Legend Next Dot Discovery X Building Star Deploy Ready Circle Validate Box Done +
  62. V1.2 ©1993 – 2019 Scrum.org All Rights Reserved Day 1

    75 Next PBI in Sprint Discovery Build Ready Building Deploy Ready Validate Release Ready (done) Doing Complete Doing Complete 5 4 3 4 2 2 Day 1 Day 10 Day 5 WIP 4 3 3 4 2 2 1
  63. V1.2 ©1993 – 2019 Scrum.org All Rights Reserved Day 2

    76 Next PBI in Sprint Discovery Build Ready Building Deploy Ready Validate Release Ready (done) Doing Complete Doing Complete 5 4 3 4 2 2 Day 1 Day 10 Day 5 WIP 4 4 3 4 2 1 2
  64. V1.2 ©1993 – 2019 Scrum.org All Rights Reserved Day 3

    77 Next PBI in Sprint Discovery Build Ready Building Deploy Ready Validate Release Ready (done) Doing Complete Doing Complete 5 4 3 4 2 2 Day 1 Day 10 Day 5 WIP 4 4 3 4 0 2 3
  65. V1.2 ©1993 – 2019 Scrum.org All Rights Reserved Day 4

    78 Next PBI in Sprint Discovery Build Ready Building Deploy Ready Validate Release Ready (done) Doing Complete Doing Complete 5 6 4 6 2 2 Day 1 Day 10 Day 5 WIP 4 4 3 4 0 0 5
  66. V1.2 ©1993 – 2019 Scrum.org All Rights Reserved Day 5

    79 Next PBI in Sprint Discovery Build Ready Building Deploy Ready Validate Release Ready (done) Doing Complete Doing Complete 5 6 4 6 2 2 Day 1 Day 10 Day 5 WIP 5 6 4 6 0 0 5
  67. V1.2 ©1993 – 2019 Scrum.org All Rights Reserved Day 6

    80 Next PBI in Sprint Discovery Build Ready Building Deploy Ready Validate Release Ready (done) Doing Complete Doing Complete 5 6 4 6 2 2 Day 1 Day 10 Day 5 WIP 6 6 3 6 2 2 5
  68. V1.2 ©1993 – 2019 Scrum.org All Rights Reserved Day 7

    81 Next PBI in Sprint Discovery Build Ready Building Deploy Ready Validate Release Ready (done) Doing Complete Doing Complete 5 6 4 6 2 2 Day 1 Day 10 Day 5 WIP 5 6 3 6 2 2 6
  69. V1.2 ©1993 – 2019 Scrum.org All Rights Reserved Day 8

    82 Next PBI in Sprint Discovery Build Ready Building Deploy Ready Validate Release Ready (done) Doing Complete Doing Complete 5 4 4 4 2 2 Day 1 Day 10 Day 5 WIP 5 5 4 4 2 2 8
  70. V1.2 ©1993 – 2019 Scrum.org All Rights Reserved Day 9

    83 Next PBI in Sprint Discovery Build Ready Building Deploy Ready Validate Release Ready (done) Doing Complete Doing Complete 5 4 4 4 2 2 Day 1 Day 10 Day 5 WIP 5 5 4 4 2 2 8
  71. V1.2 ©1993 – 2019 Scrum.org All Rights Reserved Day 10

    84 Next PBI in Sprint Discovery Build Ready Building Deploy Ready Validate Release Ready (done) Doing Complete Doing Complete 5 4 4 4 2 2 Day 1 Day 10 Day 5 WIP 5 4 3 3 2 1 12
  72. V1.2 ©1993 – 2019 Scrum.org All Rights Reserved minutes Case

    Study Exercise 85 CFD vs Burndown 5 What’s the difference? Pros and cons of each? Day 1 Day 2 Day 3 Day 4 Day 5 Day 6 Day 7 Day 8 Day 9 Day 10
  73. V1.2 ©1993 – 2019 Scrum.org All Rights Reserved 86 Improve

    your Sprint Forecast with Monte Carlo simulations