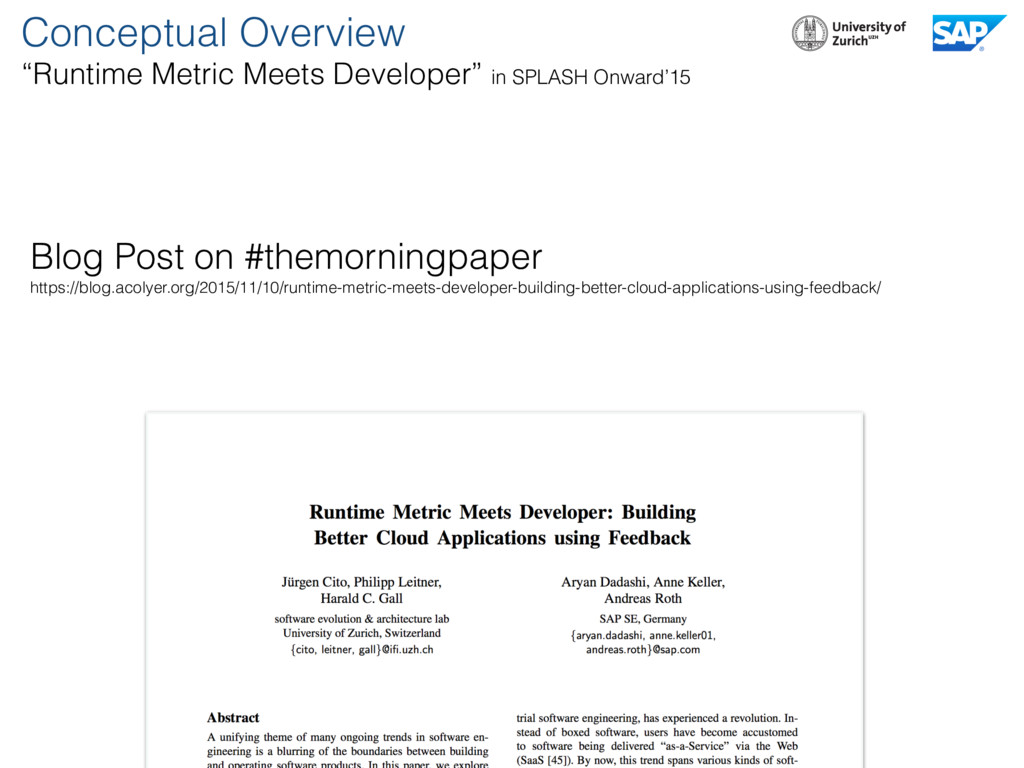
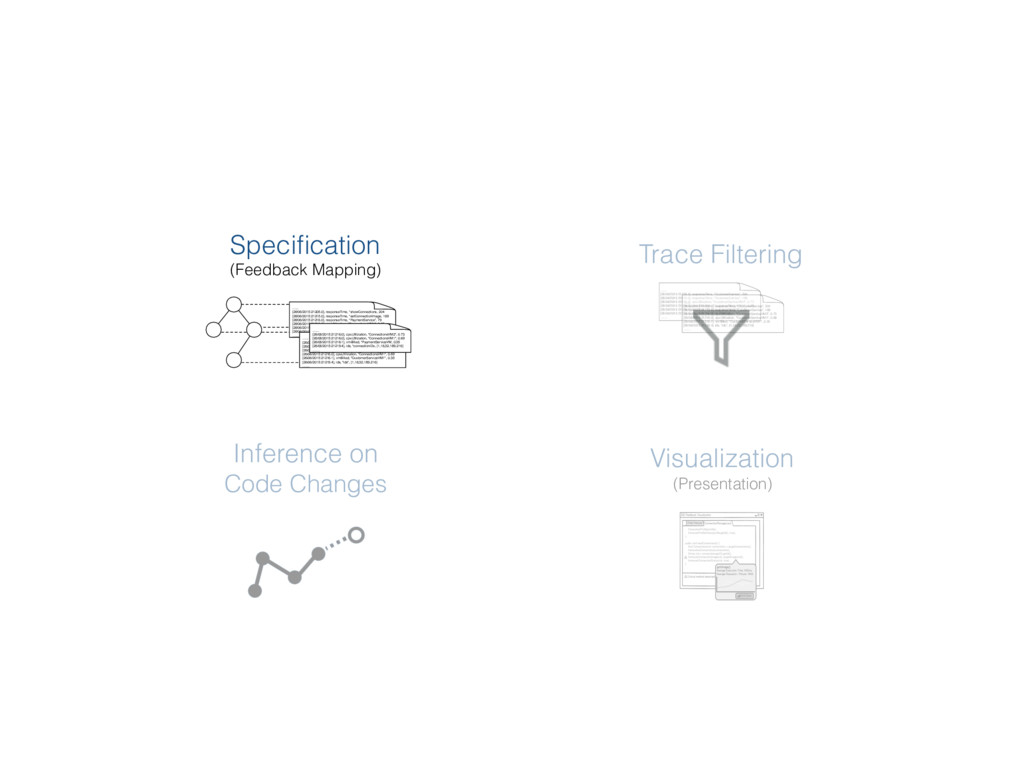
Runtime Metric Annotated AST Performance Augmented Source Code ? Prediction through Impact Analysis ....... [26/06/2015:21205.0], responseTime, “showConnections, 204 [26/06/2015:21215.0], responseTime, “setConnectionImage, 169 [26/06/2015:21216.0], responseTime, “PaymentService”, 79 [26/06/2015:21216.0], cpuUtilization, “ConnectionsVM1", 0.69 [26/06/2015:21216.1], vmBilled, "CustomerServiceVM1", 0.35 [26/06/2015:21219.4], ids, "ids", [1,16,32,189,216] ........ ....... [26/06/2015:21205.0], responseTime, “showConnections, 204 [26/06/2015:21215.0], responseTime, “setConnectionImage, 169 [26/06/2015:21216.0], responseTime, “PaymentService”, 79 [26/06/2015:21216.0], cpuUtilization, “ConnectionsVM1", 0.69 [26/06/2015:21216.1], vmBilled, "CustomerServiceVM1", 0.35 [26/06/2015:21219.4], ids, "ids", [1,16,32,189,216] ........ ....... [26/06/2015:21216.0], cpuUtilization, “ConnectionsVM2", 0.73 [26/06/2015:21216.0], cpuUtilization, “ConnectionsVM1", 0.69 [26/06/2015:21216.1], vmBilled, “PaymentServiceVM, 0.35 [26/06/2015:21219.4], ids, “connectionIDs, [1,16,32,189,216] ........ Specification (Feedback Mapping) Trace Filtering ....... [26/06/2015:21205.0], responseTime, "CustomerService", 204 [26/06/2015:21215.0], responseTime, "CustomerService", 169 [26/06/2015:21216.0], cpuUtilization, "CustomerServiceVM2", 0.73 [26/06/2015:21216.0], cpuUtilization, "CustomerServiceVM1", 0.69 [26/06/2015:21216.1], vmBilled, "CustomerServiceVM1", 0.35 [26/06/2015:21219.4], ids, "ids", [1,16,32,189,216] ........ ....... [26/06/2015:21205.0], responseTime, "CustomerService", 204 [26/06/2015:21215.0], responseTime, "CustomerService", 169 [26/06/2015:21216.0], cpuUtilization, "CustomerServiceVM2", 0.73 [26/06/2015:21216.0], cpuUtilization, "CustomerServiceVM1", 0.69 [26/06/2015:21216.1], vmBilled, "CustomerServiceVM1", 0.35 [26/06/2015:21219.4], ids, "ids", [1,16,32,189,216] ........ Inference on Code Changes Visualization (Presentation) Abstract Syntax Tree (AST) IDE Distributed Runtime Traces Feedback Mapping Runtime Metric Annotated AST Performance Augmented Source Code ? Prediction through Impact Analysis ....... [26/06/2015:21205.0], responseTime, “showConnections, 204 [26/06/2015:21215.0], responseTime, “setConnectionImage, 169 [26/06/2015:21216.0], responseTime, “PaymentService”, 79 [26/06/2015:21216.0], cpuUtilization, “ConnectionsVM1", 0.69 [26/06/2015:21216.1], vmBilled, "CustomerServiceVM1", 0.35 [26/06/2015:21219.4], ids, "ids", [1,16,32,189,216] ........ ....... [26/06/2015:21205.0], responseTime, “showConnections, 204 [26/06/2015:21215.0], responseTime, “setConnectionImage, 169 [26/06/2015:21216.0], responseTime, “PaymentService”, 79 [26/06/2015:21216.0], cpuUtilization, “ConnectionsVM1", 0.69 [26/06/2015:21216.1], vmBilled, "CustomerServiceVM1", 0.35 [26/06/2015:21219.4], ids, "ids", [1,16,32,189,216] ........ ....... [26/06/2015:21216.0], cpuUtilization, “ConnectionsVM2", 0.73 [26/06/2015:21216.0], cpuUtilization, “ConnectionsVM1", 0.69 [26/06/2015:21216.1], vmBilled, “PaymentServiceVM, 0.35 [26/06/2015:21219.4], ids, “connectionIDs, [1,16,32,189,216] ........ Abstract Theoretical Framework “Runtime Metric Meets Developer” in SPLASH Onward’15
![Code Artifacts Deployment ....... [26/06/2015:21205.0], responseTime, "CustomerService", 204 [26/06/2015:21215.0], responseTime,](https://files.speakerdeck.com/presentations/3abc6524b2cd49f9823edf3c41bec588/slide_3.jpg)
![Code Artifacts Deployment ....... [26/06/2015:21205.0], responseTime, "CustomerService", 204 [26/06/2015:21215.0], responseTime,](https://files.speakerdeck.com/presentations/3abc6524b2cd49f9823edf3c41bec588/slide_6.jpg)
![readConnections connections getConnections getImage setConnectionImage setConnectionStatus ....... [26/06/2015:21205.0], responseTime, “showConnections,](https://files.speakerdeck.com/presentations/3abc6524b2cd49f9823edf3c41bec588/slide_24.jpg)
![Distributed Runtime Traces ....... [26/06/2015:21205.0], responseTime, “showConnections, 204 [26/06/2015:21215.0], responseTime,](https://files.speakerdeck.com/presentations/3abc6524b2cd49f9823edf3c41bec588/slide_25.jpg)
![Distributed Runtime Traces ....... [26/06/2015:21205.0], responseTime, “showConnections, 204 [26/06/2015:21215.0], responseTime,](https://files.speakerdeck.com/presentations/3abc6524b2cd49f9823edf3c41bec588/slide_27.jpg)
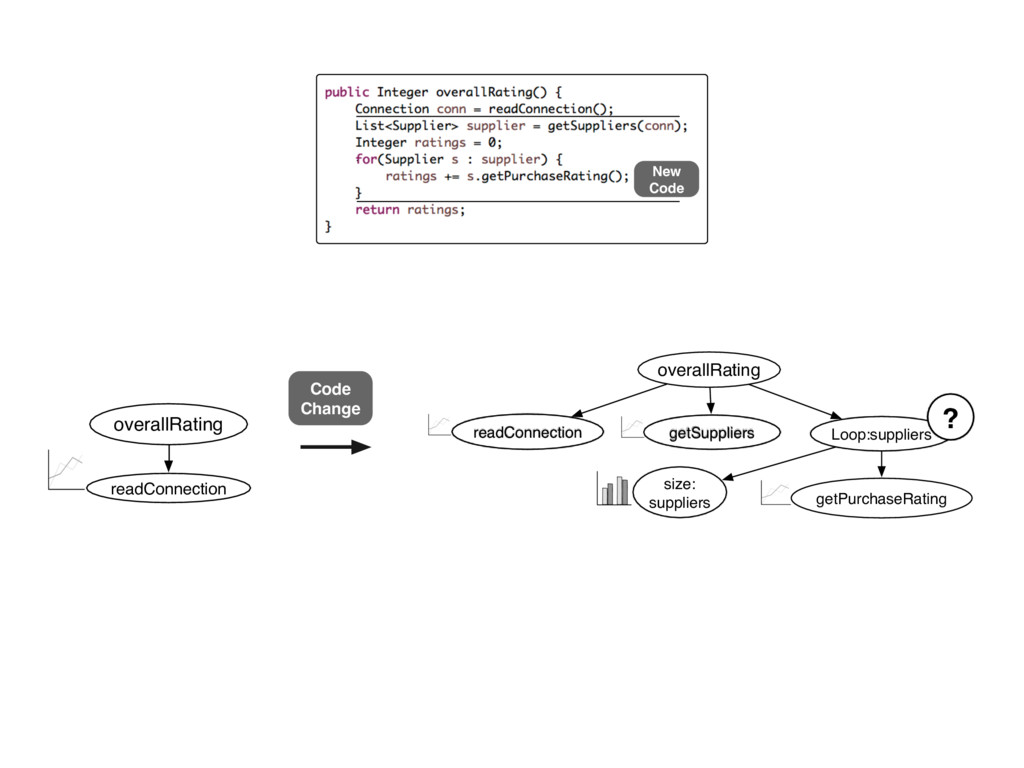
![overallRating readConnection size: suppliers getSuppliers Loop:suppliers getPurchaseRating [Statistical Inference] New](https://files.speakerdeck.com/presentations/3abc6524b2cd49f9823edf3c41bec588/slide_29.jpg)
![Distributed Runtime Traces ....... [26/06/2015:21205.0], responseTime, “showConnections, 204 [26/06/2015:21215.0], responseTime,](https://files.speakerdeck.com/presentations/3abc6524b2cd49f9823edf3c41bec588/slide_30.jpg)