Upgrade to Pro — share decks privately, control downloads, hide ads and more …

[DevOpsCon] Developer Targeted Performance Analytics

[DevOpsCon] Developer Targeted Performance Analytics

Slides on the session on "Developer Targeted Performance Analytics" at DevOpsCon'17 in Berlin, Germany

Jürgen Cito

June 14, 2017
Tweet

More Decks by Jürgen Cito

Other Decks in Programming

Transcript

  1. Developer Targeted Performance Analytics Supporting Software Development Decisions with Runtime

    Information Jürgen Cito 
 DevOpsCon’17, Berlin, Germany Source: https://flic.kr/p/bXf4vw @citostyle Source: https://flic.kr/p/ebdWmN by David
  2. 2 Distributed Architectures Multiple Technologies Infrastructure at Scale Scattered Information

    Figure taken from Chen et al. A provider-side viewof web search response time. 2013. Monitoring & Analysis of Complex (Cloud) Systems
  3. Code Artifacts Deployment ....... [26/06/2015:21205.0], responseTime, "CustomerService", 204 [26/06/2015:21215.0], responseTime,

    "CustomerService", 169 [26/06/2015:21216.0], cpuUtilization, "CustomerServiceVM2", 0.73 [26/06/2015:21216.0], cpuUtilization, "CustomerServiceVM1", 0.69 [26/06/2015:21216.1], vmBilled, "CustomerServiceVM1", 0.35 [26/06/2015:21219.4], ids, "ids", [1,16,32,189,216] ........ Operations Data observe Context Cloud Infrastructure VM1 VM2 Supplier Service User Interface Purch S
  4. Scenario
 (Check-List) Change… …passes functional tests …passes non-functional (performance) tests

    …goes through Continuous Integration …gets deployed in production …leads to severe performance degradation
  5. Scenario
 (What was the Problem?) > Login method for 1

    users/team included a service call 
 to 3rd party provider to load profile pictures
 
 > Login was not able to scale gracefully to multiple teams > Tests failed to simulate the situation
  6. Problem & Conjecture Data combinatorics of configuration in production environments

    are different to what profilers and tests can simulate either locally or in staging environments. Especially in the cloud, scalable infrastructure requires approaches to leverage information gathered at production runtime and provide feedback to software engineers during development.
  7. Developer Targeted Performance Analytics What tools and data are being

    leveraged for decision making in software development for the cloud? How can we use runtime information to support data-driven decision making for engineers during software development guides
  8. What tools and data are being leveraged for decision making

    in software development for the cloud?
  9. Study on Software Development for the Cloud “The Making of

    Cloud Applications” - FSE’15 Adapted from https://xkcd.com/1423/ Interview with 25 software developers that deploy in the cloud Survey with 294 responses Developer Me
  10. Study on Software Development for the Cloud “The Making of

    Cloud Applications” - FSE’15 62% say more metrics are available in the cloud & 84% say they look at performance metrics on a regular basis
  11. Study on Software Development for the Cloud “The Making of

    Cloud Applications” - FSE’15 Adapted from https://xkcd.com/1423/ Topic: Solving problems that have been detected in production Nah, I rather go by intuition? Do you look at any metrics?
  12. How can we use runtime information to support data-driven decision

    making for engineers during software development?
  13. Developer Targeted Performance Analytics integrating metrics into daily developer workflows

    prevent bad things from happening bring metrics into context
  14. Conceptual Overview
 “Runtime Metric Meets Developer” - SPLASH Onward’15 Paper:

    https://peerj.com/preprints/985/
 Blog Post on #themorningpaper
 https://blog.acolyer.org/2015/11/10/runtime-metric-meets-developer-building-better-cloud-applications-using-feedback/
  15. Code Artifacts Deployment ....... [26/06/2015:21205.0], responseTime, "CustomerService", 204 [26/06/2015:21215.0], responseTime,

    "CustomerService", 169 [26/06/2015:21216.0], cpuUtilization, "CustomerServiceVM2", 0.73 [26/06/2015:21216.0], cpuUtilization, "CustomerServiceVM1", 0.69 [26/06/2015:21216.1], vmBilled, "CustomerServiceVM1", 0.35 [26/06/2015:21219.4], ids, "ids", [1,16,32,189,216] ........ Operations Data observe readConnecti on getConnectio ns ids connectionPo ol readConnecti on getConnectio ns ids connectionPo ol readConnection getConnections ids connectionPool Runtime Metric Annotated AST Conceptual Overview
 Cloud Infrastructure VM1 VM2 Supplier Service User Interface Purch S “Runtime Metric Meets Developer” - SPLASH Onward’15
  16. Conceptual Overview
 “Runtime Metric Meets Developer” - SPLASH Onward’15 Abstract

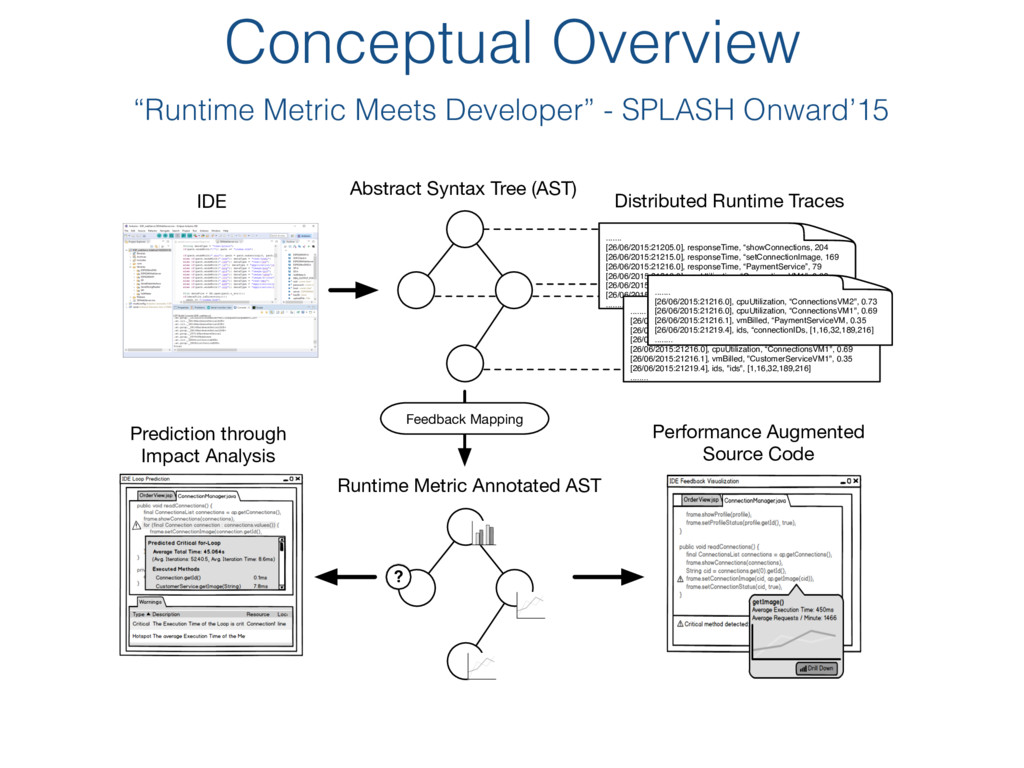
    Syntax Tree (AST) IDE Distributed Runtime Traces Feedback Mapping Runtime Metric Annotated AST Performance Augmented Source Code ? Prediction through Impact Analysis ....... [26/06/2015:21205.0], responseTime, “showConnections, 204 [26/06/2015:21215.0], responseTime, “setConnectionImage, 169 [26/06/2015:21216.0], responseTime, “PaymentService”, 79 [26/06/2015:21216.0], cpuUtilization, “ConnectionsVM1", 0.69 [26/06/2015:21216.1], vmBilled, "CustomerServiceVM1", 0.35 [26/06/2015:21219.4], ids, "ids", [1,16,32,189,216] ........ ....... [26/06/2015:21205.0], responseTime, “showConnections, 204 [26/06/2015:21215.0], responseTime, “setConnectionImage, 169 [26/06/2015:21216.0], responseTime, “PaymentService”, 79 [26/06/2015:21216.0], cpuUtilization, “ConnectionsVM1", 0.69 [26/06/2015:21216.1], vmBilled, "CustomerServiceVM1", 0.35 [26/06/2015:21219.4], ids, "ids", [1,16,32,189,216] ........ ....... [26/06/2015:21216.0], cpuUtilization, “ConnectionsVM2", 0.73 [26/06/2015:21216.0], cpuUtilization, “ConnectionsVM1", 0.69 [26/06/2015:21216.1], vmBilled, “PaymentServiceVM, 0.35 [26/06/2015:21219.4], ids, “connectionIDs, [1,16,32,189,216] ........
  17. readConnections connections getConnections getImage setConnectionImage setConnectionStatus ....... [26/06/2015:21205.0], responseTime, “showConnections,

    204 [26/06/2015:21215.0], responseTime, “setConnectionImage, 169 [26/06/2015:21216.0], responseTime, “PaymentService”, 79 [26/06/2015:21216.0], cpuUtilization, “ConnectionsVM1", 0.69 [26/06/2015:21216.1], vmBilled, "CustomerServiceVM1", 0.35 [26/06/2015:21219.4], ids, "ids", [1,16,32,189,216] ........ ....... [26/06/2015:21216.0], cpuUtilization, “ConnectionsVM2", 0.73 [26/06/2015:21216.0], cpuUtilization, “ConnectionsVM1", 0.69 [26/06/2015:21216.1], vmBilled, “PaymentServiceVM, 0.35 [26/06/2015:21219.4], ids, “connectionIDs, [1,16,32,189,216] ........ Feedback Specification
  18. PoC Implementation of the approach as an Eclipse plugin >

    Performance Awareness > Contextualization 31 PerformanceHat
 (Industrial Case Study: Cloudmore)
  19. Matching information to source code is part of the build

    process in the IDE Scaling Runtime Performance Matching Matching information to source code is part of the daily developer workflow It cannot be slow! 34
  20. Scaling Runtime Performance Matching Component Analysis: Which of the components

    could 
 impede the development workflow? Every build needs to:
 > Identify and extract relevant AST nodes > Retrieve information for each relevant node > Execute inference for new nodes with unknown properties > Propagate predicted entity 35
  21. Scaling Runtime Performance Matching Component Analysis: Which of the components

    could 
 impede the development workflow? Analysis needs to take into account different scopes
 > Single File Builds > Incremental Builds > Full Project Builds 36
  22. Scaling Runtime Performance Matching Component Analysis: Which of the components

    could 
 impede the development workflow? Potentially problematic 37
  23. Scaling Runtime Performance Matching Revamped architecture to enable scalability Local

    Workstation Local Feedback Handler Local IDE Cache Datastore HTTP Infrastructure 1 Deployed Feedback Handler Deployed System Transform IDE Infrastructure 2 Deployed Feedback Handler Deployed System Transform Infrastructure n Deployed Feedback Handler Deployed System Transform …. HTTP Stream (Apache Kafka Broker) HTTP Specification Function Inference Function Registered Filters
  24. Scaling Runtime Performance Matching Component Analysis: Measurements Agilefant Full EU

    Project Full Story Single File Controller Single File Cache / Cold Cache / Warm No Cache / Cold No Cache / Warm 0.00 0.25 0.50 0.75 1.00 0.00 0.25 0.50 0.75 1.00 0.00 0.25 0.50 0.75 1.00 0.00 0.25 0.50 0.75 1.00 Build Time [%] Scenario Prediction Marking Fetching Other Attaching
  25. Controlled User Study 
 Overview “Classical” software engineering user study:

    > Between Subject Study
 > 20 software engineers (min. 1 year of experience) > Relevant study subject: Agilefant > 4 Tasks (both related and not related to performance bugs) Control Group (Kibana) Treatment Group (PerformanceHat) 41
  26. Controlled User Study 
 Hypotheses & Metrics H01: Given a

    maintenance task that would introduce a performance bug, software engineers using PerformanceHat are faster in detecting the performance bug
 H02: Given a maintenance task that would introduce a performance bug, software engineers using PerformanceHat are faster in finding the root cause of the performance bug
 H03: Given a maintenance task that is not relevant to performance, software engineers using PerformanceHat are not slower than the control group in solving the task [Metric: First Encounter (FE)] [Metric: Root-Cause Analysis (RCA)] [Metric: Development Time] 42
  27. Controlled User Study 
 Results 43 100 200 300 400

    500 Time (in seconds) T1 (Total) T2 (Total) T2 (FE) T2 (RCA) T3 (Total) T4 (Total) T4 (FE) T4 (RCA) Control Treatment
  28. @citostyle Jürgen Cito <cito@ifi.uzh.ch> Developer Targeted Performance Analytics leverages runtime

    data by matching performance metrics to source code artefacts to support decision-making during software development For which (quality) attributes does it make sense 
 to correlate with source code artefacts? How much feedback is too much feedback? http://sealuzh.github.io/PerformanceHat/