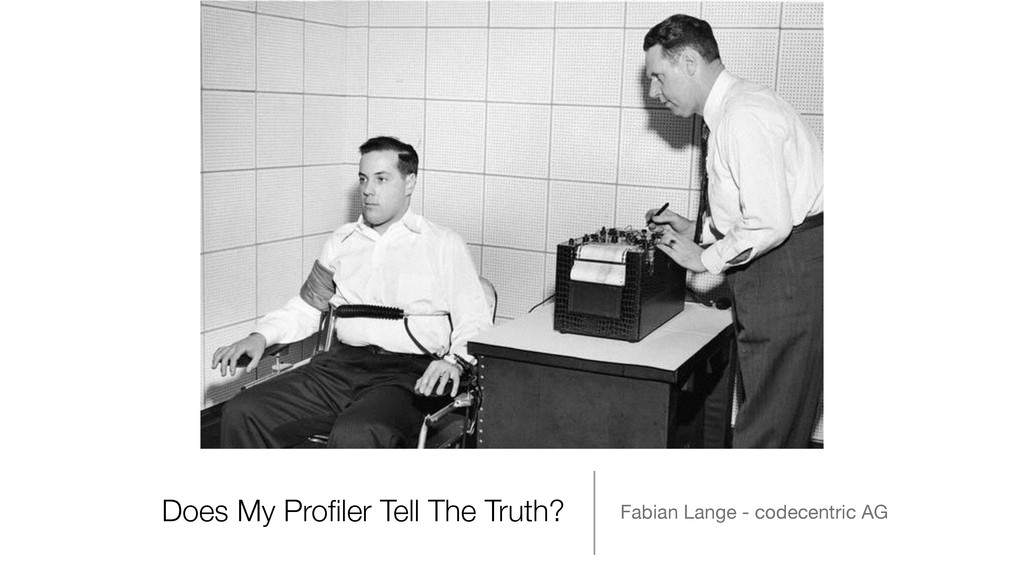
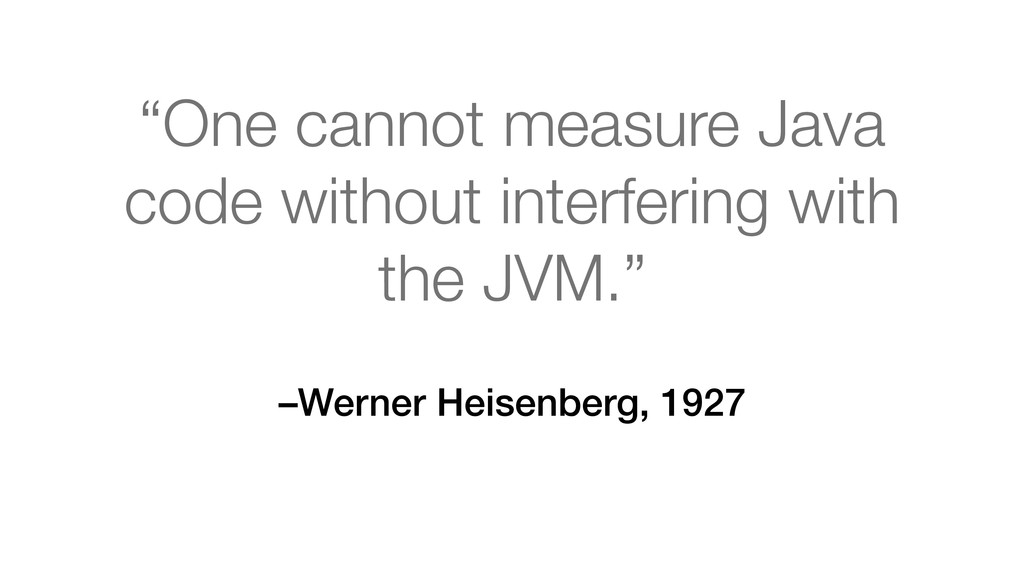
This presentation discusses the techniques profiler and related tools use to measure Java code. It highlights how they work and what this means for the results the tools produce.
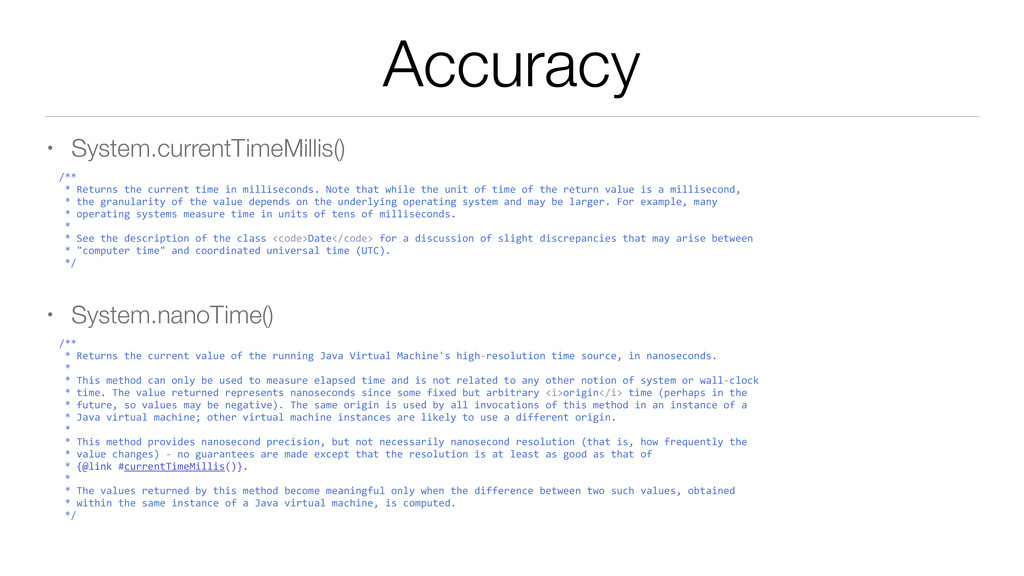
Returns the current time in milliseconds. Note that while the unit of time of the return value is a millisecond, * the granularity of the value depends on the underlying operating system and may be larger. For example, many * operating systems measure time in units of tens of milliseconds. * * See the description of the class <code>Date</code> for a discussion of slight discrepancies that may arise between * "computer time" and coordinated universal time (UTC). */ • System.nanoTime() ! /** * Returns the current value of the running Java Virtual Machine's high-‐resolution time source, in nanoseconds. * * This method can only be used to measure elapsed time and is not related to any other notion of system or wall-‐clock * time. The value returned represents nanoseconds since some fixed but arbitrary <i>origin</i> time (perhaps in the * future, so values may be negative). The same origin is used by all invocations of this method in an instance of a * Java virtual machine; other virtual machine instances are likely to use a different origin. * * This method provides nanosecond precision, but not necessarily nanosecond resolution (that is, how frequently the * value changes) -‐ no guarantees are made except that the resolution is at least as good as that of * {@link #currentTimeMillis()}. * * The values returned by this method become meaningful only when the difference between two such values, obtained * within the same instance of a Java virtual machine, is computed. */
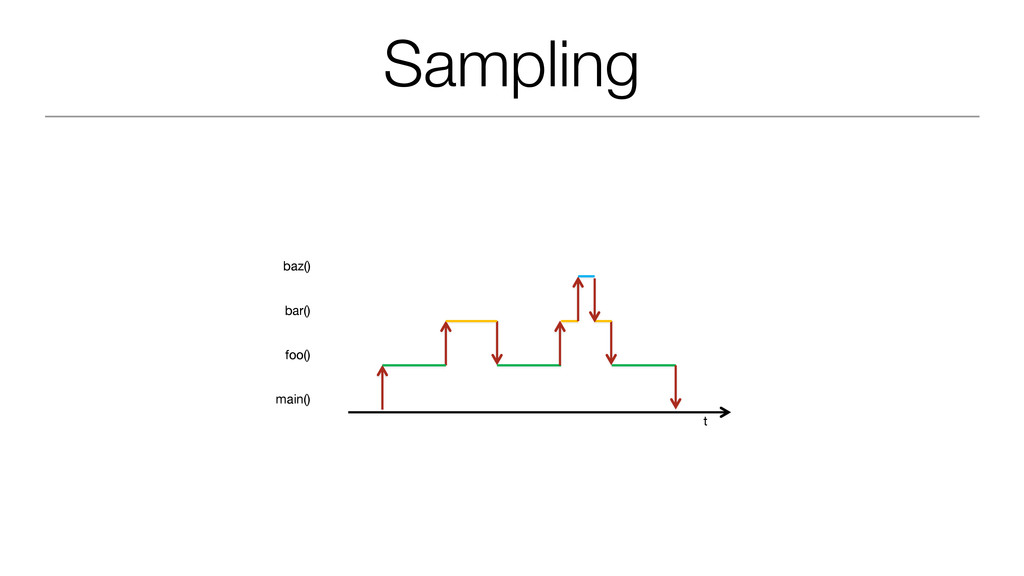
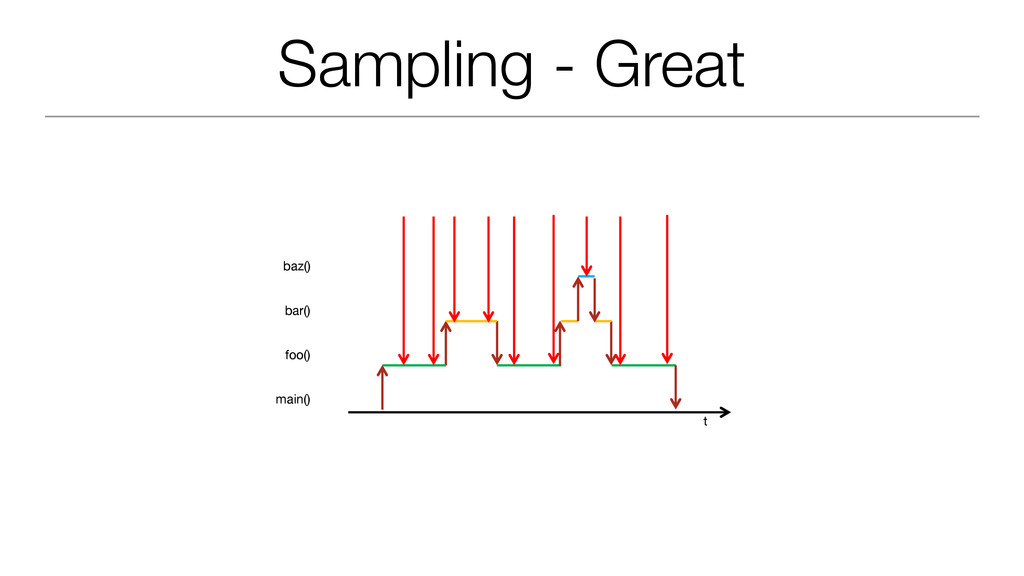
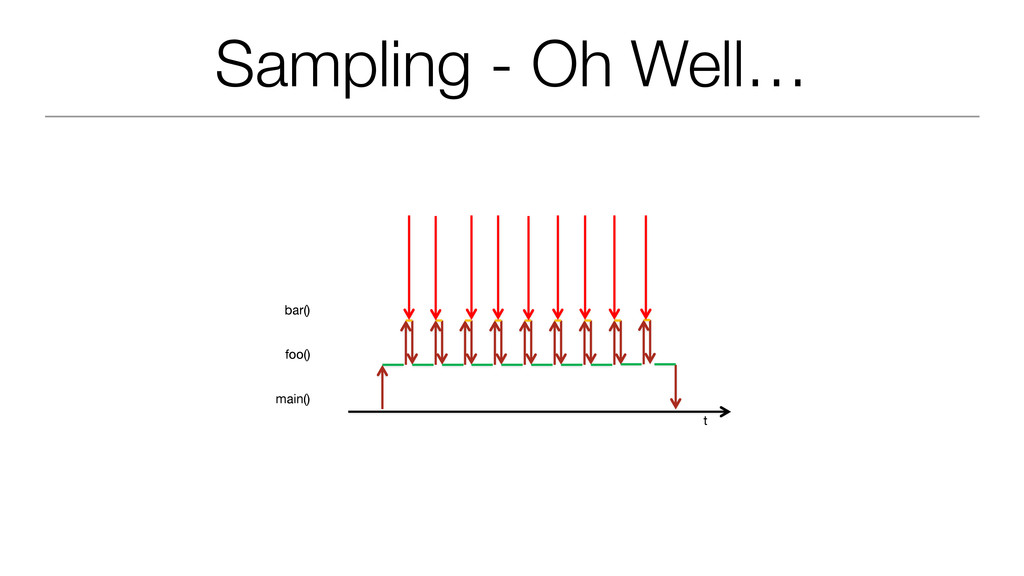
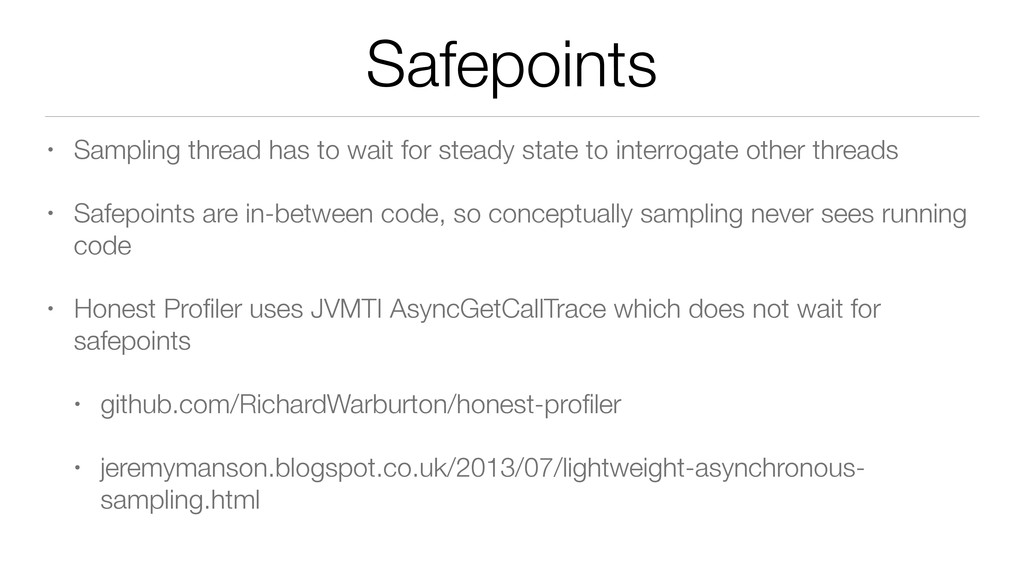
to interrogate other threads • Safepoints are in-between code, so conceptually sampling never sees running code • Honest Profiler uses JVMTI AsyncGetCallTrace which does not wait for safepoints • github.com/RichardWarburton/honest-profiler • jeremymanson.blogspot.co.uk/2013/07/lightweight-asynchronous- sampling.html
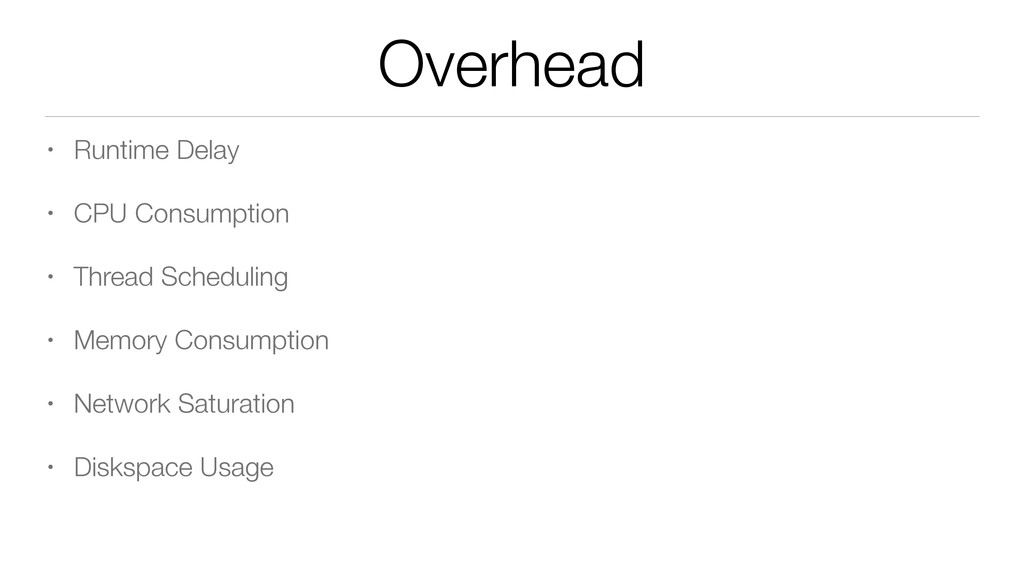
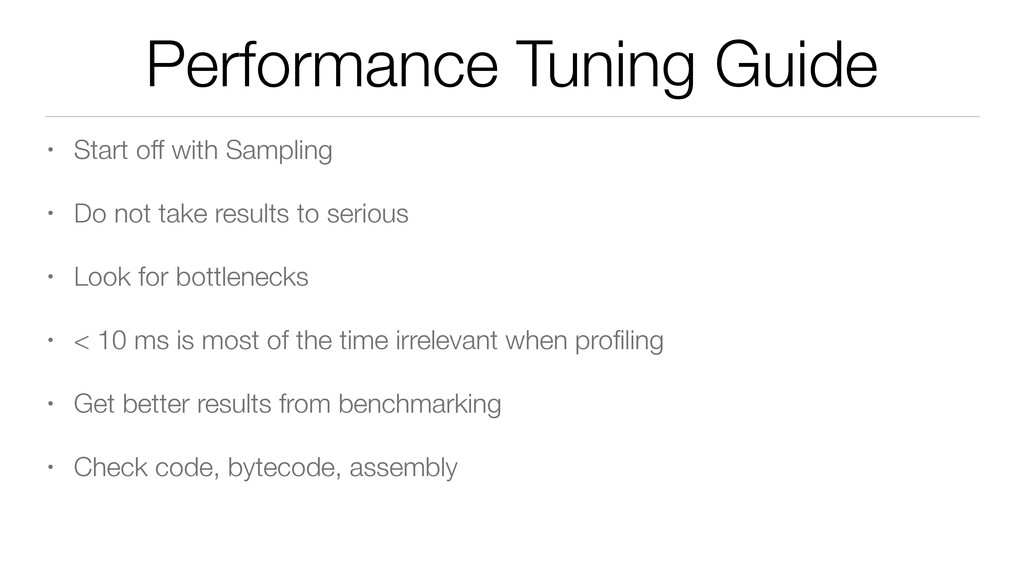
not take results to serious • Look for bottlenecks • < 10 ms is most of the time irrelevant when profiling • Get better results from benchmarking • Check code, bytecode, assembly
![Want to know more? ! @CodingFabian [email protected] lj speakerdeck.com/CodingFabian github.com/CodingFabian](https://files.speakerdeck.com/presentations/49d8a950264e0132408e62c99fab29cb/slide_41.jpg)