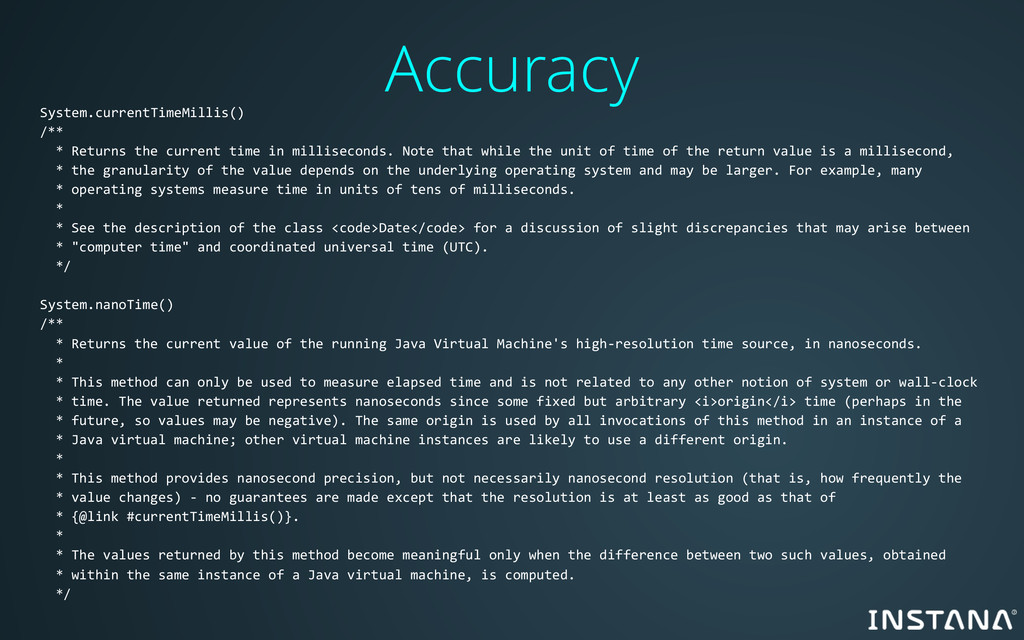
Note that while the unit of time of the return value is a millisecond, * the granularity of the value depends on the underlying operating system and may be larger. For example, many * operating systems measure time in units of tens of milliseconds. * * See the description of the class <code>Date</code> for a discussion of slight discrepancies that may arise between * "computer time" and coordinated universal time (UTC). */ System.nanoTime() /** * Returns the current value of the running Java Virtual Machine's high-resolution time source, in nanoseconds. * * This method can only be used to measure elapsed time and is not related to any other notion of system or wall-clock * time. The value returned represents nanoseconds since some fixed but arbitrary <i>origin</i> time (perhaps in the * future, so values may be negative). The same origin is used by all invocations of this method in an instance of a * Java virtual machine; other virtual machine instances are likely to use a different origin. * * This method provides nanosecond precision, but not necessarily nanosecond resolution (that is, how frequently the * value changes) - no guarantees are made except that the resolution is at least as good as that of * {@link #currentTimeMillis()}. * * The values returned by this method become meaningful only when the difference between two such values, obtained * within the same instance of a Java virtual machine, is computed. */
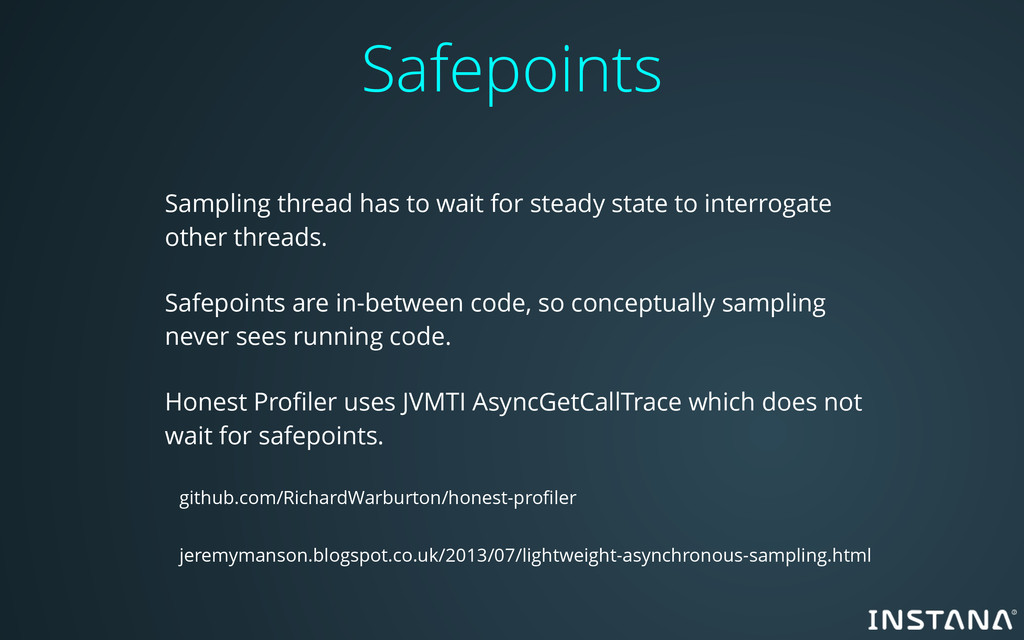
interrogate other threads. Safepoints are in-between code, so conceptually sampling never sees running code. Honest Profiler uses JVMTI AsyncGetCallTrace which does not wait for safepoints. github.com/RichardWarburton/honest-profiler jeremymanson.blogspot.co.uk/2013/07/lightweight-asynchronous-sampling.html
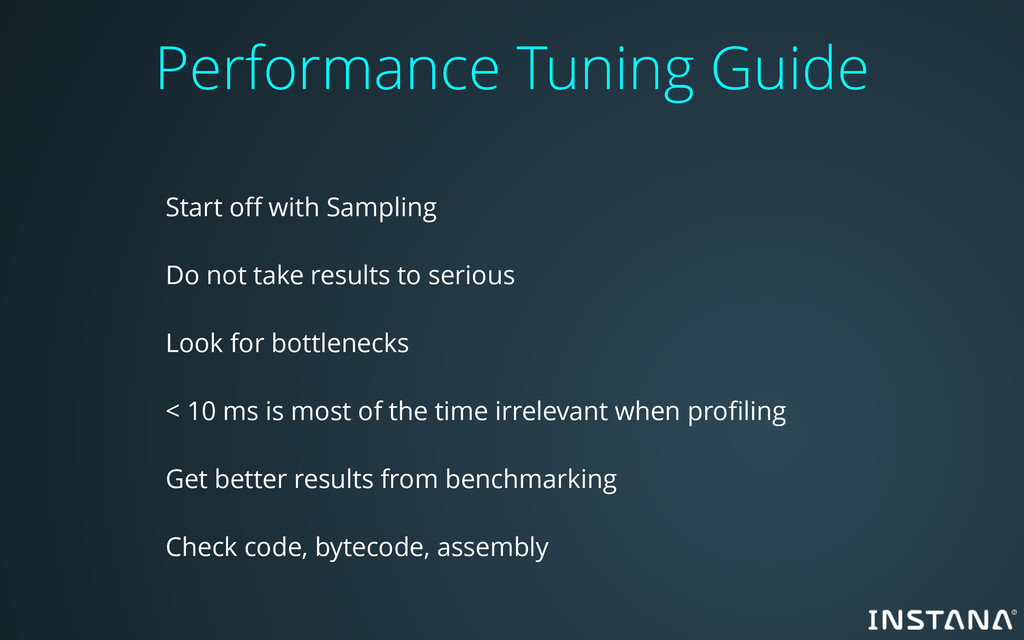
results to serious Look for bottlenecks < 10 ms is most of the time irrelevant when profiling Get better results from benchmarking Check code, bytecode, assembly
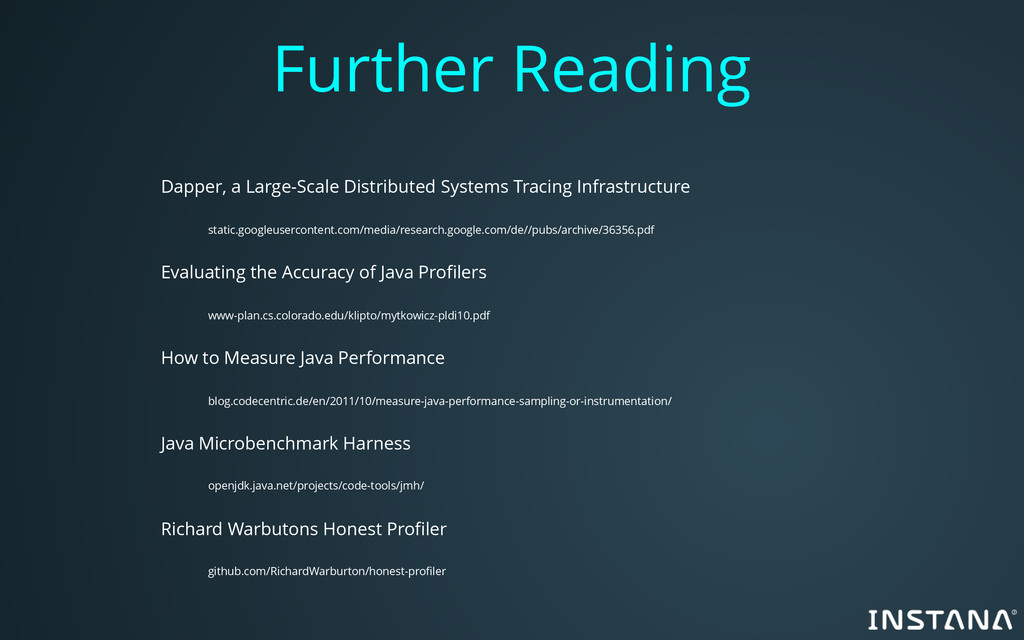
Evaluating the Accuracy of Java Profilers www-plan.cs.colorado.edu/klipto/mytkowicz-pldi10.pdf How to Measure Java Performance blog.codecentric.de/en/2011/10/measure-java-performance-sampling-or-instrumentation/ Java Microbenchmark Harness openjdk.java.net/projects/code-tools/jmh/ Richard Warbutons Honest Profiler github.com/RichardWarburton/honest-profiler
![Want to know more? @CodingFabian [email protected] lj speakerdeck.com/CodingFabian github.com/CodingFabian](https://files.speakerdeck.com/presentations/caa5272bd8154c17b278b0d25071cf68/slide_42.jpg)