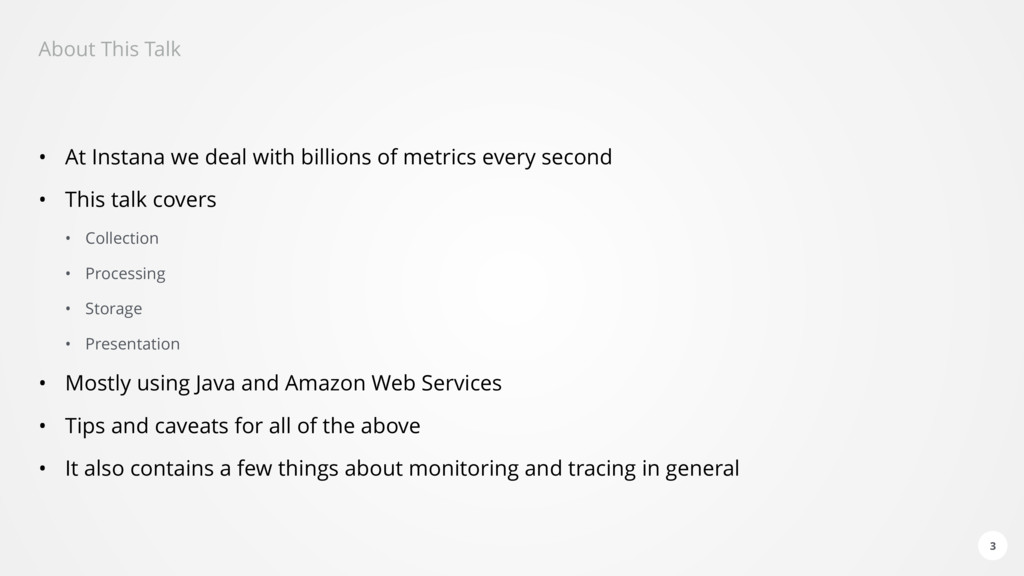
of metrics every second • This talk covers • Collection • Processing • Storage • Presentation • Mostly using Java and Amazon Web Services • Tips and caveats for all of the above • It also contains a few things about monitoring and tracing in general 3
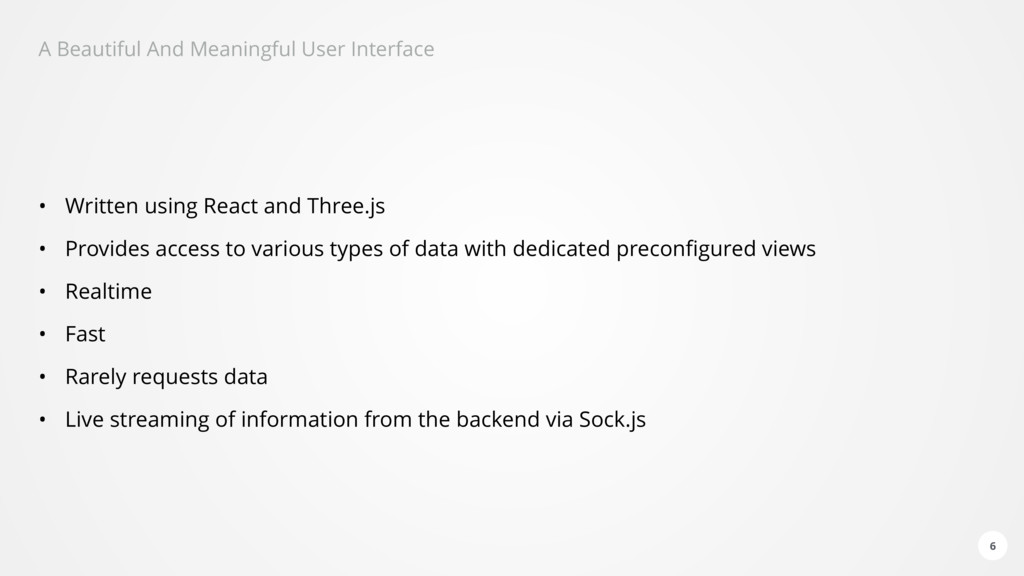
and Three.js • Provides access to various types of data with dedicated preconfigured views • Realtime • Fast • Rarely requests data • Live streaming of information from the backend via Sock.js 6
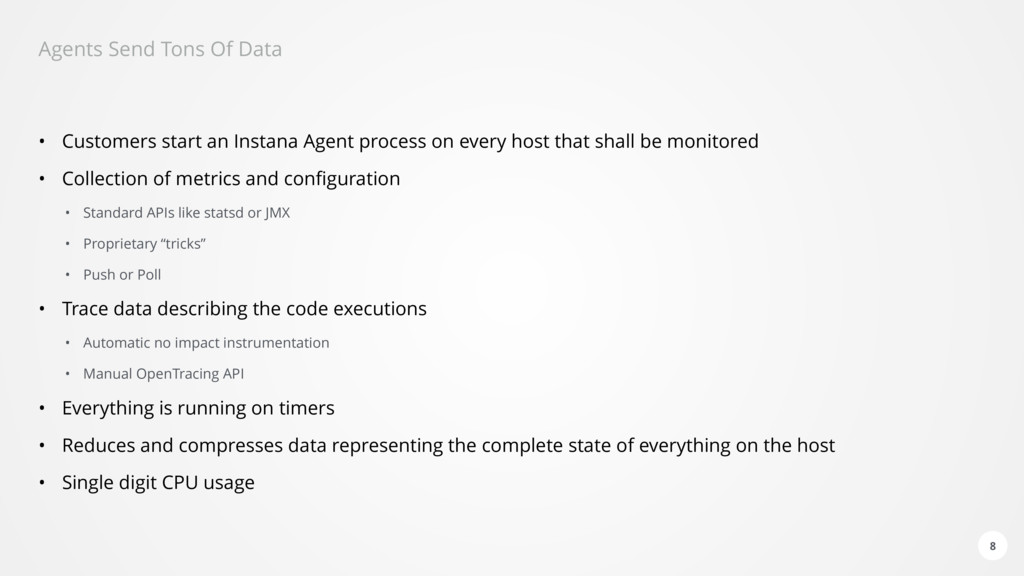
Agent process on every host that shall be monitored • Collection of metrics and configuration • Standard APIs like statsd or JMX • Proprietary “tricks” • Push or Poll • Trace data describing the code executions • Automatic no impact instrumentation • Manual OpenTracing API • Everything is running on timers • Reduces and compresses data representing the complete state of everything on the host • Single digit CPU usage 8
data straight through • When an agent sends a metric value, we could update the UI. • However we want to do more than that • Analyze correlation between any metric or event in the whole system. • E.g. When one server is overloaded, another one times out on network connections at the same time. • Build a canonical representation of EVERYTHING 13
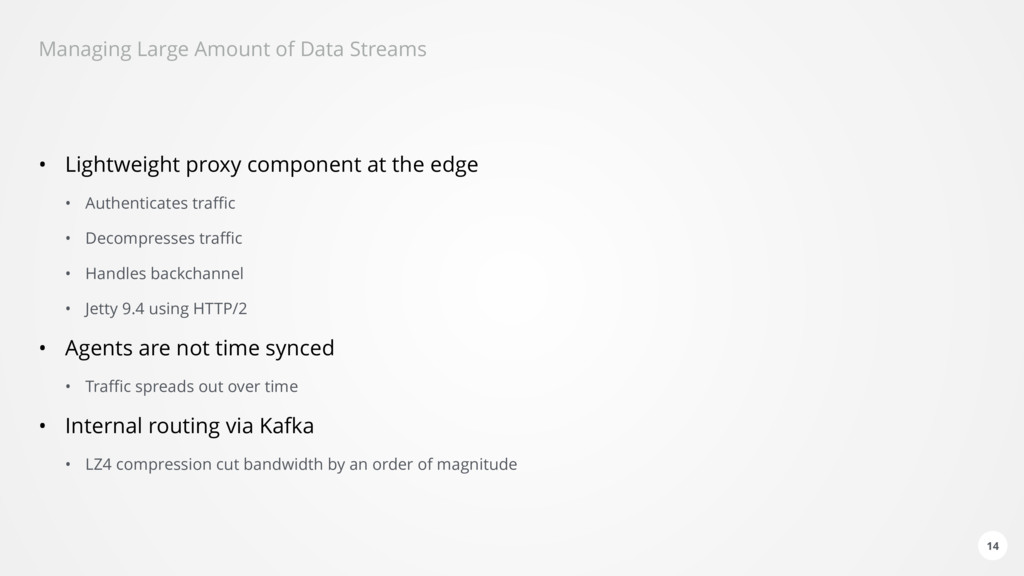
at the edge • Authenticates traffic • Decompresses traffic • Handles backchannel • Jetty 9.4 using HTTP/2 • Agents are not time synced • Traffic spreads out over time • Internal routing via Kafka • LZ4 compression cut bandwidth by an order of magnitude 14
performed in a “tenant unit”. • Customers have access to all of their units via SSO. • Units have multiple purposes • Separating environments like production and test • Allowing organisational separation despite centralised billing • Scaling via sharding 18
and relation • builds Dynamic Graph from incoming data • sanitizes and time-normalizes data and fills missing data • Optimizes for long time storage • Brain: analysis and understanding • runs on the Dynamic Graph and continuously evaluates health • performs root cause analysis and alerting 19
state of a customer environment in memory • Incorporates stream of incoming changes / new data • Metrics • Events • Traces • Configuration changes • Performs the canonical time ticking 20
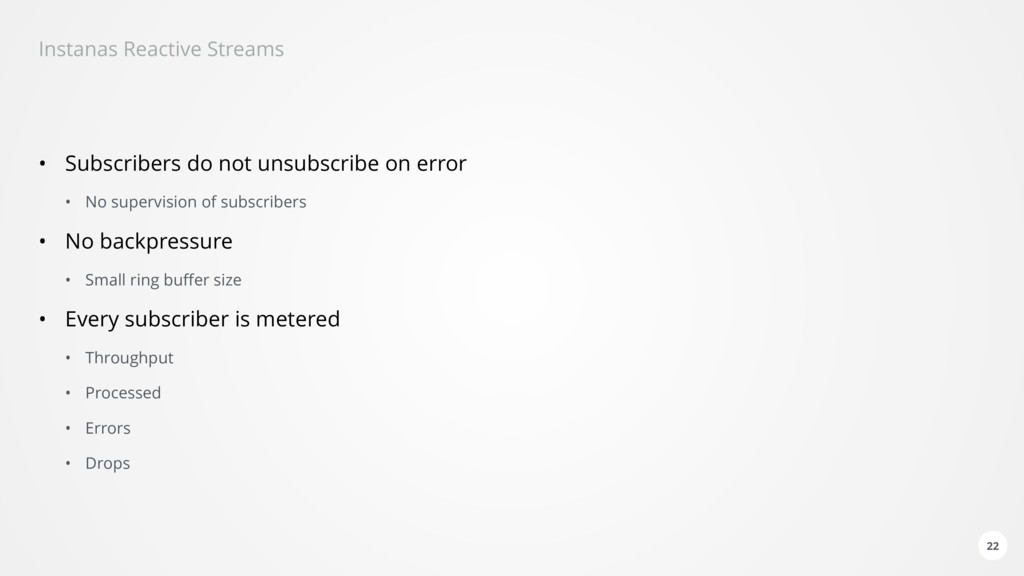
• Every processing step is a subscriber on a stream • Rollup calculation and persistence • Deriving events from changes • Short term storage for live mode • Indexing for search 21
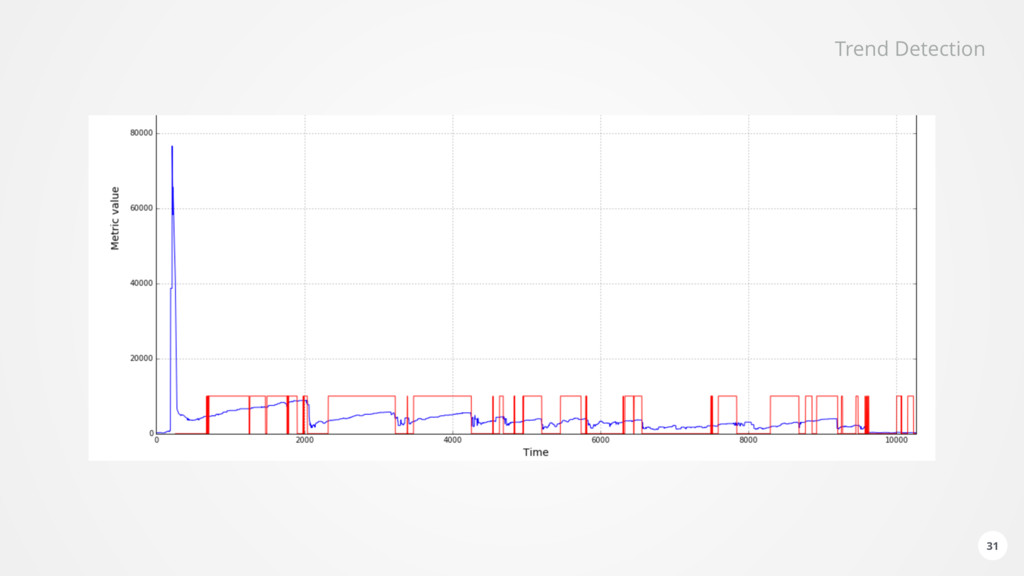
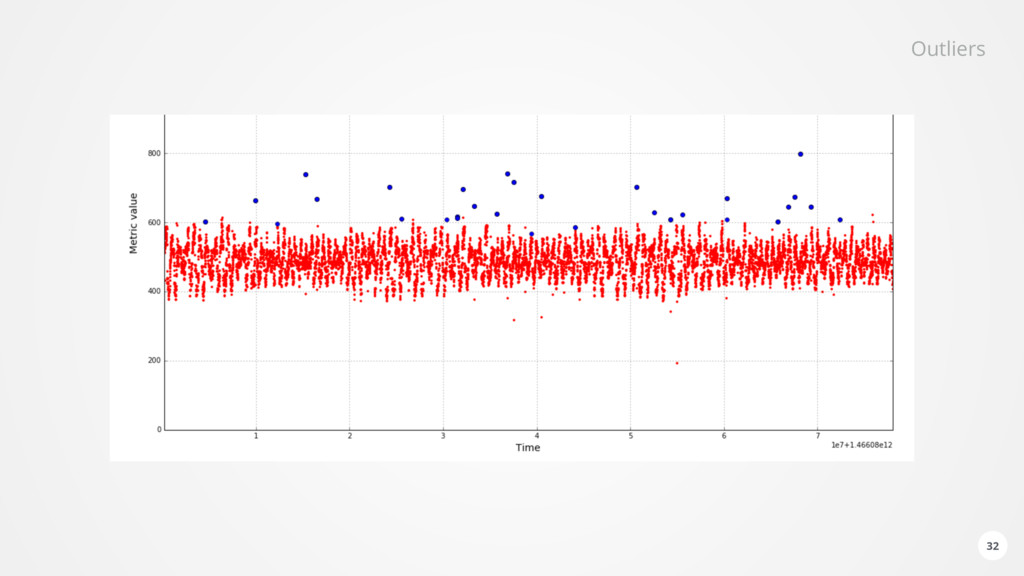
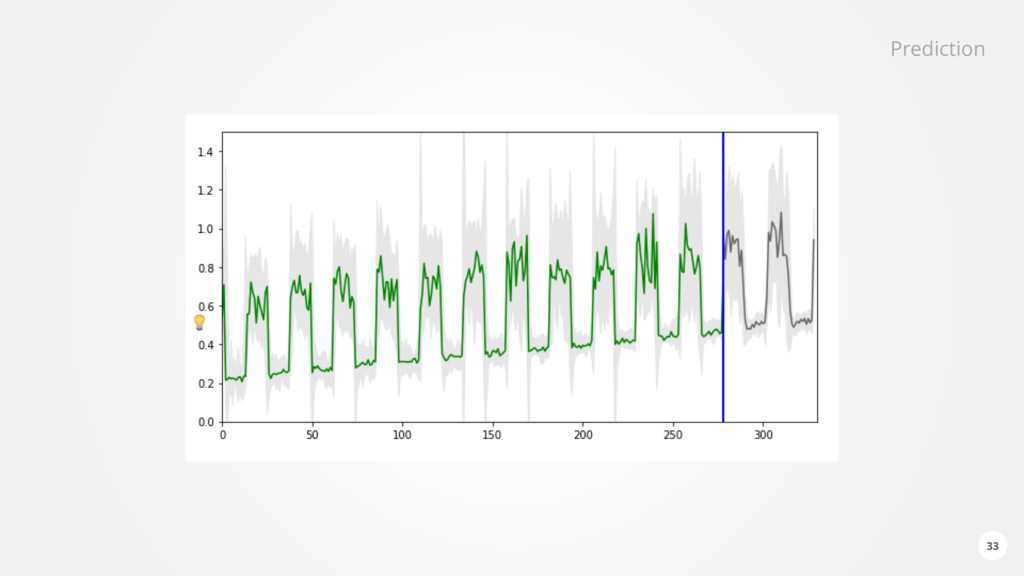
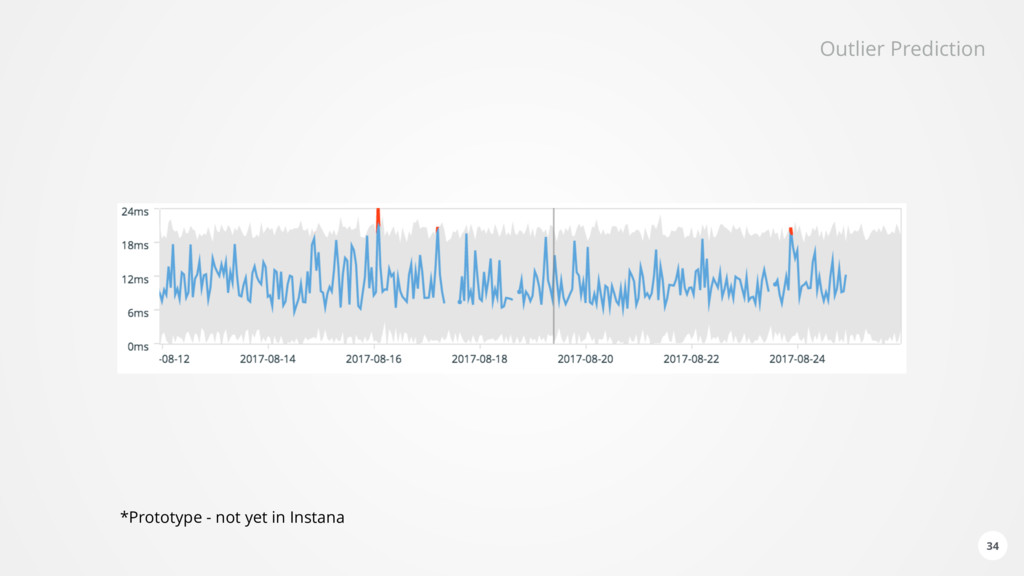
of data for each monitored component every second • Health analysis subscribes dynamically to the relevant incoming data • Performs • Configuration analysis • Static thresholds • Trend prediction • Outlier and anomaly detection • Neural network based forecasting • Found issues are stored in Elasticsearch and forwarded via Kafka • Reoccurring issues are detected • Causality is analysed based on temporal order and relationships in the Dynamic Graph 28
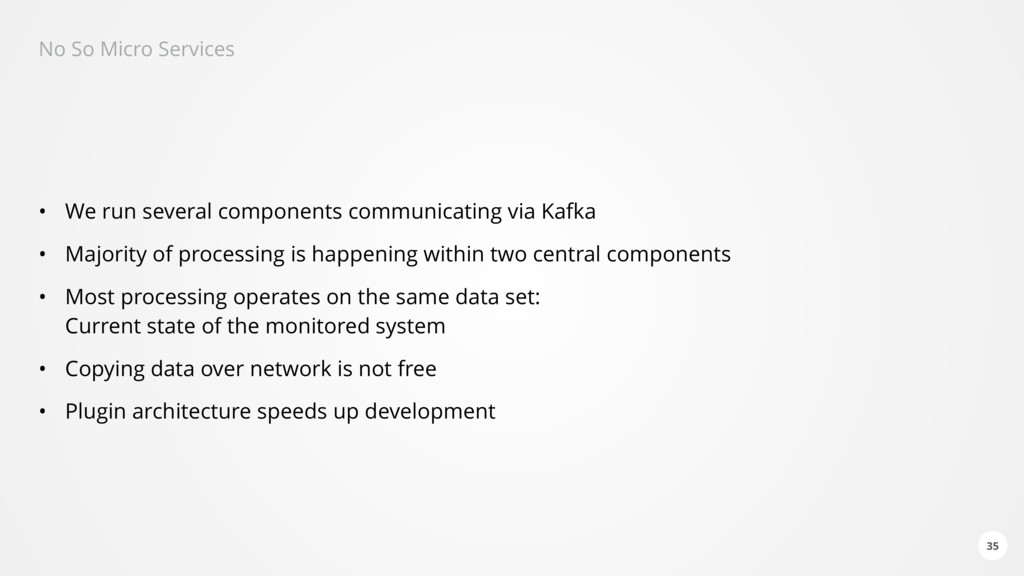
via Kafka • Majority of processing is happening within two central components • Most processing operates on the same data set: Current state of the monitored system • Copying data over network is not free • Plugin architecture speeds up development 35
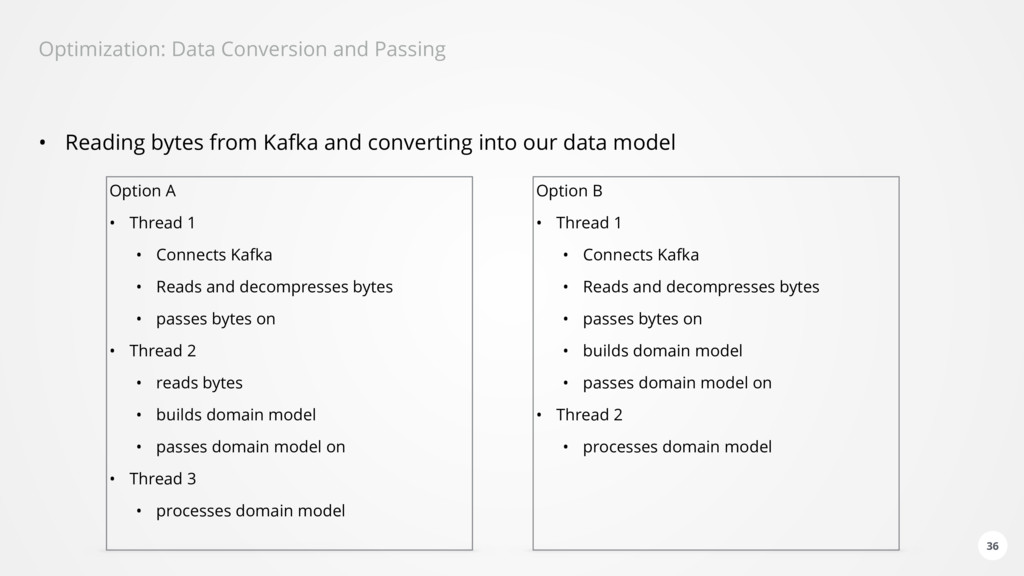
and converting into our data model 36 Option A • Thread 1 • Connects Kafka • Reads and decompresses bytes • passes bytes on • Thread 2 • reads bytes • builds domain model • passes domain model on • Thread 3 • processes domain model Option B • Thread 1 • Connects Kafka • Reads and decompresses bytes • passes bytes on • builds domain model • passes domain model on • Thread 2 • processes domain model
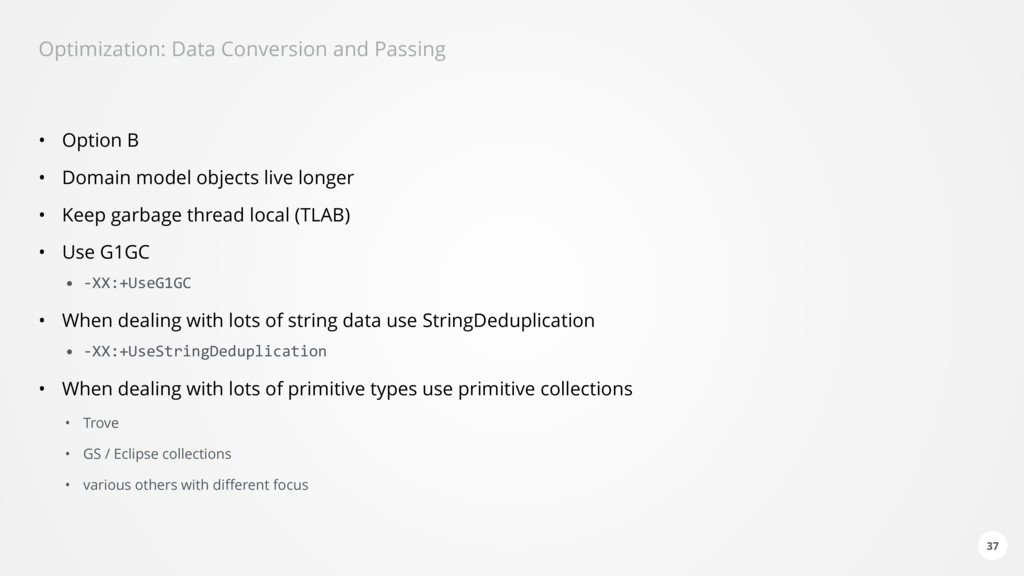
model objects live longer • Keep garbage thread local (TLAB) • Use G1GC • -XX:+UseG1GC • When dealing with lots of string data use StringDeduplication • -XX:+UseStringDeduplication • When dealing with lots of primitive types use primitive collections • Trove • GS / Eclipse collections • various others with different focus 37
Backend is released bi-weekly • SaaS first, on-prem a week later • SaaS releases beginning of the week • 1-2 hotfixes the same week • Real load never matches tests • Ability to roll back or forward quickly 39
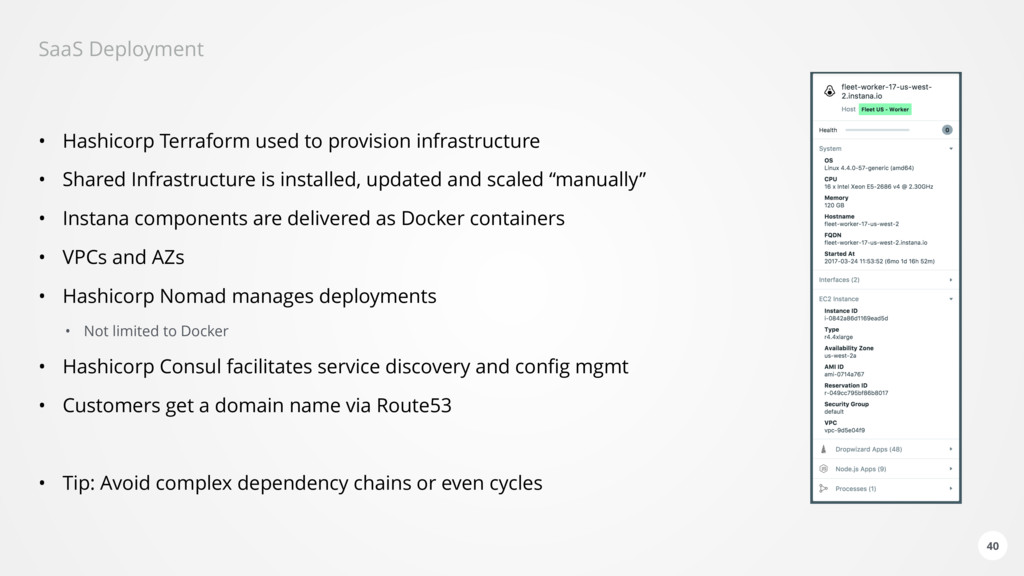
Shared Infrastructure is installed, updated and scaled “manually” • Instana components are delivered as Docker containers • VPCs and AZs • Hashicorp Nomad manages deployments • Not limited to Docker • Hashicorp Consul facilitates service discovery and config mgmt • Customers get a domain name via Route53 • Tip: Avoid complex dependency chains or even cycles 40