• Start agents • See your systems and applications • Get alerted on real issues • Understand problem details and causality Demo from our webinar www.youtube.com/watch?v=z14wXHzw5lU About Instana
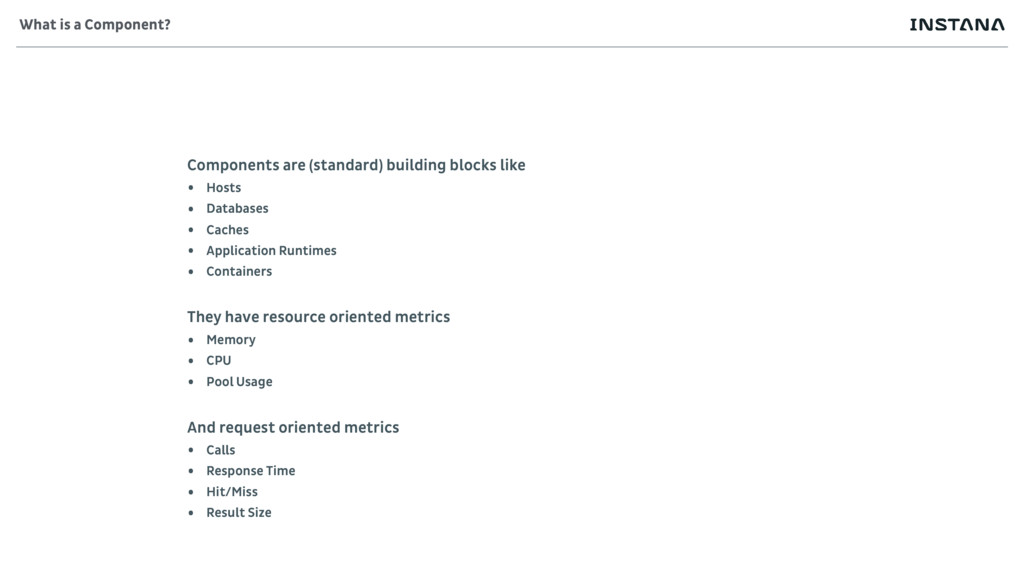
• Caches • Application Runtimes • Containers They have resource oriented metrics • Memory • CPU • Pool Usage And request oriented metrics • Calls • Response Time • Hit/Miss • Result Size What is a Component?
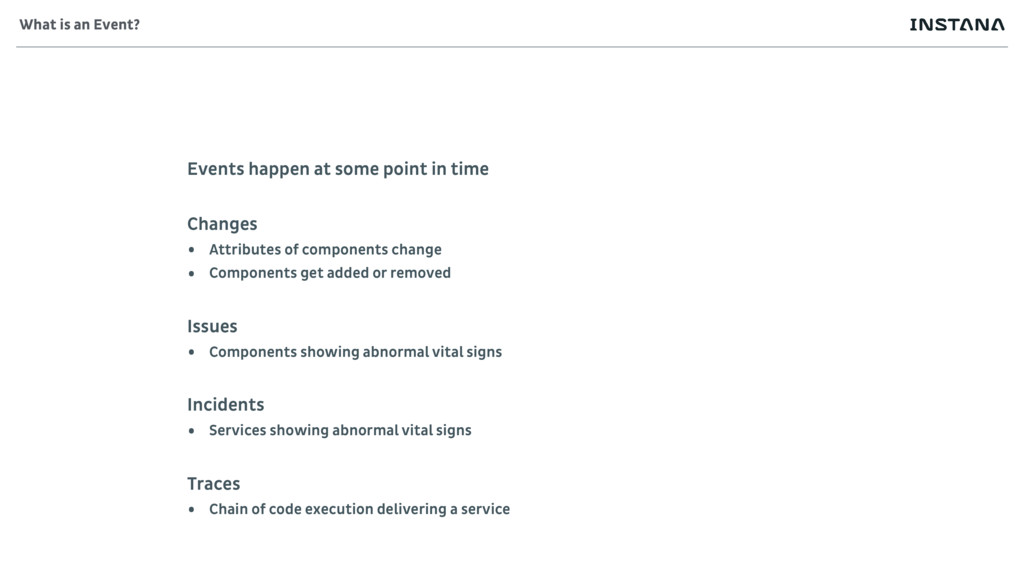
of components change • Components get added or removed Issues • Components showing abnormal vital signs Incidents • Services showing abnormal vital signs Traces • Chain of code execution delivering a service What is an Event?
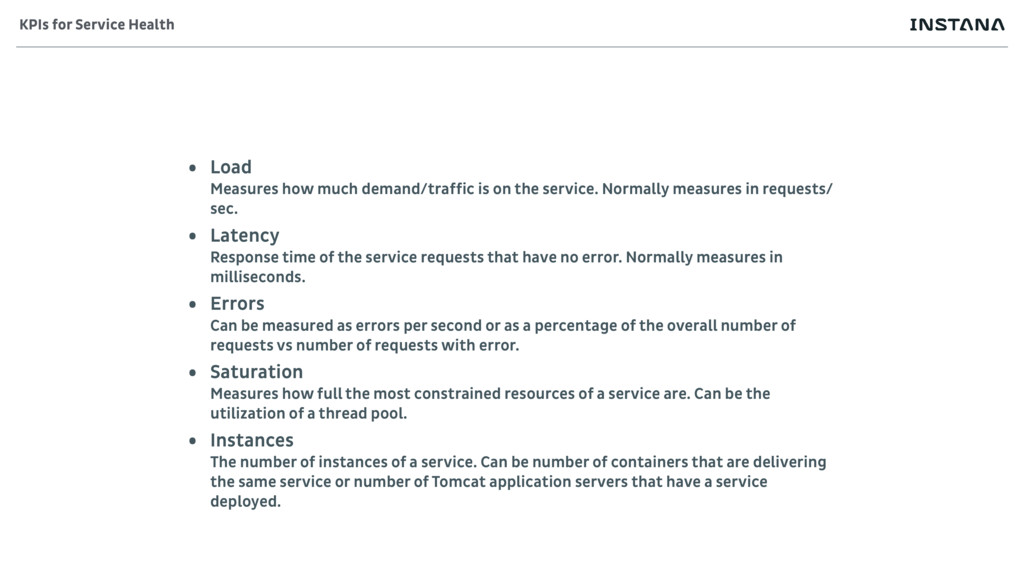
Normally measures in requests/ sec. • Latency Response time of the service requests that have no error. Normally measures in milliseconds. • Errors Can be measured as errors per second or as a percentage of the overall number of requests vs number of requests with error. • Saturation Measures how full the most constrained resources of a service are. Can be the utilization of a thread pool. • Instances The number of instances of a service. Can be number of containers that are delivering the same service or number of Tomcat application servers that have a service deployed. KPIs for Service Health
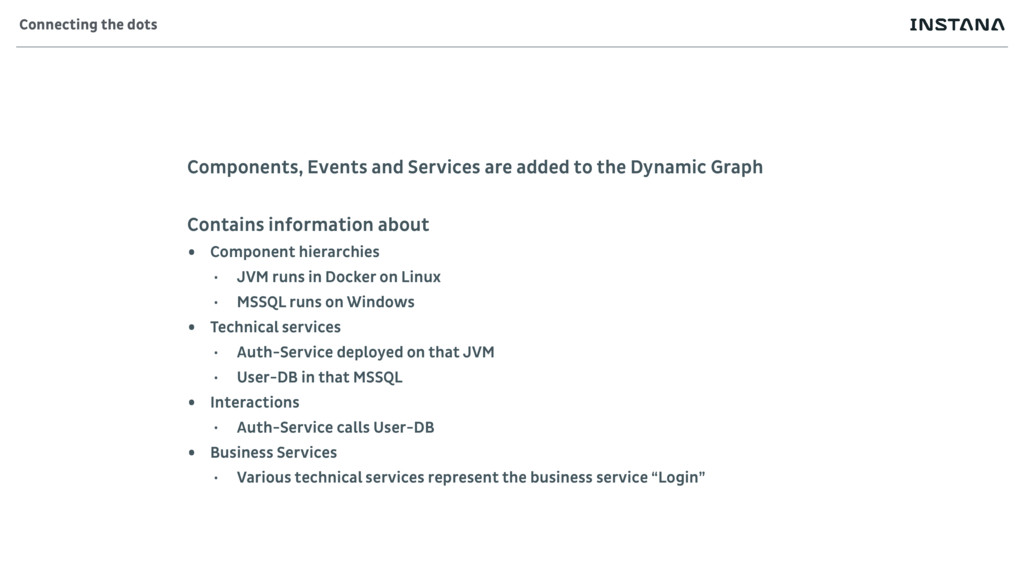
Contains information about • Component hierarchies • JVM runs in Docker on Linux • MSSQL runs on Windows • Technical services • Auth-Service deployed on that JVM • User-DB in that MSSQL • Interactions • Auth-Service calls User-DB • Business Services • Various technical services represent the business service “Login” Connecting the dots
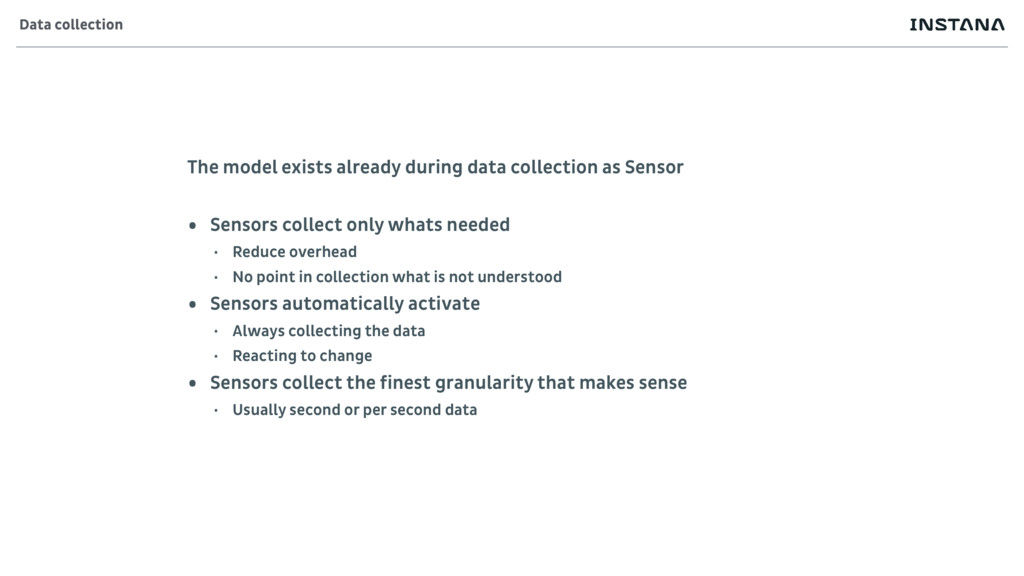
Sensors collect only whats needed • Reduce overhead • No point in collection what is not understood • Sensors automatically activate • Always collecting the data • Reacting to change • Sensors collect the finest granularity that makes sense • Usually second or per second data Data collection
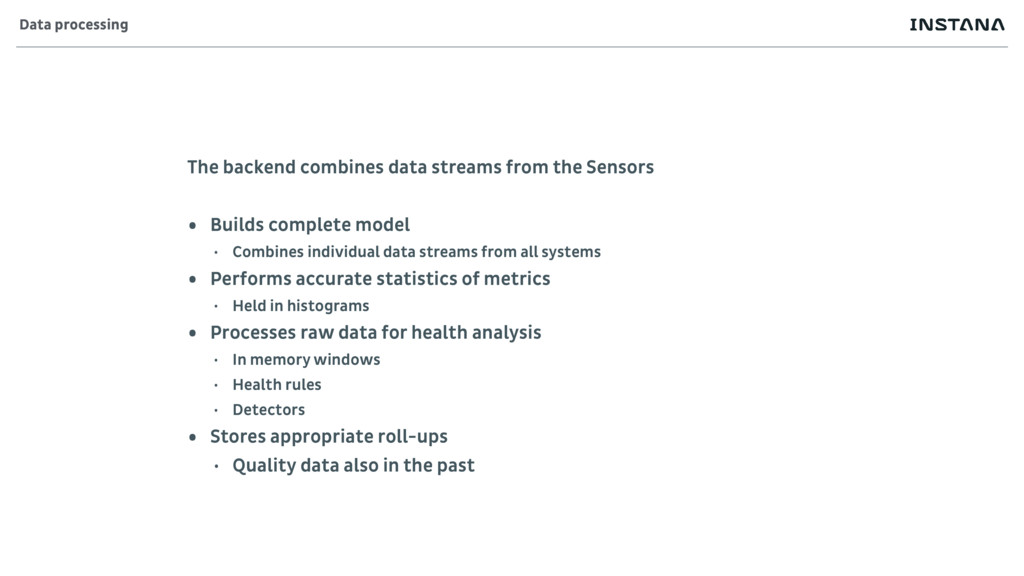
complete model • Combines individual data streams from all systems • Performs accurate statistics of metrics • Held in histograms • Processes raw data for health analysis • In memory windows • Health rules • Detectors • Stores appropriate roll-ups • Quality data also in the past Data processing
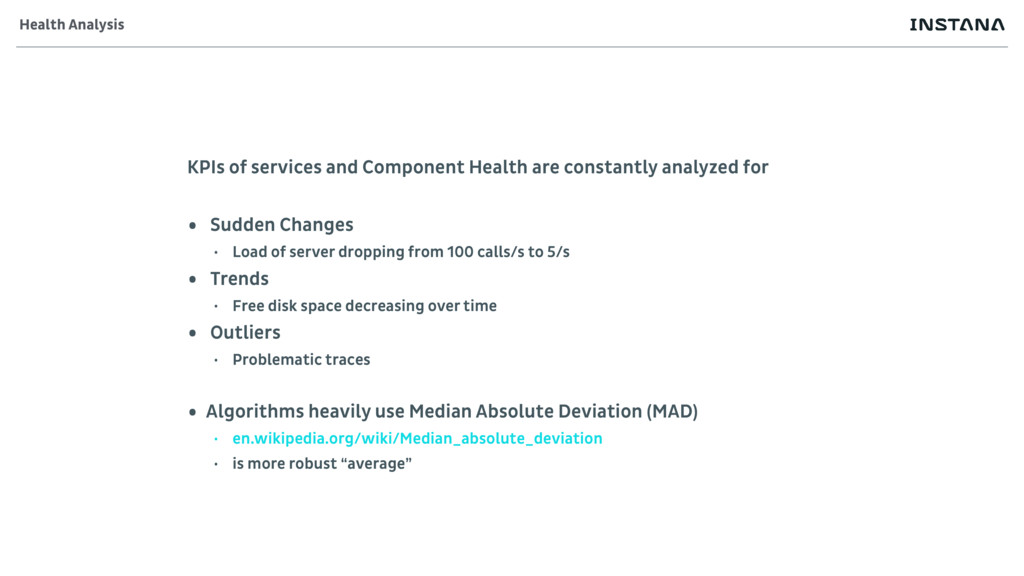
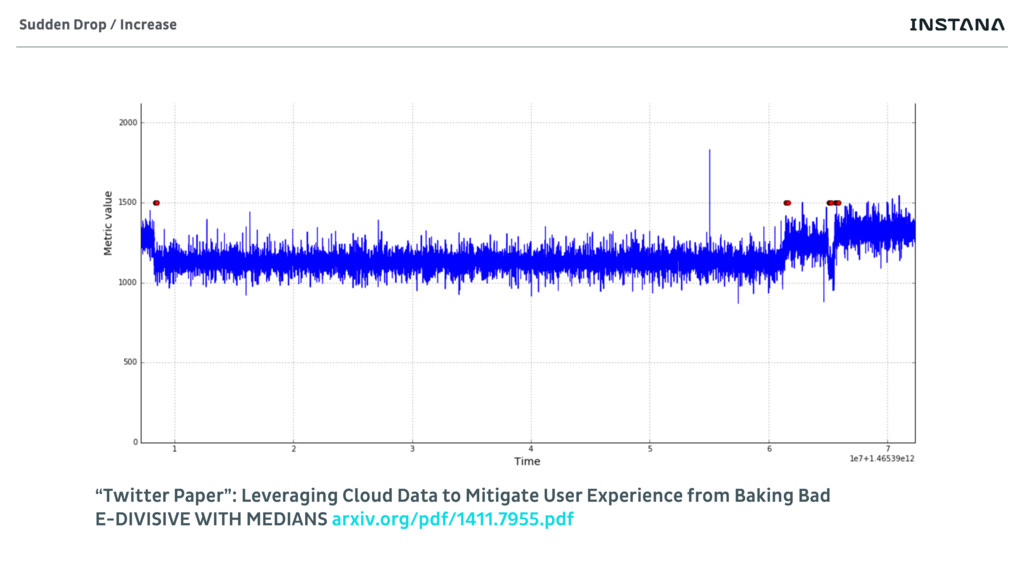
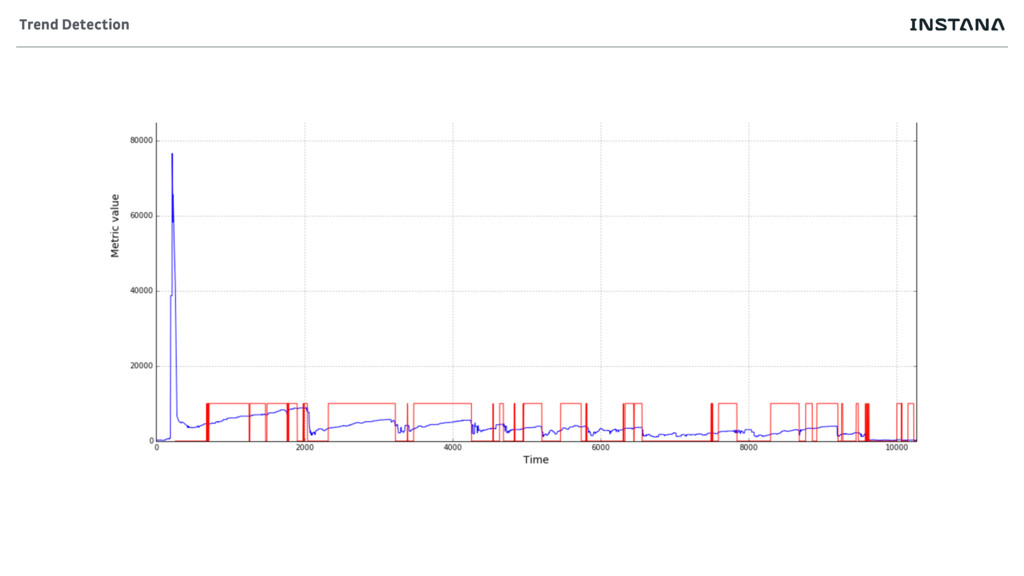
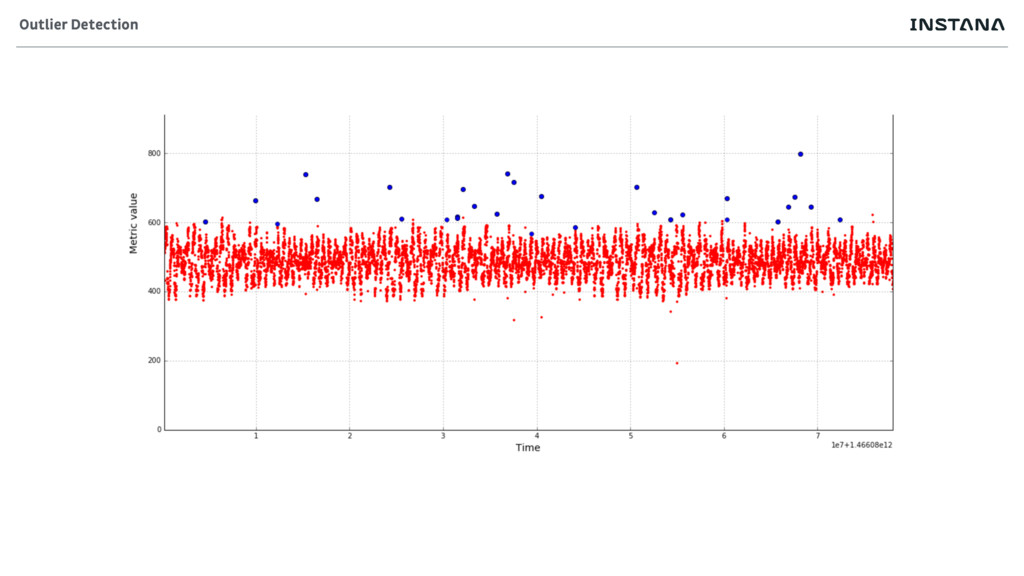
• Sudden Changes • Load of server dropping from 100 calls/s to 5/s • Trends • Free disk space decreasing over time • Outliers • Problematic traces • Algorithms heavily use Median Absolute Deviation (MAD) • en.wikipedia.org/wiki/Median_absolute_deviation • is more robust “average” Health Analysis
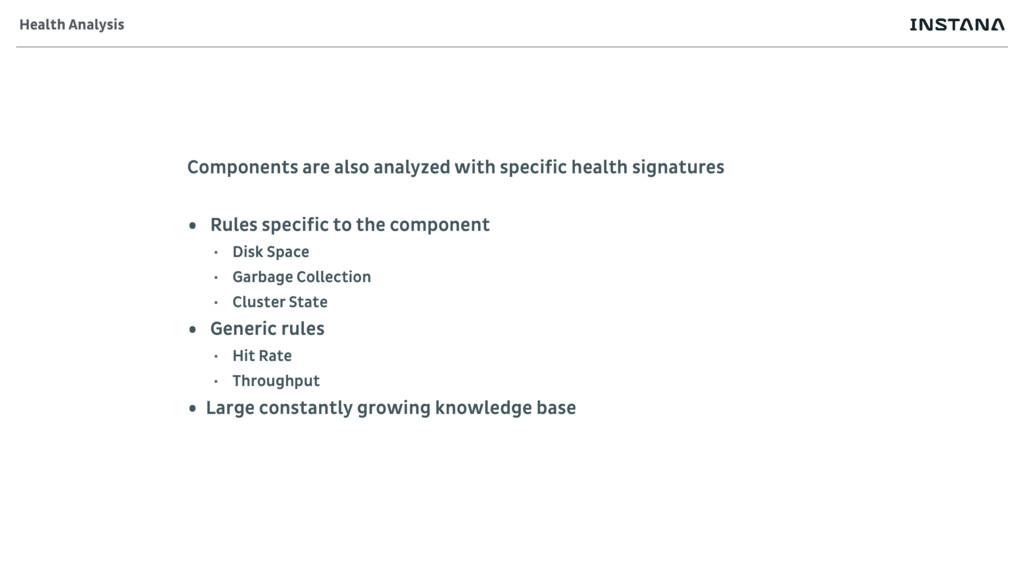
specific to the component • Disk Space • Garbage Collection • Cluster State • Generic rules • Hit Rate • Throughput • Large constantly growing knowledge base Health Analysis
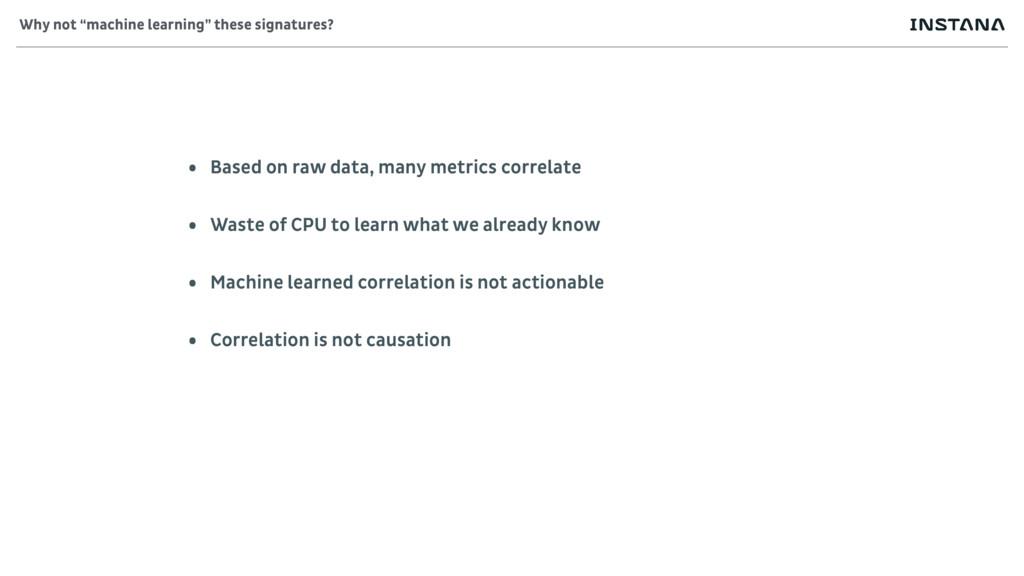
of CPU to learn what we already know • Machine learned correlation is not actionable • Correlation is not causation Why not “machine learning” these signatures?
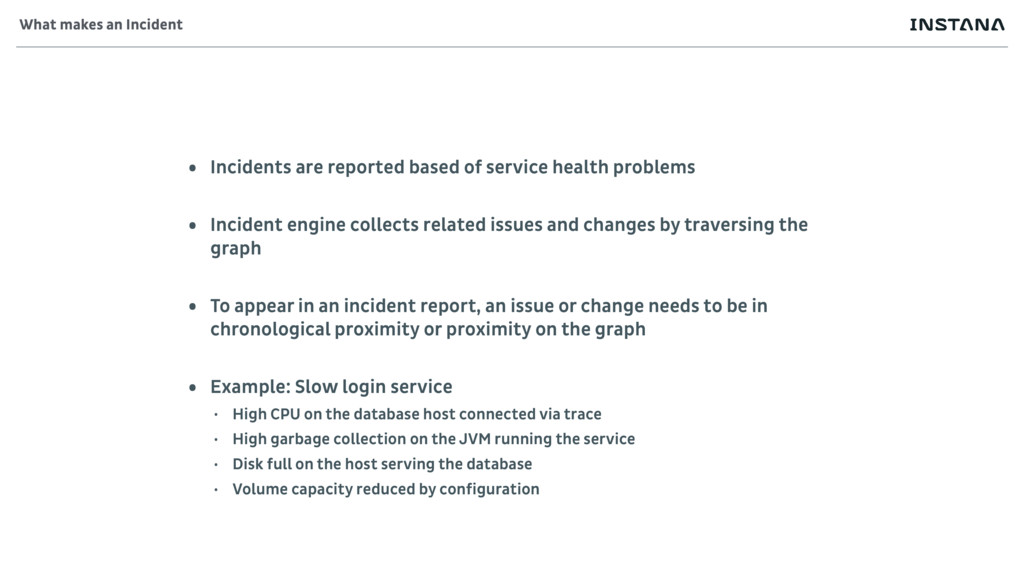
Incident engine collects related issues and changes by traversing the graph • To appear in an incident report, an issue or change needs to be in chronological proximity or proximity on the graph • Example: Slow login service • High CPU on the database host connected via trace • High garbage collection on the JVM running the service • Disk full on the host serving the database • Volume capacity reduced by configuration What makes an Incident
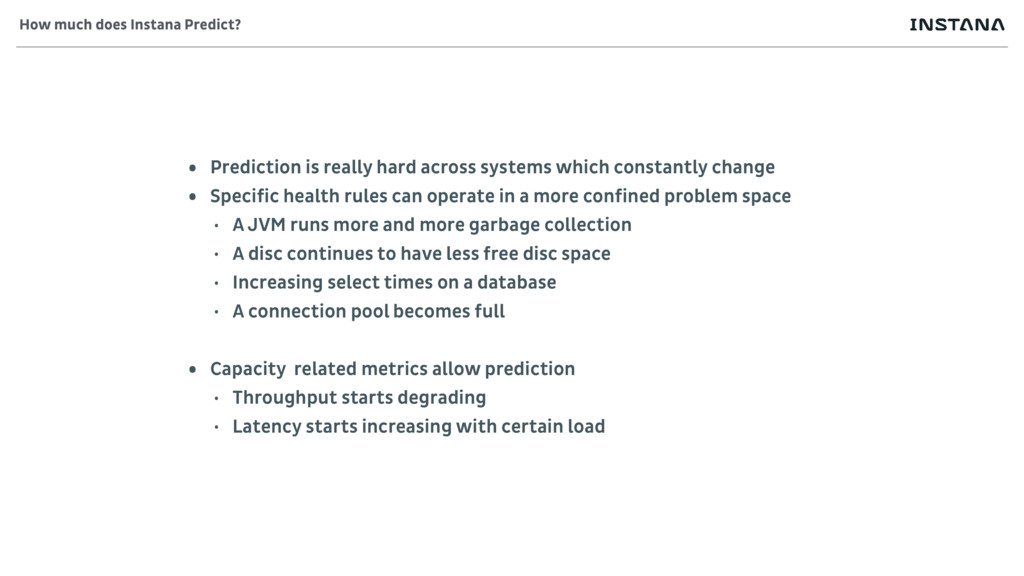
• Specific health rules can operate in a more confined problem space • A JVM runs more and more garbage collection • A disc continues to have less free disc space • Increasing select times on a database • A connection pool becomes full • Capacity related metrics allow prediction • Throughput starts degrading • Latency starts increasing with certain load How much does Instana Predict?
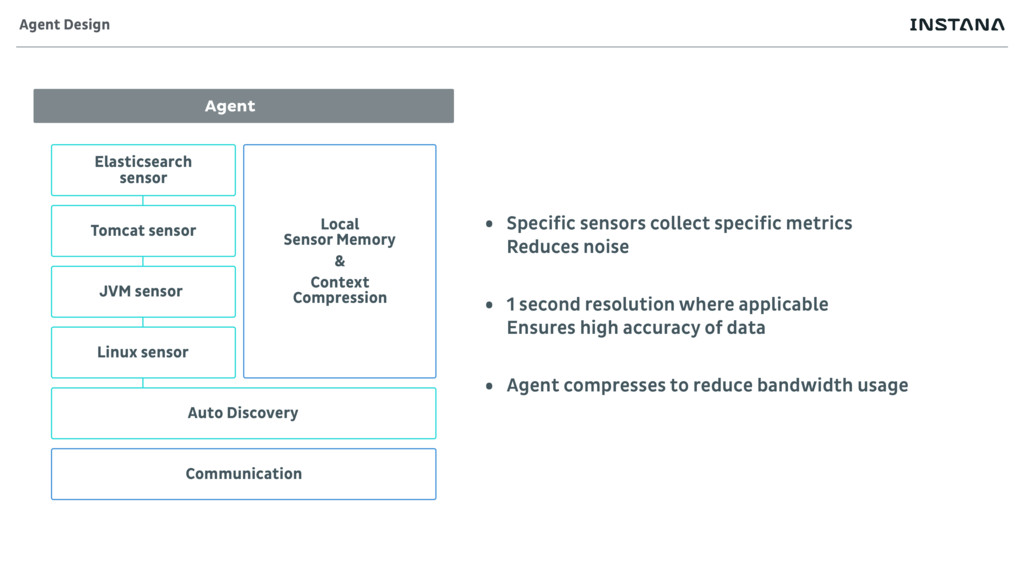
Discovery Communication Local Sensor Memory & Context Compression Agent Design • Specific sensors collect specific metrics Reduces noise • 1 second resolution where applicable Ensures high accuracy of data • Agent compresses to reduce bandwidth usage
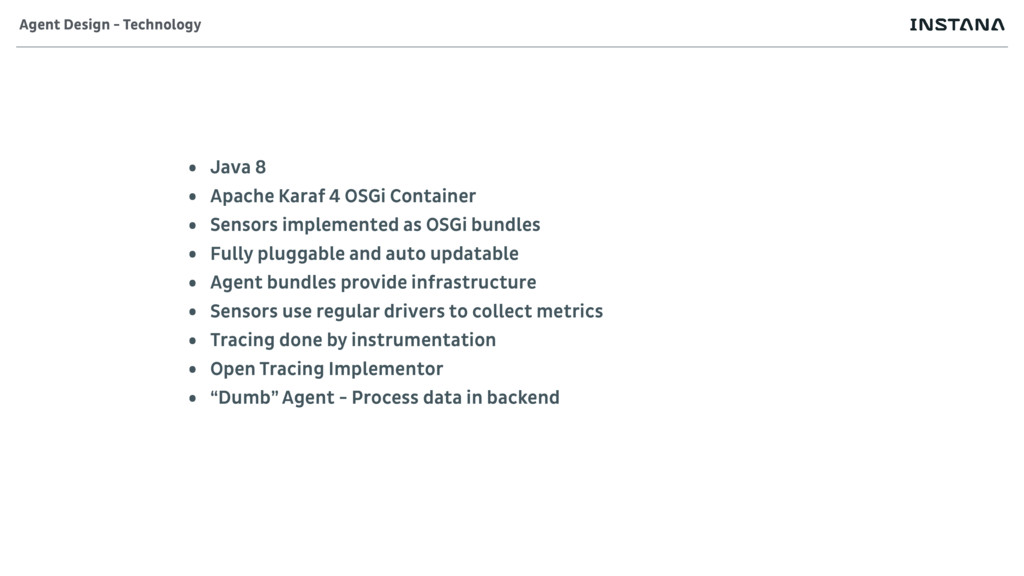
Sensors implemented as OSGi bundles • Fully pluggable and auto updatable • Agent bundles provide infrastructure • Sensors use regular drivers to collect metrics • Tracing done by instrumentation • Open Tracing Implementor • “Dumb” Agent - Process data in backend Agent Design - Technology
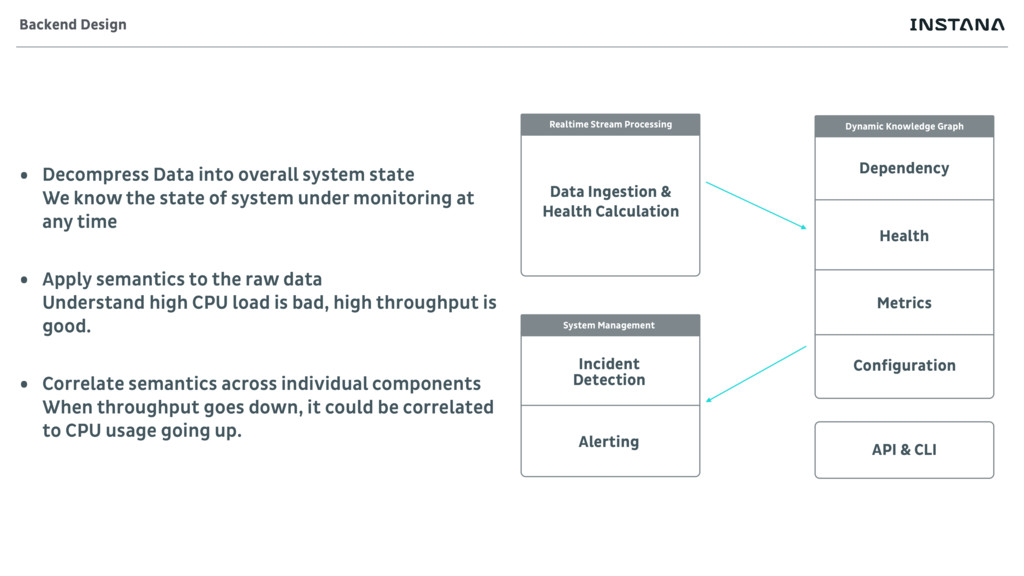
Alerting System Management Dependency Health Metrics Dynamic Knowledge Graph API & CLI Configuration Backend Design • Decompress Data into overall system state We know the state of system under monitoring at any time • Apply semantics to the raw data Understand high CPU load is bad, high throughput is good. • Correlate semantics across individual components When throughput goes down, it could be correlated to CPU usage going up.
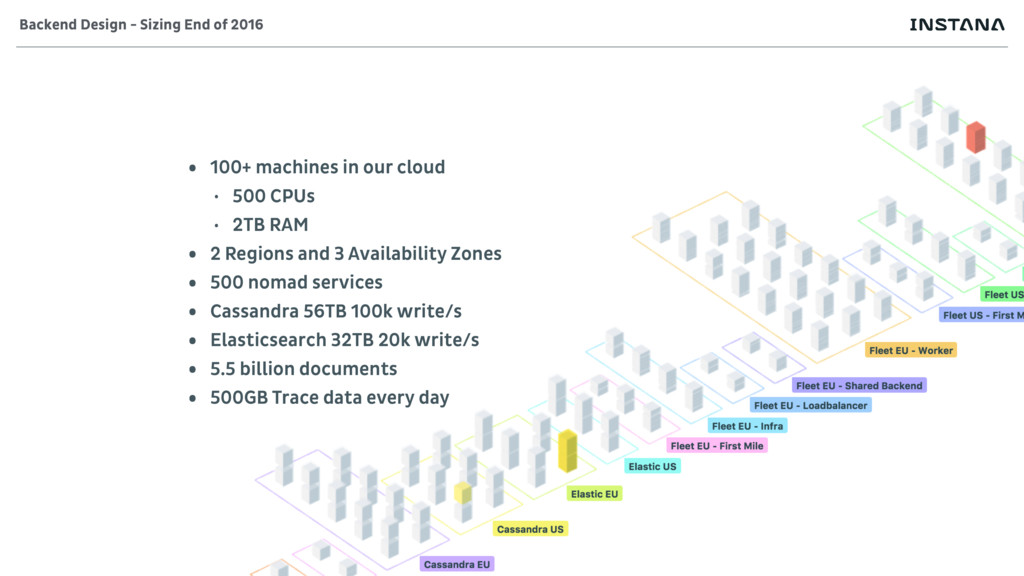
2TB RAM • 2 Regions and 3 Availability Zones • 500 nomad services • Cassandra 56TB 100k write/s • Elasticsearch 32TB 20k write/s • 5.5 billion documents • 500GB Trace data every day Backend Design - Sizing End of 2016
Service Health www.instana.com/blog/monitoring-microservices-part-ii-understand- analyze-derive-application-health • Focus on objectives of services www.instana.com/blog/managing-quality-service-part-management- service-quality-model Further reading
obvious and non-sensical • Do not read from a database • Processing live data is much faster • RAM is cheap • Optimize your code regularly • Stream processing big data has high multipliers Take-Aways