Upgrade to Pro — share decks privately, control downloads, hide ads and more …

Structured Logging to supercharge your Dashboards & Alerts

Structured Logging to supercharge your Dashboards & Alerts

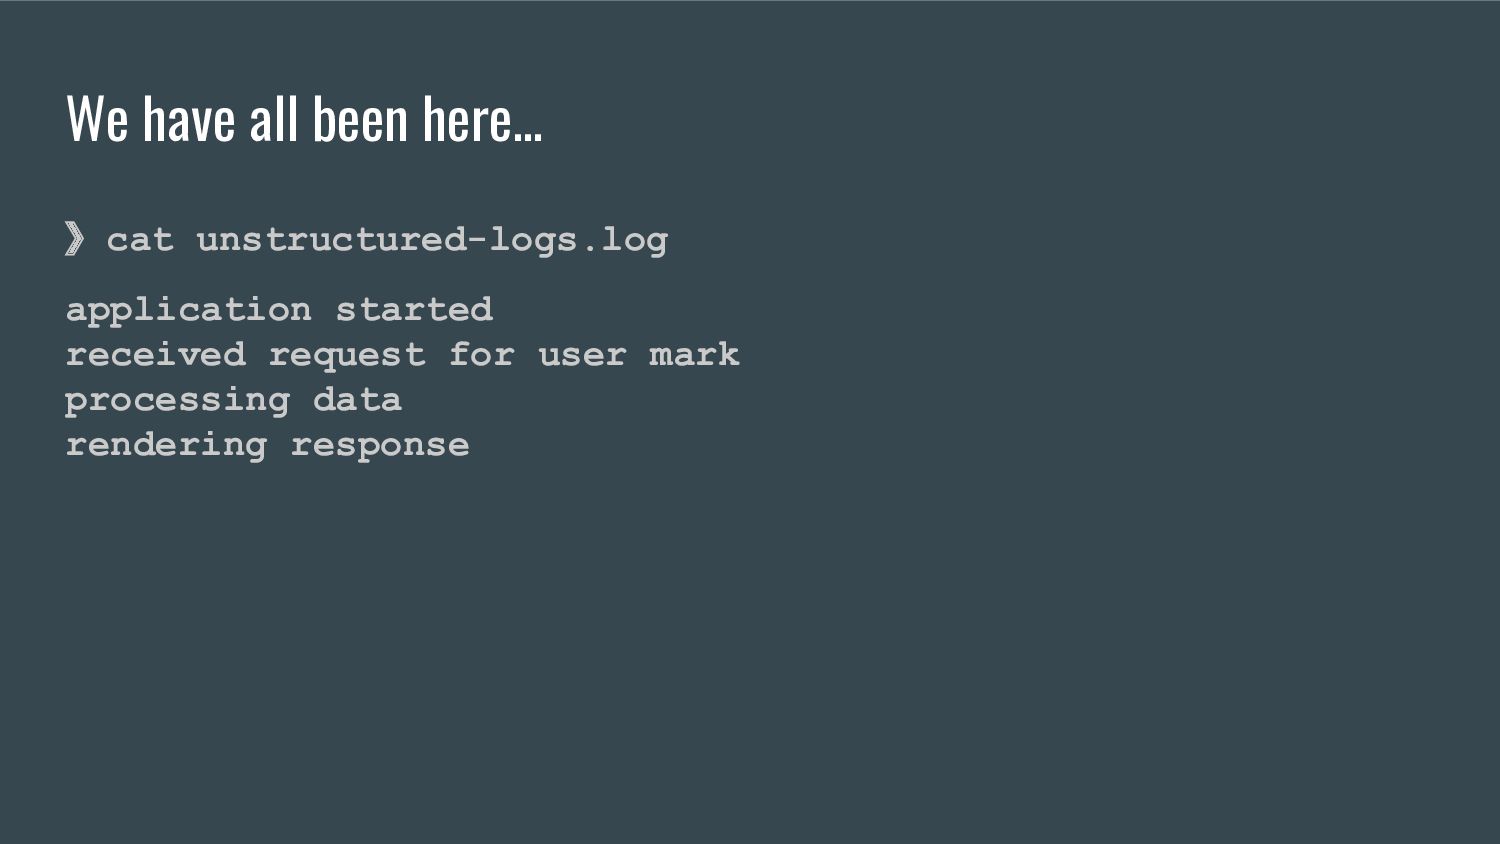
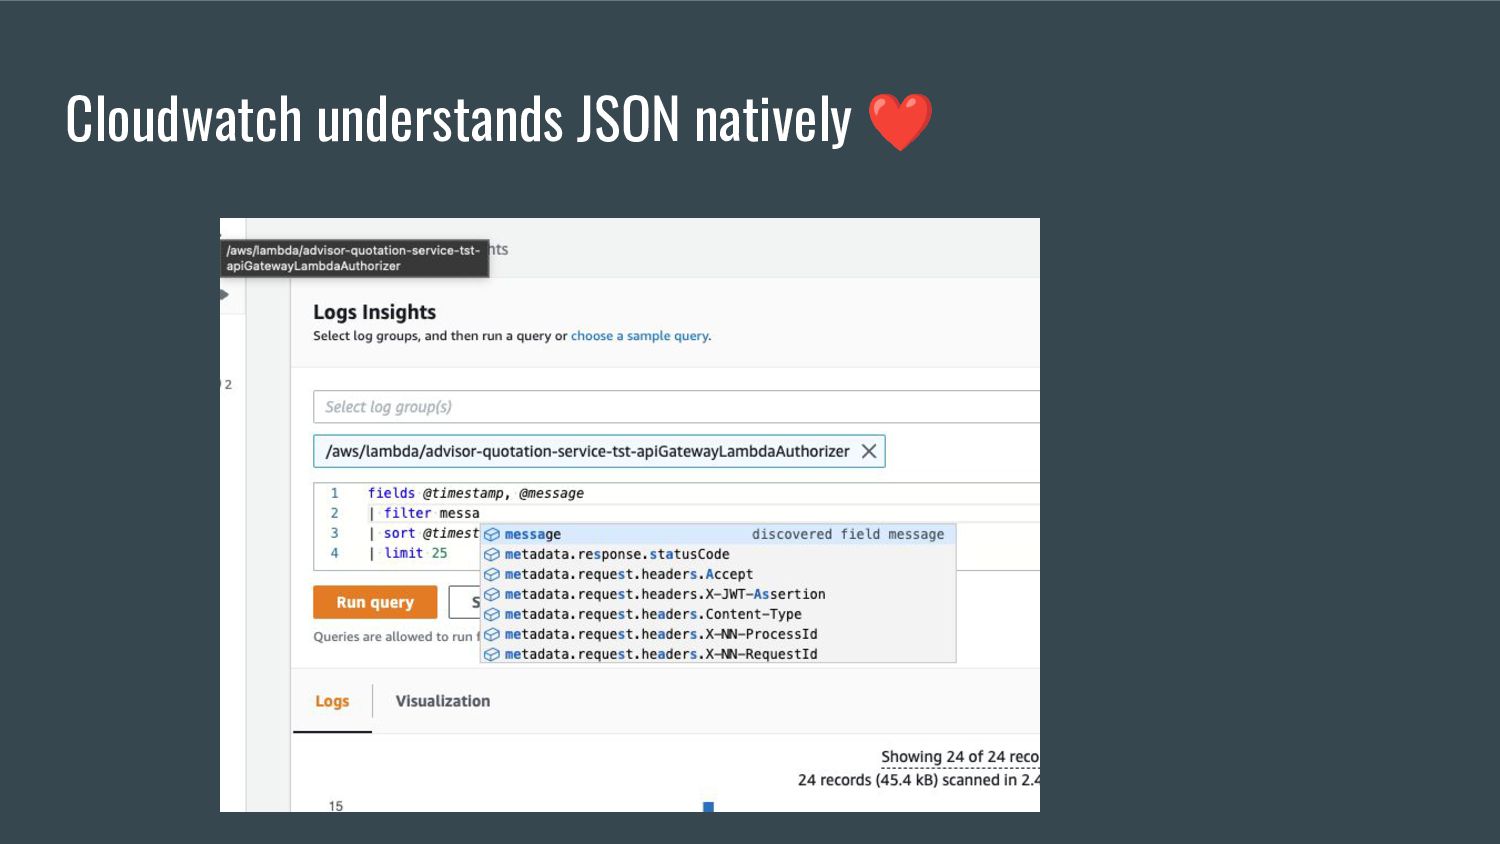
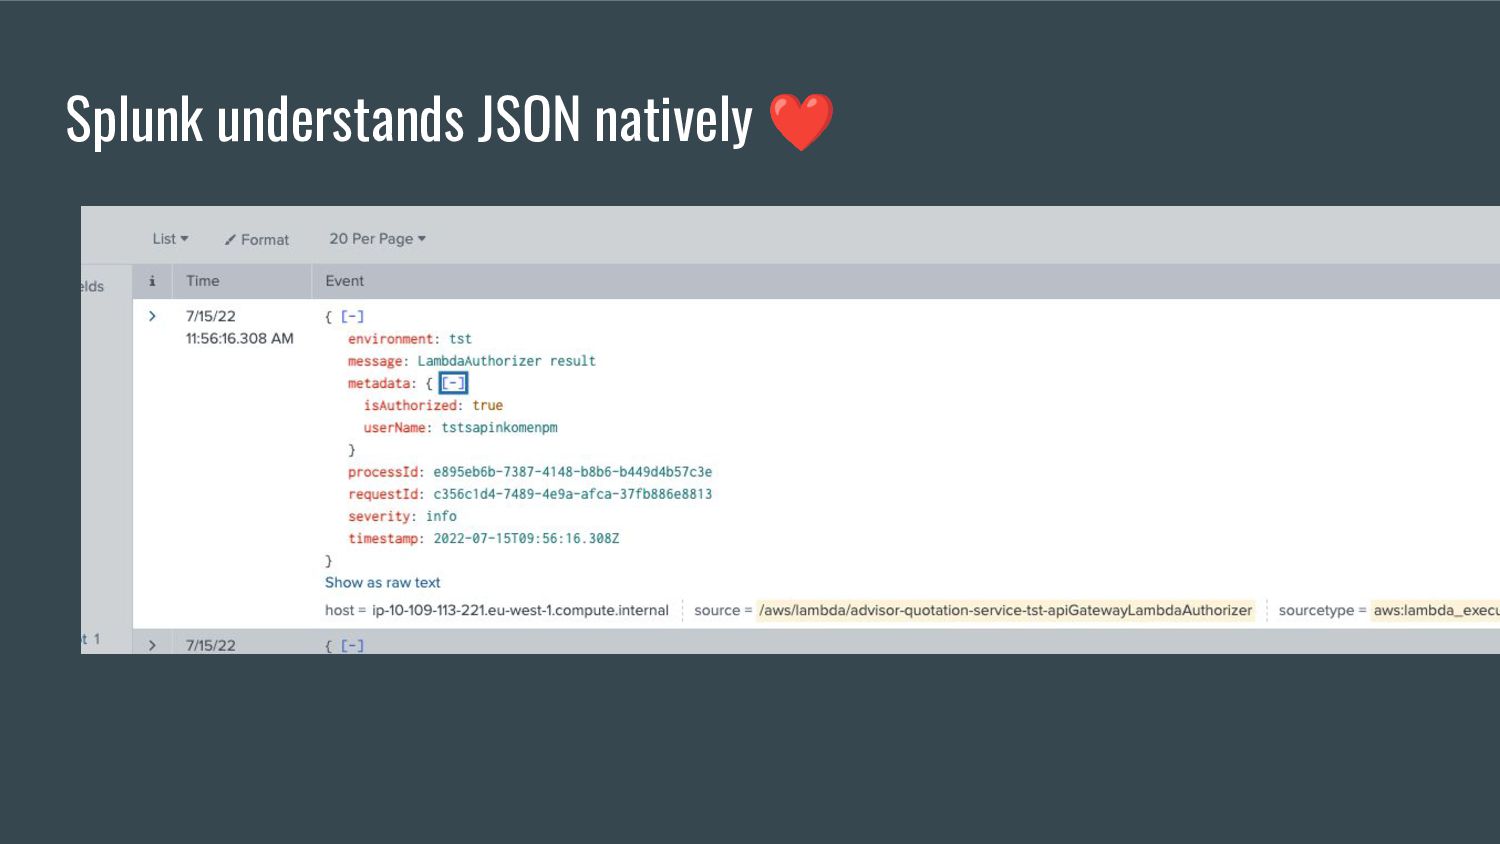
While most applications can default emit basic logs they are difficult to use and unlock their true power. Some tooling exists to handle this like logstash but why not start with the power and emit fully structured JSON logs instead?

Mark van Straten

June 01, 2022
Tweet

More Decks by Mark van Straten

Other Decks in Programming

Transcript

  1. We have all been here… ❯ cat unstructured-logs.log application started

    received request for user mark processing data rendering response
  2. The semi-industry-standard: Mediocre structured logs ❯ cat semistructured-logs.log 2022-07-15T10:02:55.646Z INFO

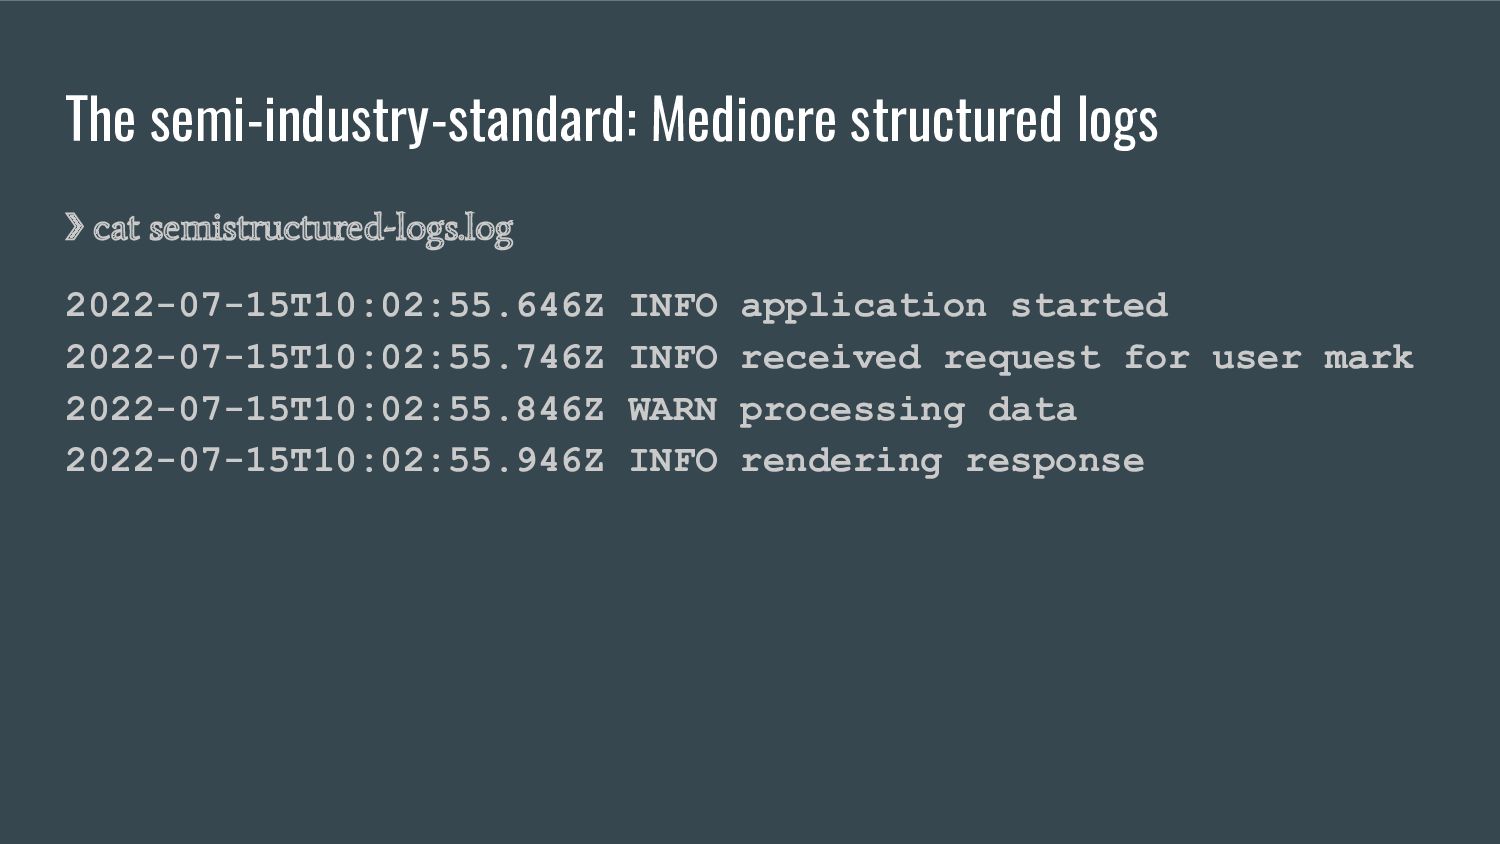
    application started 2022-07-15T10:02:55.746Z INFO received request for user mark 2022-07-15T10:02:55.846Z WARN processing data 2022-07-15T10:02:55.946Z INFO rendering response
  3. Challenges with this approach - Log parser needs to understand

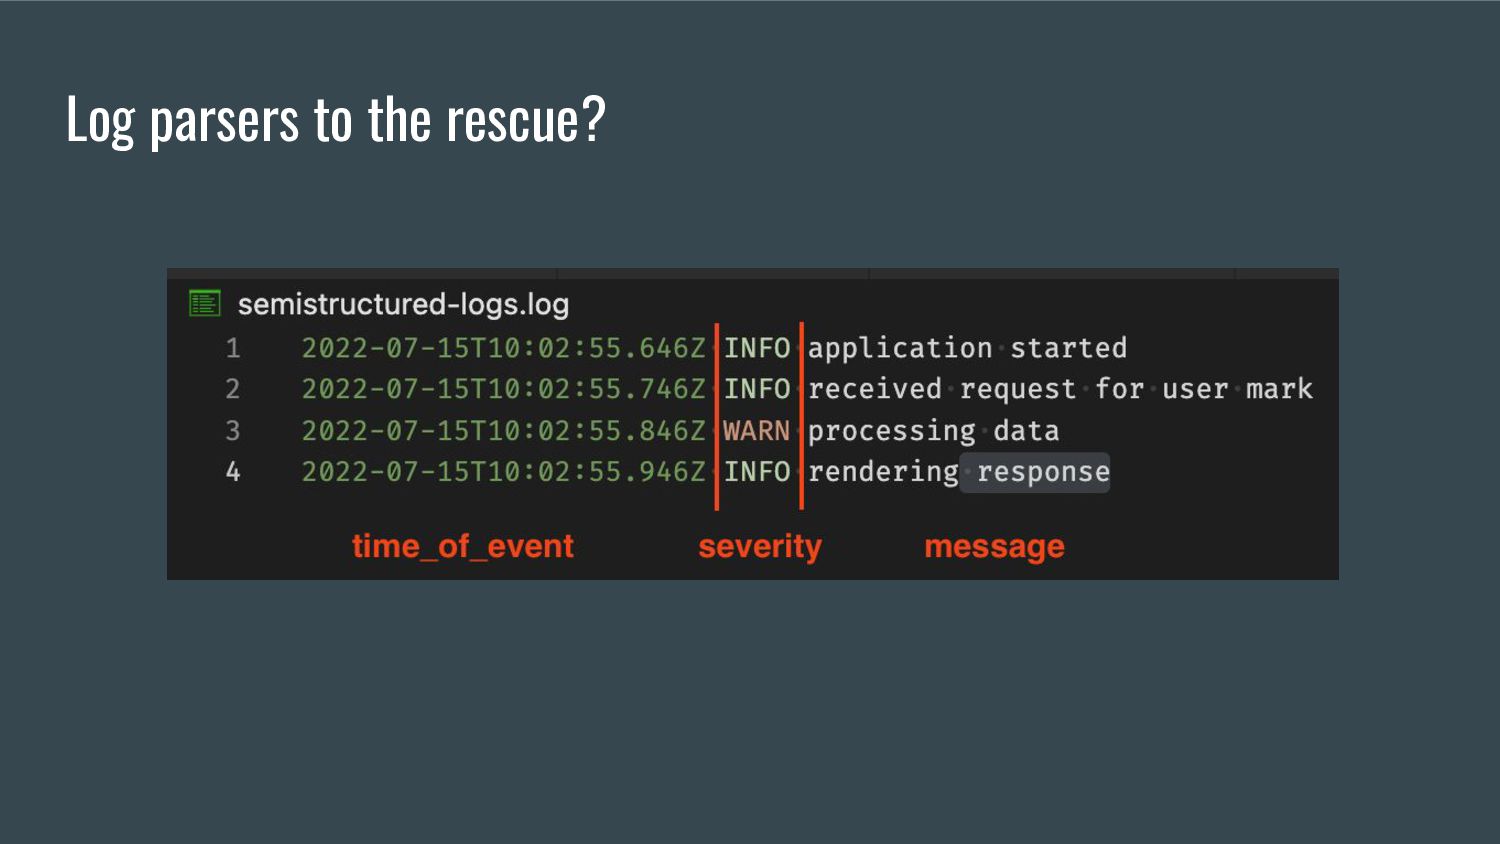
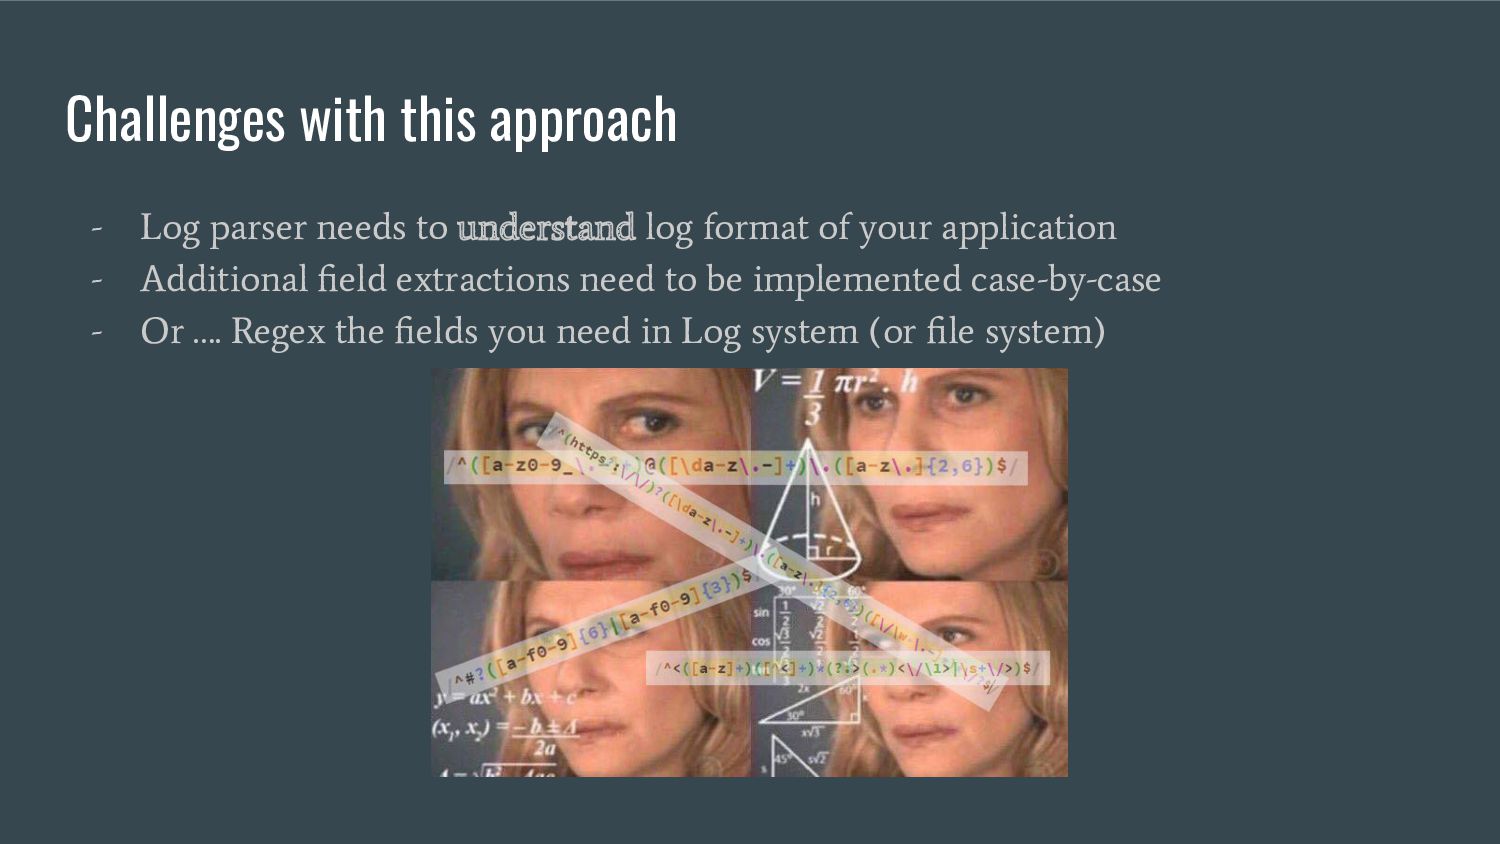
    log format of your application - Additional field extractions need to be implemented case-by-case - Or …. Regex the fields you need in Log system (or file system)
  4. Developer Experience: Splunk Querying Example log line: 2022-07-15T10:02:55.646Z INFO Request

    Executed https://some.url/foo/bar ResponseCode=200 RequestMethod=POST Splunk Query index=ops_nn_nl_cnc_zi_quotationplatform environment=* "Request Executed" | rex field=message "Request Executed (?<endpointUrl>.+) " | rex field=message "ResponseCode=(?<responseCode>.+) " | rex field=message "RequestMethod=(?<requestMethod>.+) " | eval endpointMethodResponse=endpointUrl."::".requestMethod."::".responseCode | timechart count by endpointMethodResponse
  5. Introducing structured logging - Whole log line formatted as JSON

    - Use conventional fieldnames (severity, time, message ) - No intermediate system parsing/reformatting needed (but may do) Example { "severity": "info", "timestamp": "2022-07-15T09:55:57.003Z", "message": "LambdaAuthorizer result", "processId": "f470eaa5-cf38-4b45-91e9-6c288b1c4be9", "requestId": "ebfb396b-a2da-402a-bf09-dc61f355b483", "metadata": { "isAuthorized": true, "userName": "tstsapinkomenpm" } }
  6. Who does what? - Log format is structured by application

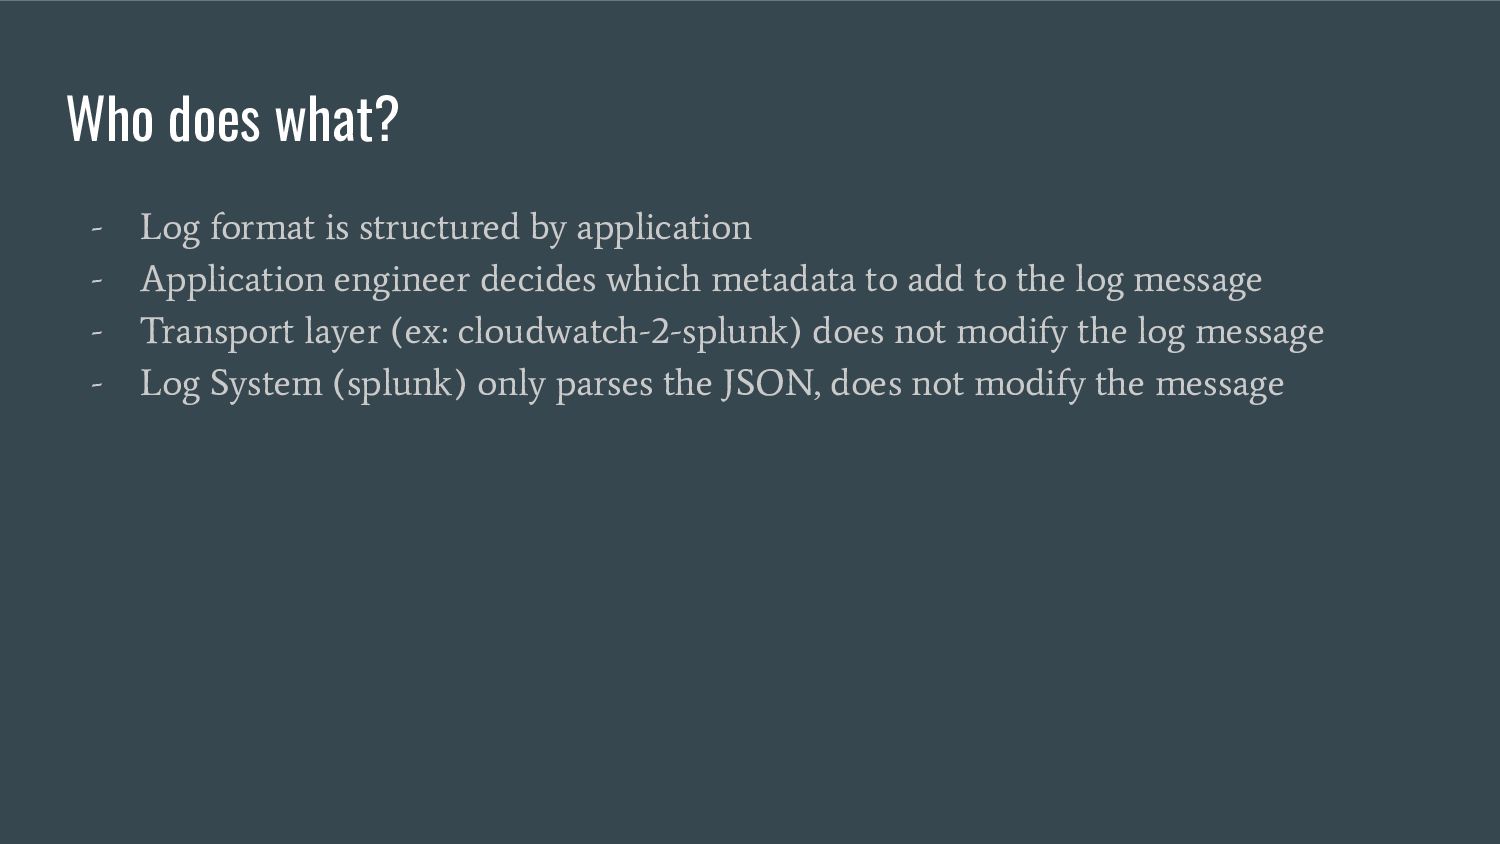
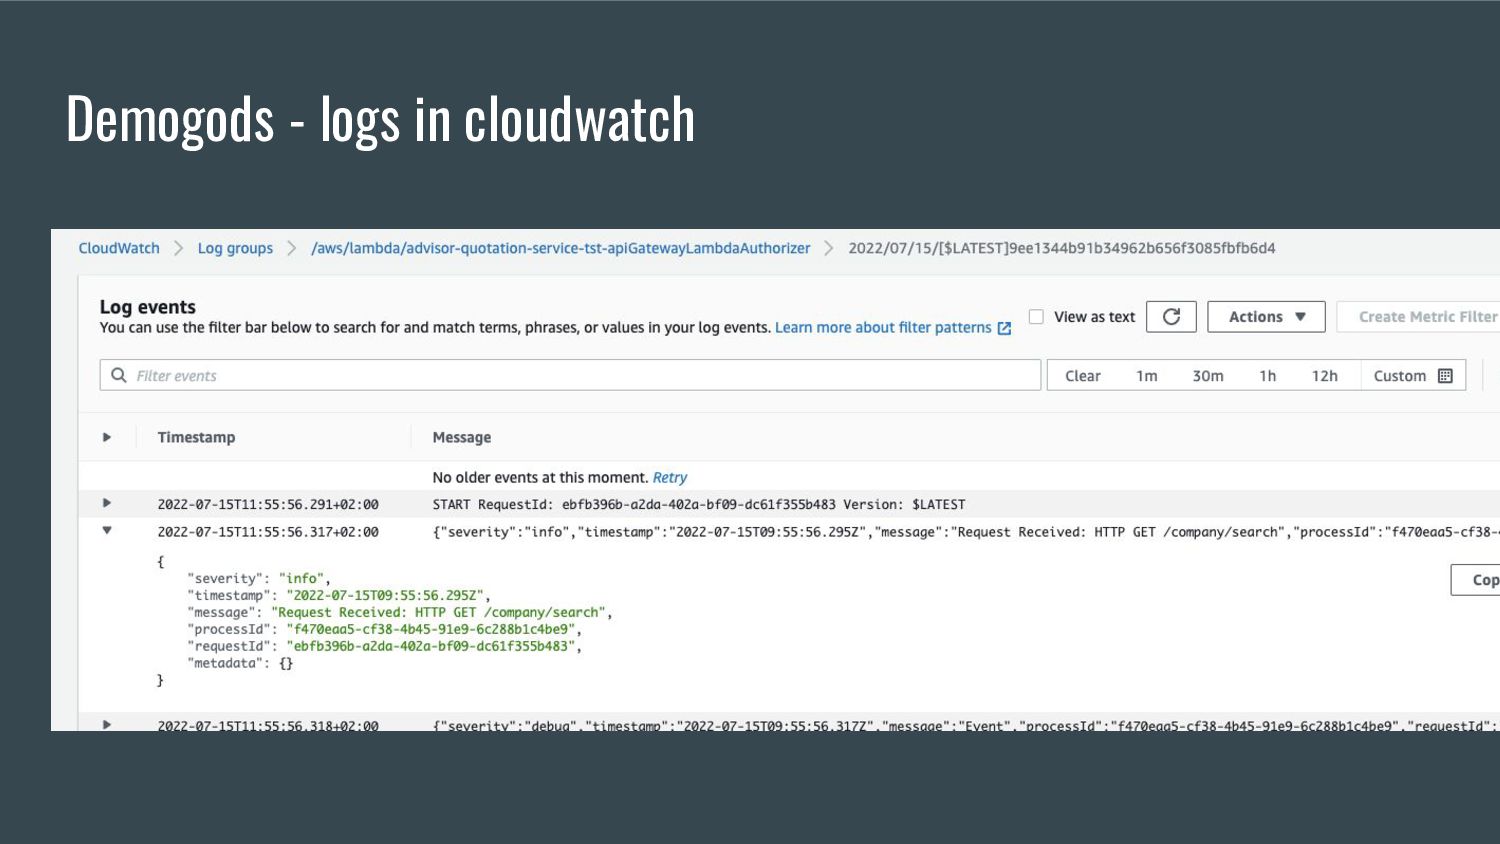
    - Application engineer decides which metadata to add to the log message - Transport layer (ex: cloudwatch-2-splunk) does not modify the log message - Log System (splunk) only parses the JSON, does not modify the message
  7. Child Loggers By introducing child loggers you can retain metadata

    and add to it what is relevant for your scope Akin to AWS x-ray ‘addSubSegment()’ const childLogger = logger.createChildInstance({ child: true })
  8. How to start using this? - New version of @nn-sls/core

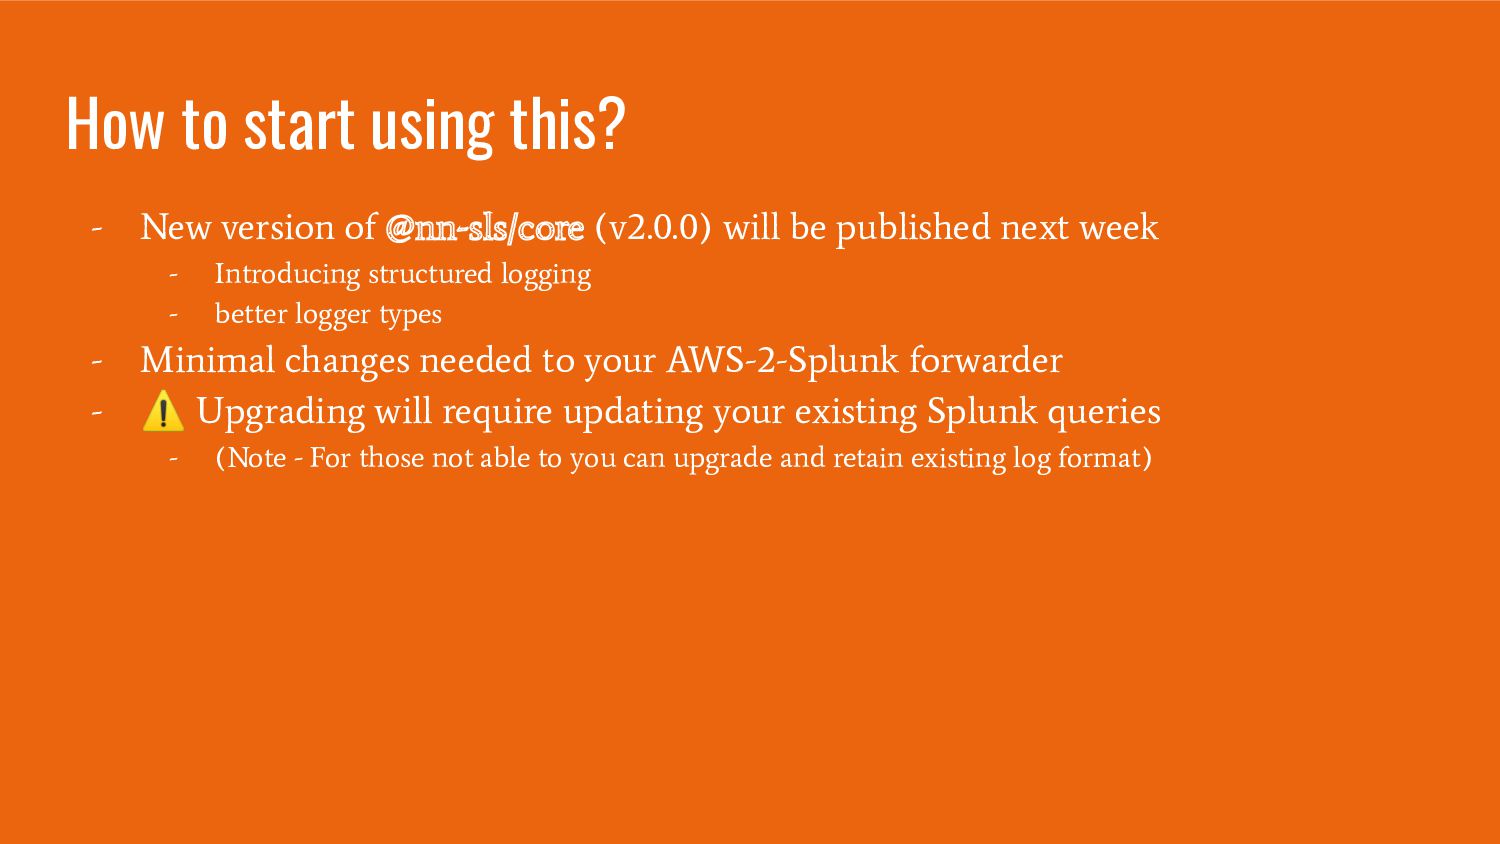
    (v2.0.0) will be published next week - Introducing structured logging - better logger types - Minimal changes needed to your AWS-2-Splunk forwarder - ⚠ Upgrading will require updating your existing Splunk queries - (Note - For those not able to you can upgrade and retain existing log format)
  9. How to start using this? - npm install @aws-lambda-powertools/logger -

    Its typescript! ❤ - More details https://github.com/awslabs/aws-lambda-powertools-typescript