The Production Possibly Curve - Opportunity Cost and Efficiency
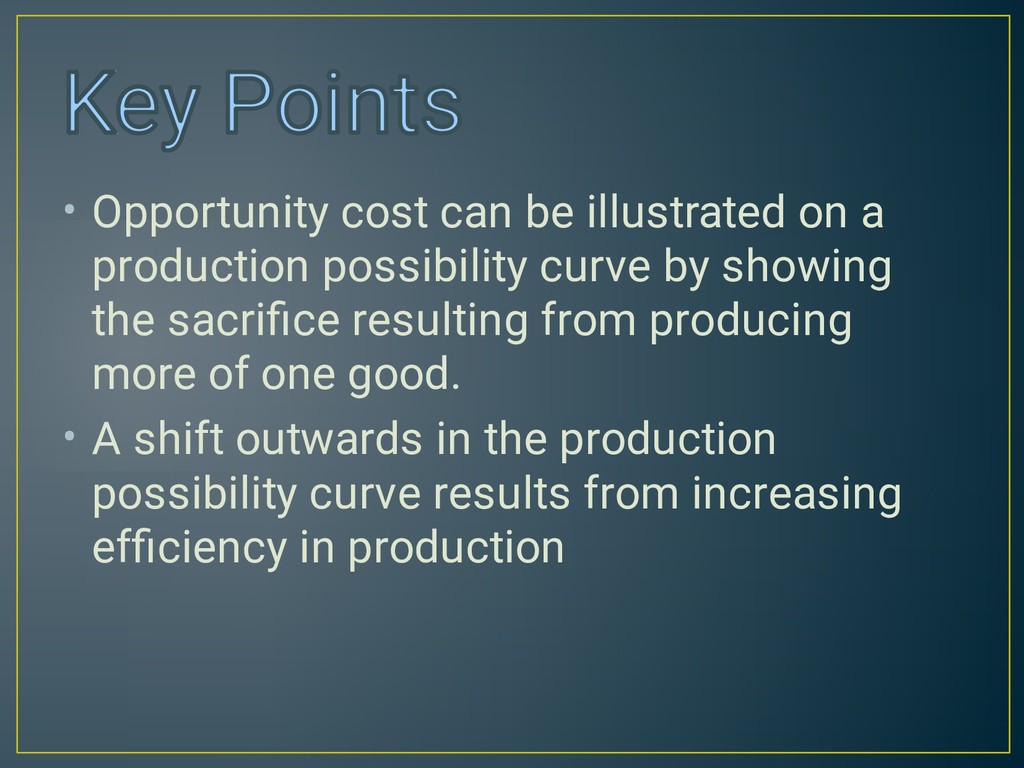
The concept of opportunity cost can be illustrated in the form of production possibility curves by showing the sacrifice resulting from producing more of one good.
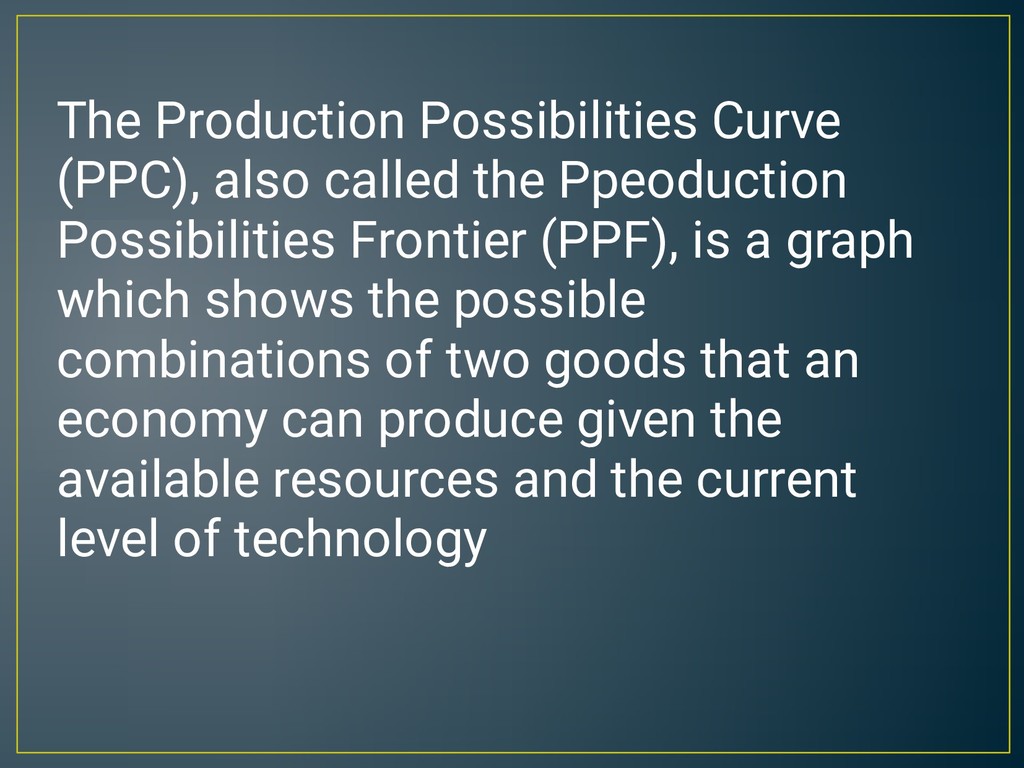
Frontier (PPF), is a graph which shows the possible combinations of two goods that an economy can produce given the available resources and the current level of technology
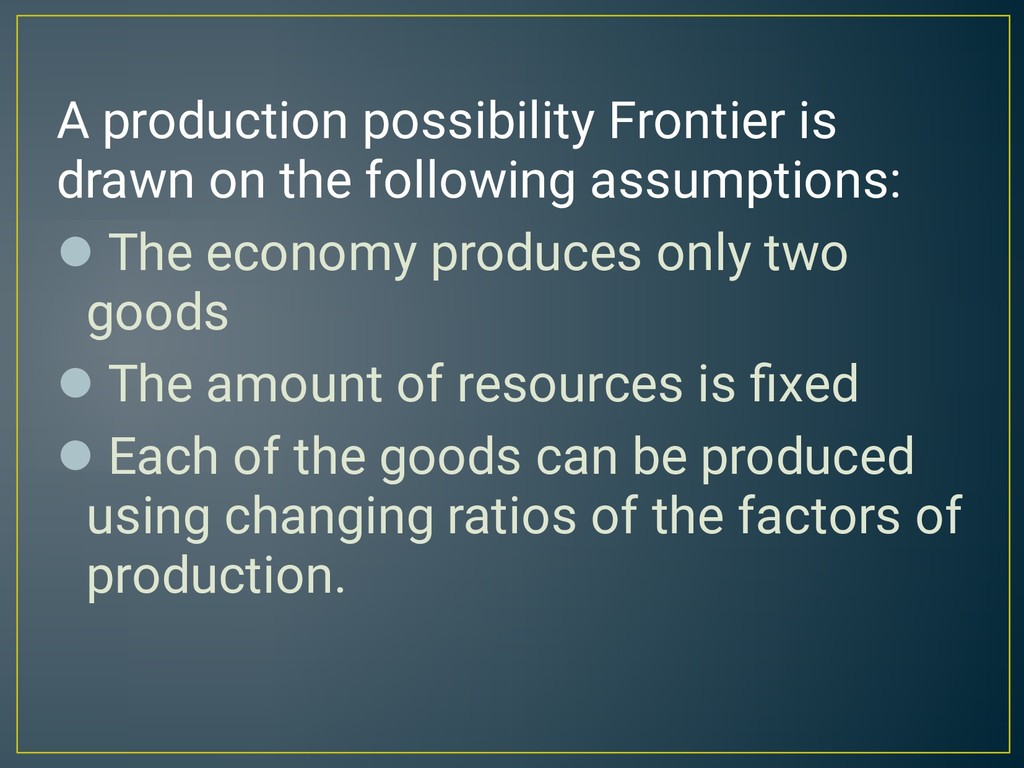
the following assumptions: The economy produces only two goods The amount of resources is fixed Each of the goods can be produced using changing ratios of the factors of production.
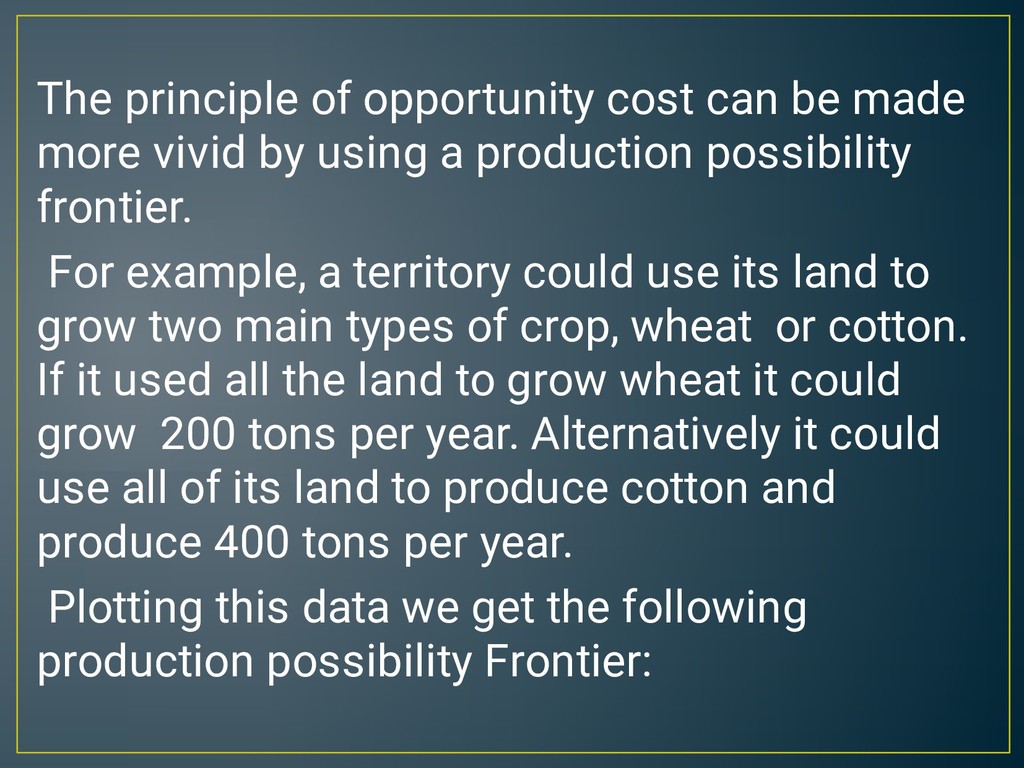
by using a production possibility frontier. For example, a territory could use its land to grow two main types of crop, wheat or cotton. If it used all the land to grow wheat it could grow 200 tons per year. Alternatively it could use all of its land to produce cotton and produce 400 tons per year. Plotting this data we get the following production possibility Frontier:
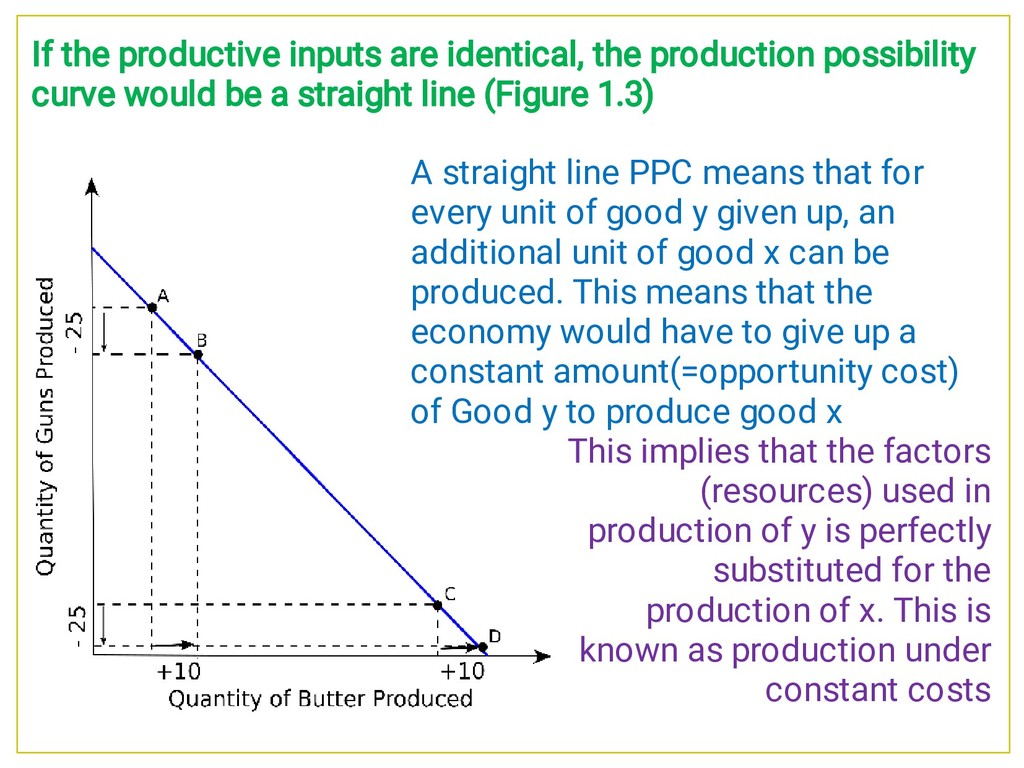
good y given up, an additional unit of good x can be produced. This means that the economy would have to give up a constant amount(=opportunity cost) of Good y to produce good x This implies that the factors (resources) used in production of y is perfectly substituted for the production of x. This is known as production under constant costs If the productive inputs are identical, the production possibility curve would be a straight line (Figure 1.3)
showing a straight line production possibility curve indicates Constant Opportunity cost. This means that: 1) If a constant amount of good 'x' is given up, a constant amount good 'y' can be produced 2) The resources employed to produce good x is perfectly suited to produce good 'y'.
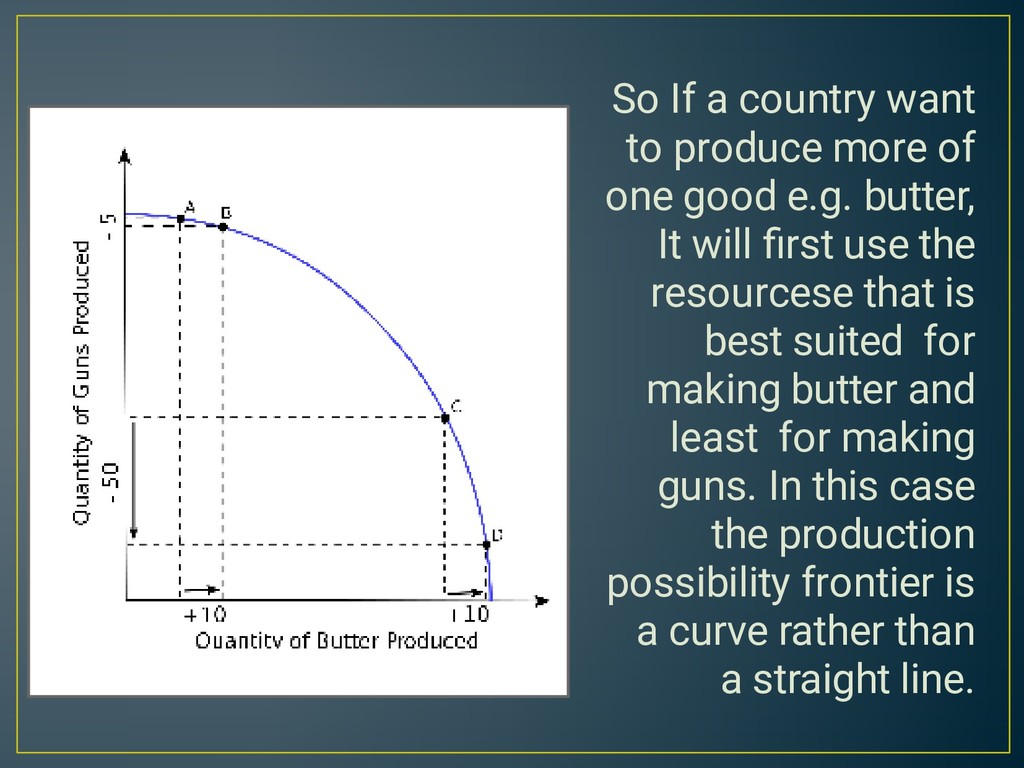
produce two different goods: Land is not identical. Some land is more suitable for growing one crop and some for another. Labour skilled in one area may not be skilled in a another area, e.g. a skilled chef is not suitable to do construction. Machines designed to make bricks are not suitable to make blocks.
good e.g. butter, It will first use the resourcese that is best suited for making butter and least for making guns. In this case the production possibility frontier is a curve rather than a straight line.
showing a curved production possibility curve indicates increasing opportunity cost. This means that: As the production of one good 'x' increases, a greater number of good 'y' is sacrificed. The nearer we are to the end of the curve the steeper it is, because to grow more of one crop will involve a greater sacrifice of the other. Eg The more bananas we grow, the larger the reduction on sugar output required to produce a few more. bananas.
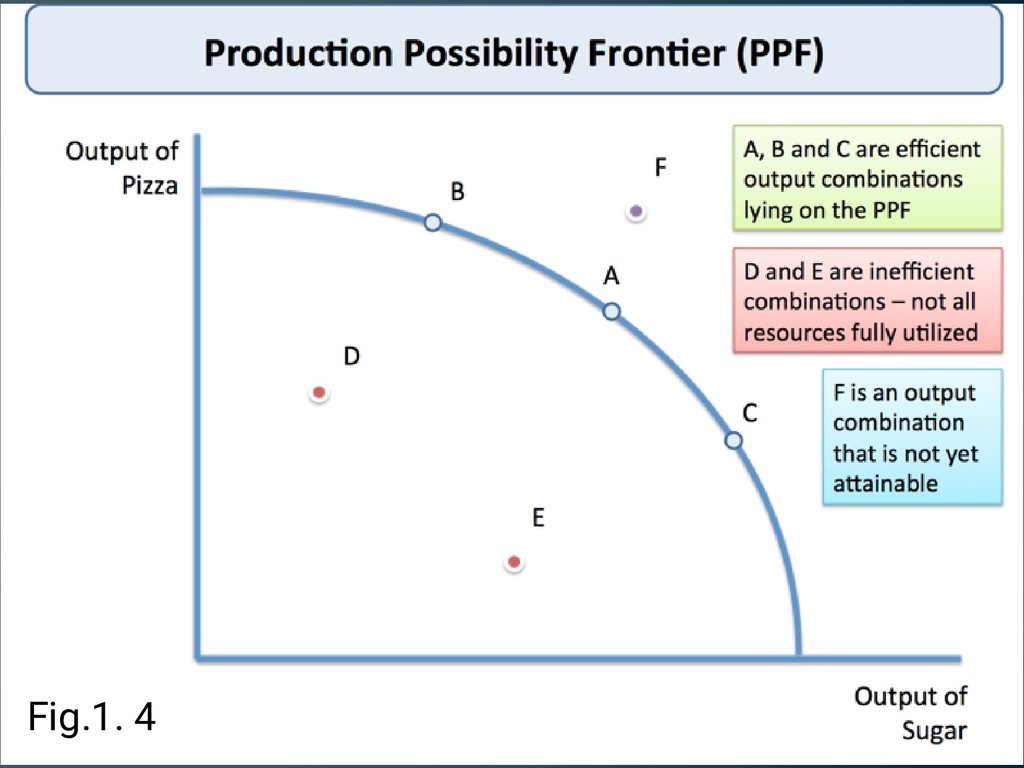
of two goods assuming that all resources are being fully employed. For example, the production possibility curve shown in Figure 1.4 shows combinations of sugar and pizza output that could be produced assuming all resources are fully employed.
downward from left to right. This indicates that it is only possible to produce more of one good by giving up some units of the other good. As resources are moved away from Pizza production, more and more sugar must be given up to produce extra Pizza Any point on the curve such as; A, B, or C or any point within the curve for example D and E is an attainable combination that the economy can produce.
inside the boundary such at such as at point E or D this indicates that there are idle resources, or that resources are beare not being used efficiently. If the economy increases efficiency by fully utilizing all its resources a movement from point D to the frontier will result in economic expansion. Points outside the frontier, such as F, are unattainable therefore the economy cannot move from a point on the frontier, for instance, from Point A to F, where the economy is producing more of both goods using all its resources.
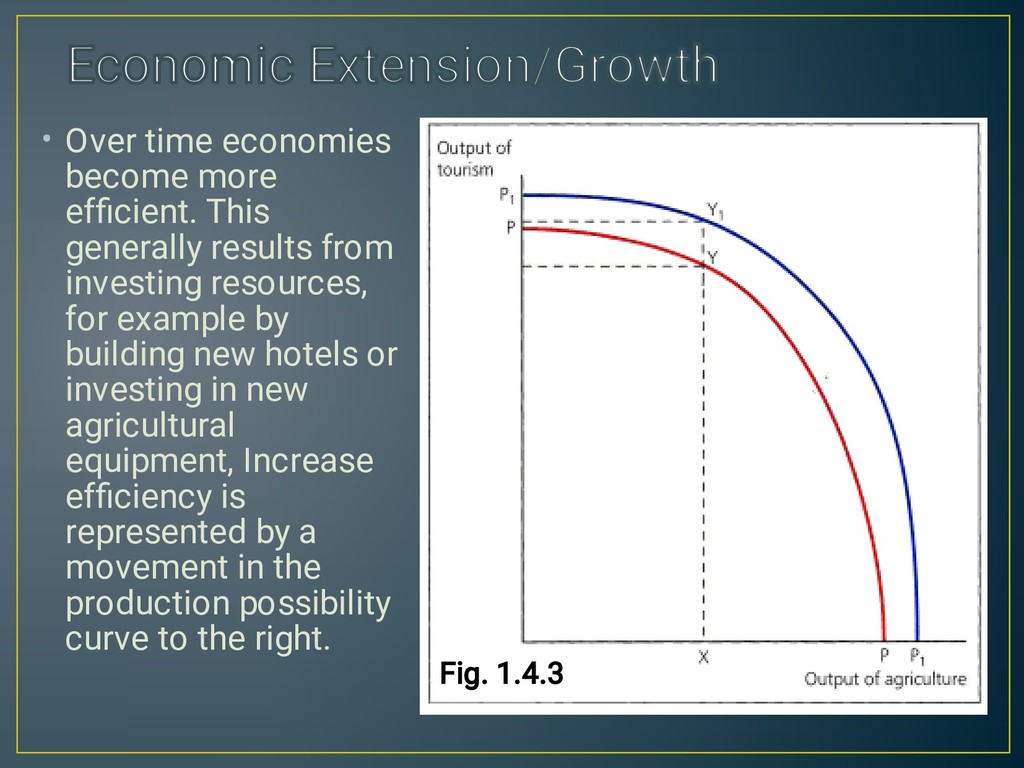
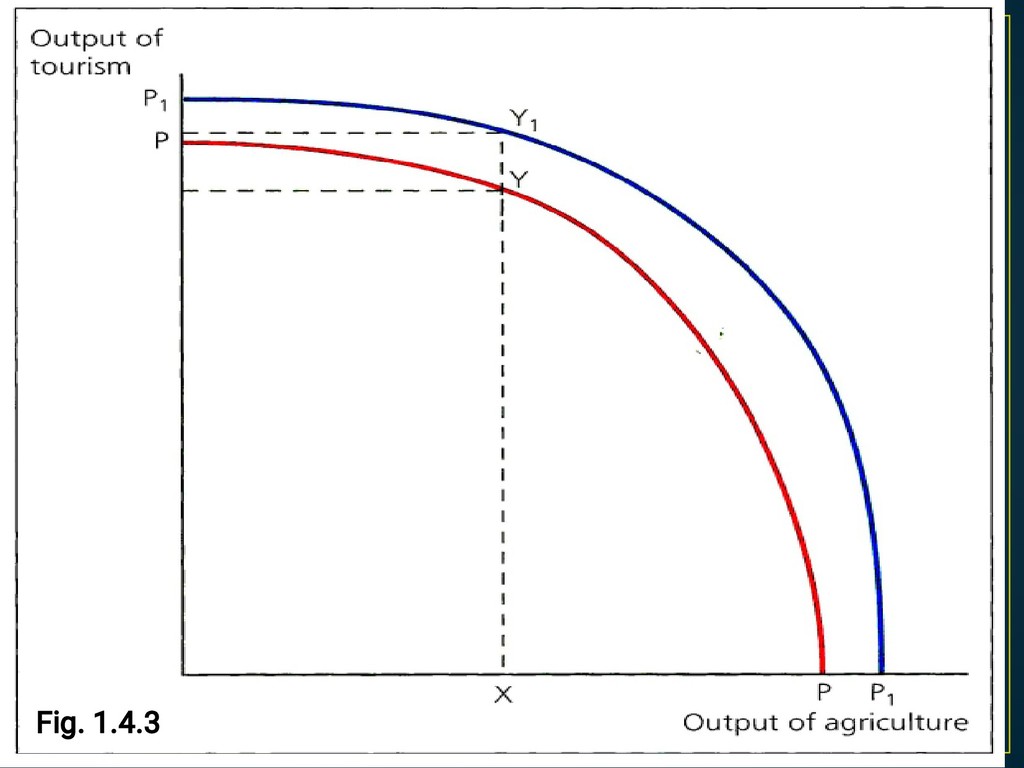
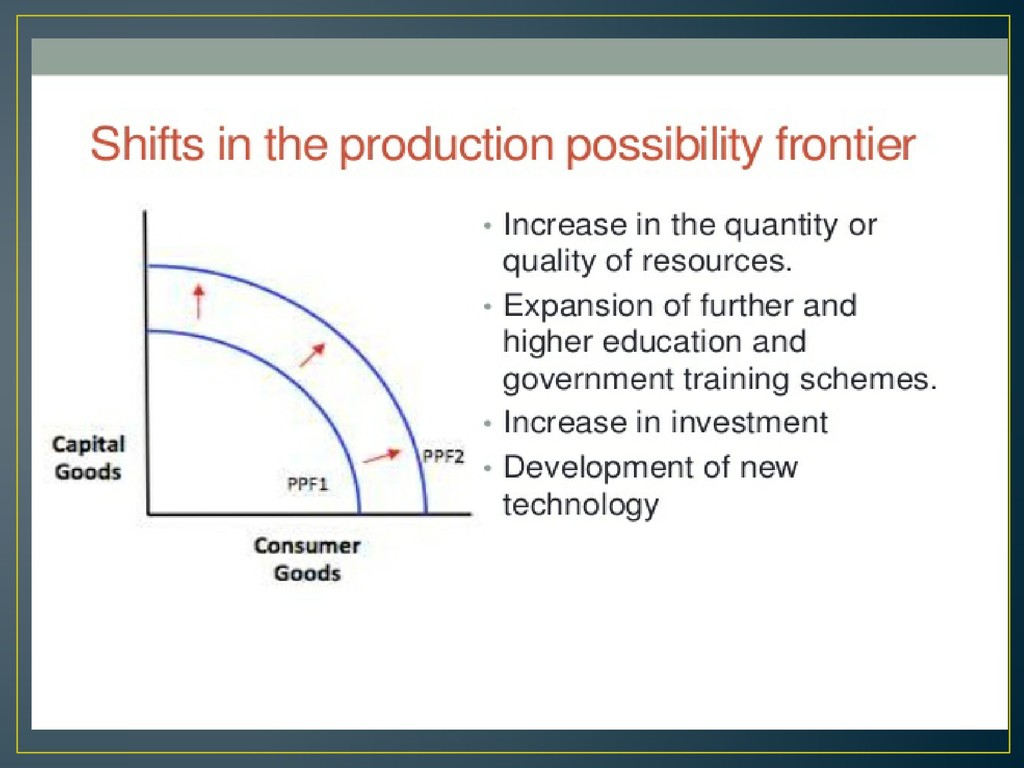
efficient. This generally results from investing resources, for example by building new hotels or investing in new agricultural equipment, Increase efficiency is represented by a movement in the production possibility curve to the right. Fig. 1.4.3
is represented by P1 To illustrate that P1 is more efficient, look at a point where 'x' of agricultural goods is produced. On P only Y" of tourism output can be produced. However, on P 'Y' of tourism output can be produced (Figure 1.4.3) The production possibility curve could also move from P1, to P. For example, the economy could become more inefficient as a result of a hurricane.
outwards are: Factors that could cause the production possibility Frontier to move outwards are: • • • • • economic growth Discovery of new natural resources Growth in population Technological progress Improvement in labor productivity
combinations of two goods that can be produced with existing resources. It can shift to the right when those resources become more efficient or there are more resources become more efficient or there are more resources. It will shift to the left if the resources become less efficient or there are fewer resources.
two goods an economy can produce with its existing resources and technology; an economy can produce at points on or inside its PPC but points outside the curve are unattainable full employment: points inside the PPC are inefficient and represent large scale unemployment because the economy could produce more of both goods while points on the PPC are efficient and consistent with full-employment of resources
out away from the origin because of increasing opportunity costs resulting from specialized resources (resources are not equally suited to producing all products) Shifts: the PPC will shift outwards reflecting an increased capability to produce goods and services when (1) there are increases in the quantity or quality of resources or (2) if there is technological improvement and in wards if there's economic decline caused by for example; natural disaster
illustrated on a production possibility curve by showing the sacrifice resulting from producing more of one good. A shift outwards in the production possibility curve results from increasing efficiency in production
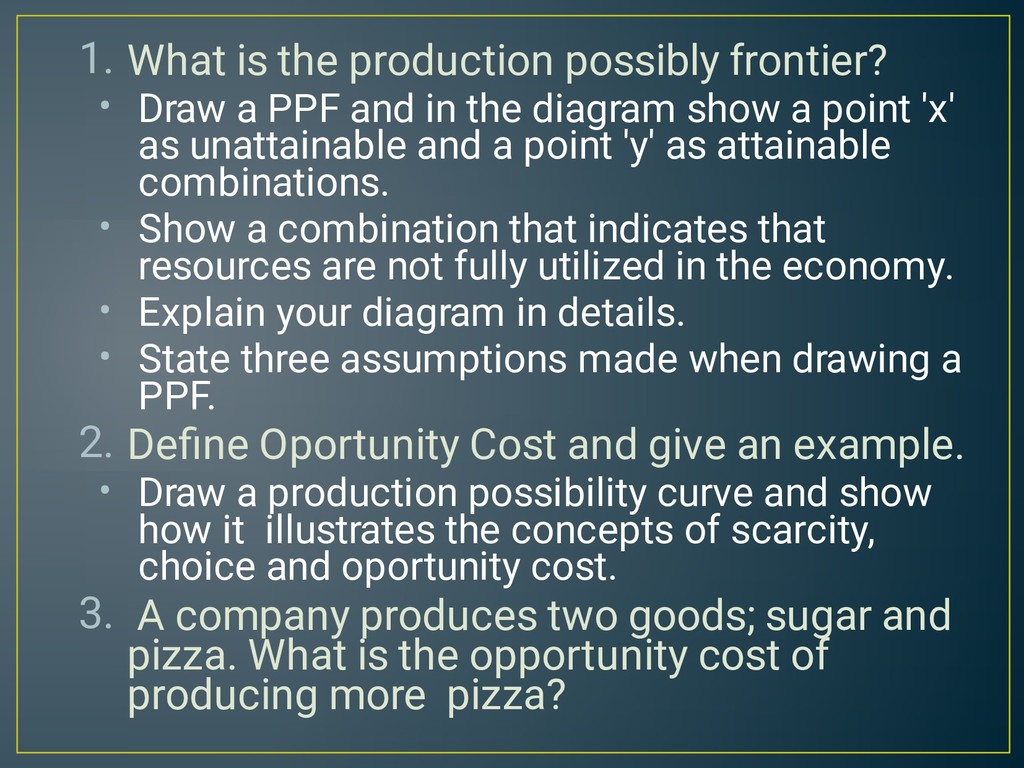
the production possibly frontier? Draw a PPF and in the diagram show a point 'x' as unattainable and a point 'y' as attainable combinations. Show a combination that indicates that resources are not fully utilized in the economy. Explain your diagram in details. State three assumptions made when drawing a PPF. Define Oportunity Cost and give an example. Draw a production possibility curve and show how it illustrates the concepts of scarcity, choice and oportunity cost. A company produces two goods; sugar and pizza. What is the opportunity cost of producing more pizza?
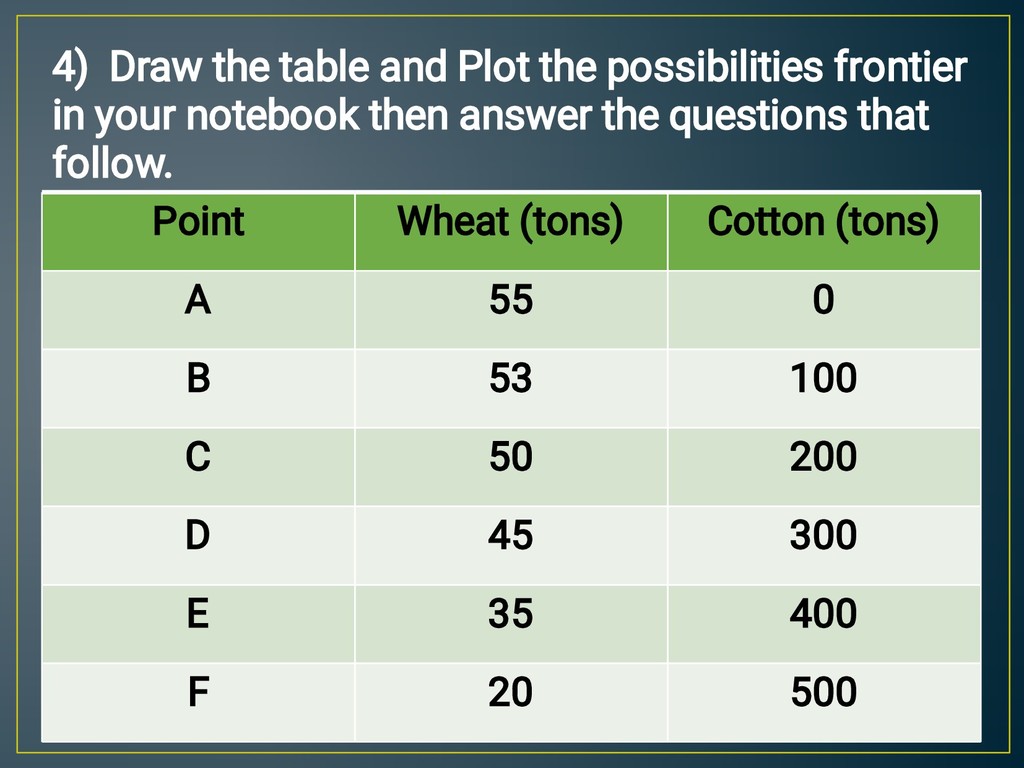
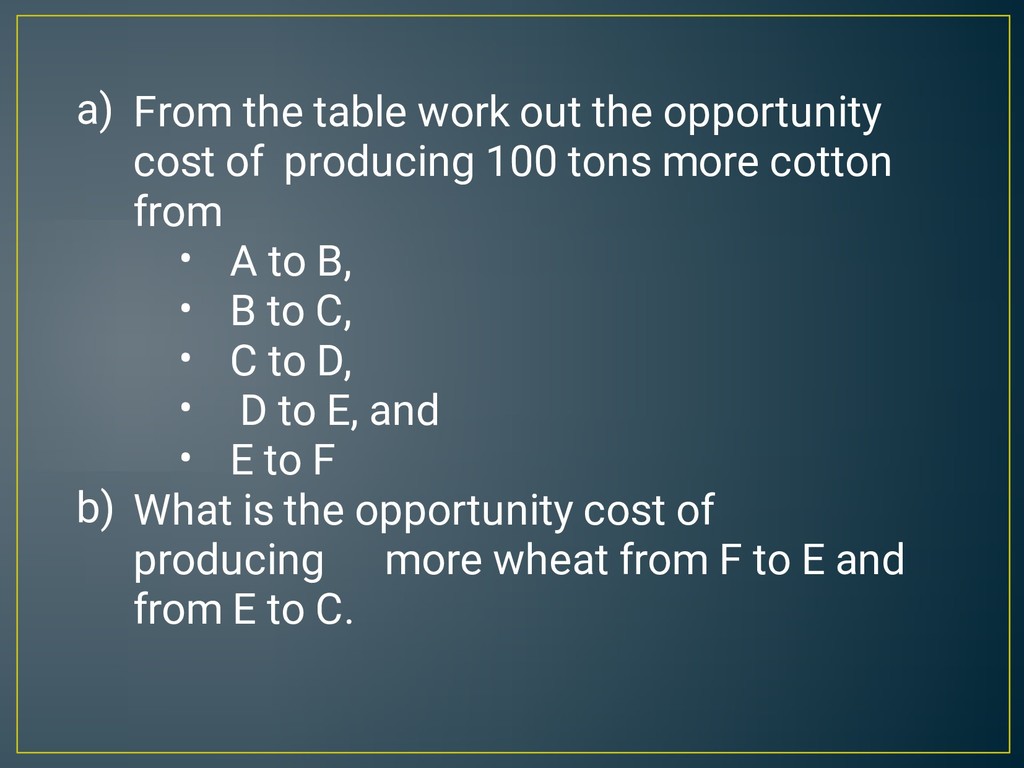
work out the opportunity cost of producing 100 tons more cotton from A to B, B to C, C to D, D to E, and E to F What is the opportunity cost of producing more wheat from F to E and from E to C.