of scarcity and choice within an economy. Define opportunity cost and money cost Understanding how to correctly use graphs to Illustrate economic concepts
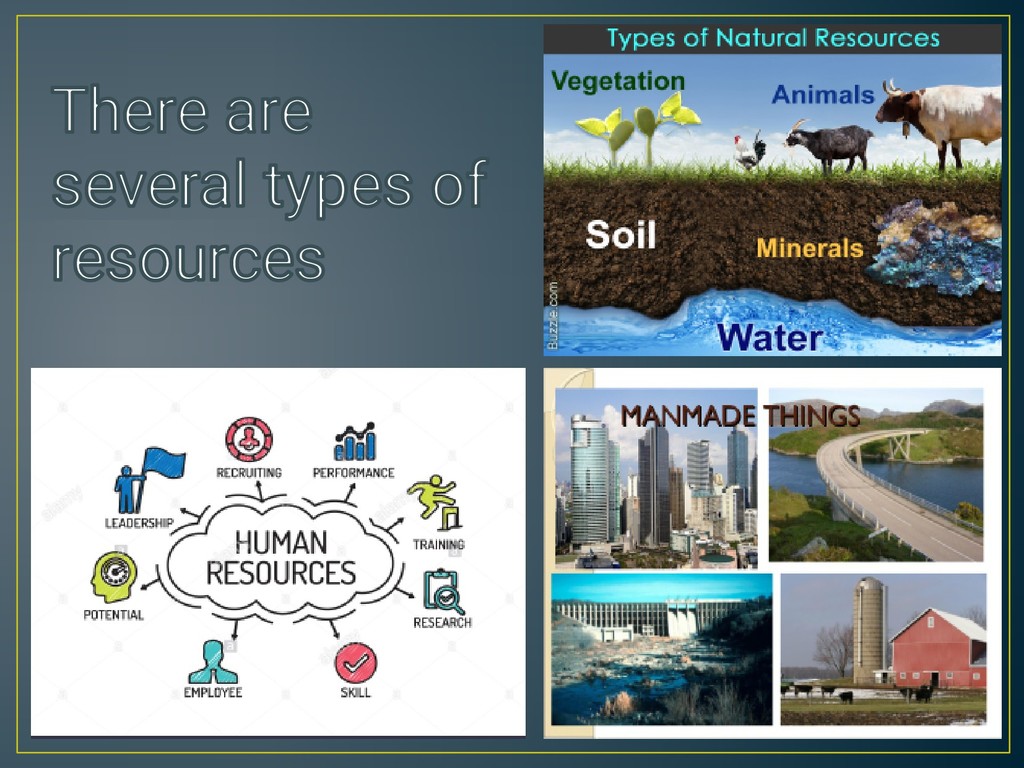
and choice • • Economists Talk of the basic economic problem There are Never Enough resources for everyone to have everything that they want. Choices have to be made. All the factors of production, that is; land, labour and capital are all limited. It is this lack of what is available, relative to that wanted, that leads to the reality of us all making choices
trade-off involves a sacrifice that must be made to get a certain product or experience. A person gives up the opportunity to buy 'good B,' because they want to buy 'good A' instead. For a person going to a baseball game, their economic trade-off is the money and time spent at the ballpark, as compared to the alternative of watching the game at home and saving their money, plus the time spent driving to the ball game.
with a new purchase how much did it cost? We are asking how much was paid for it that is the money cost. In economics we use a slightly different meaning to cost , economists believe that opportunity cost reviews the real cost of making a choice
a decision is the value of the next best alternative of this decision forces a person to do without. The monetary cost is the market price of the goods. The real cost of any choice is therefore the alternative that is sacrificed, i.e. what you give up to get what you want.
from scarcity. A shortage occurs when the demand for a good exceeds Supply this can be solved. Scarcity, however, will always exist because once will always exceed the availability of resources to satisfy them.
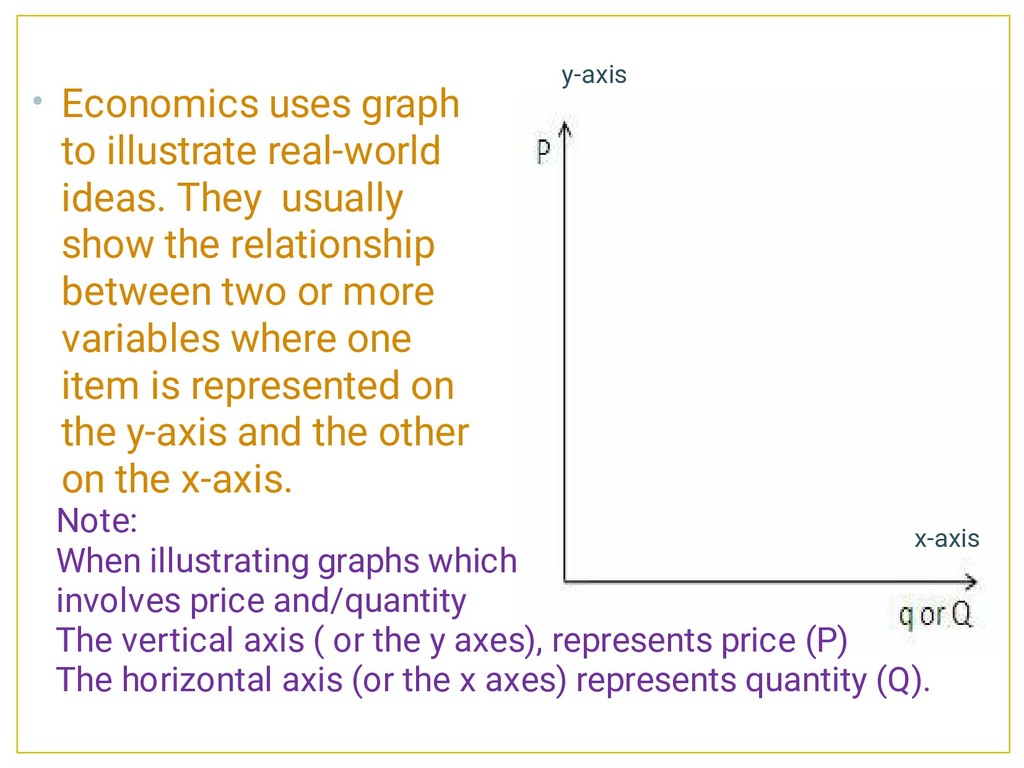
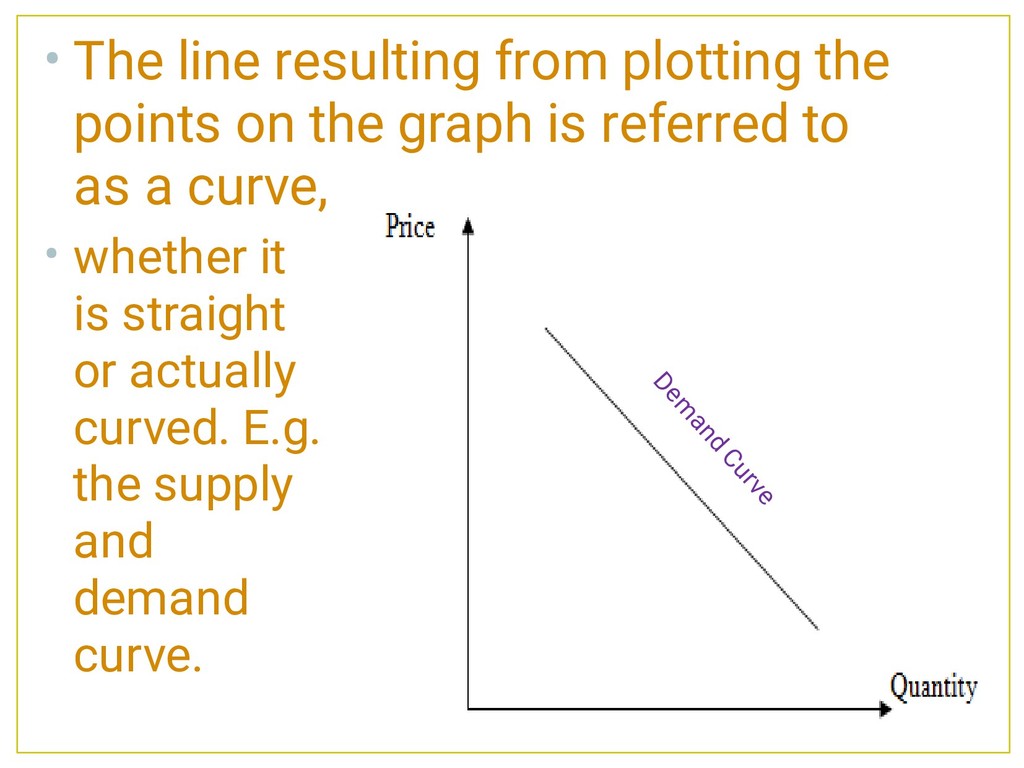
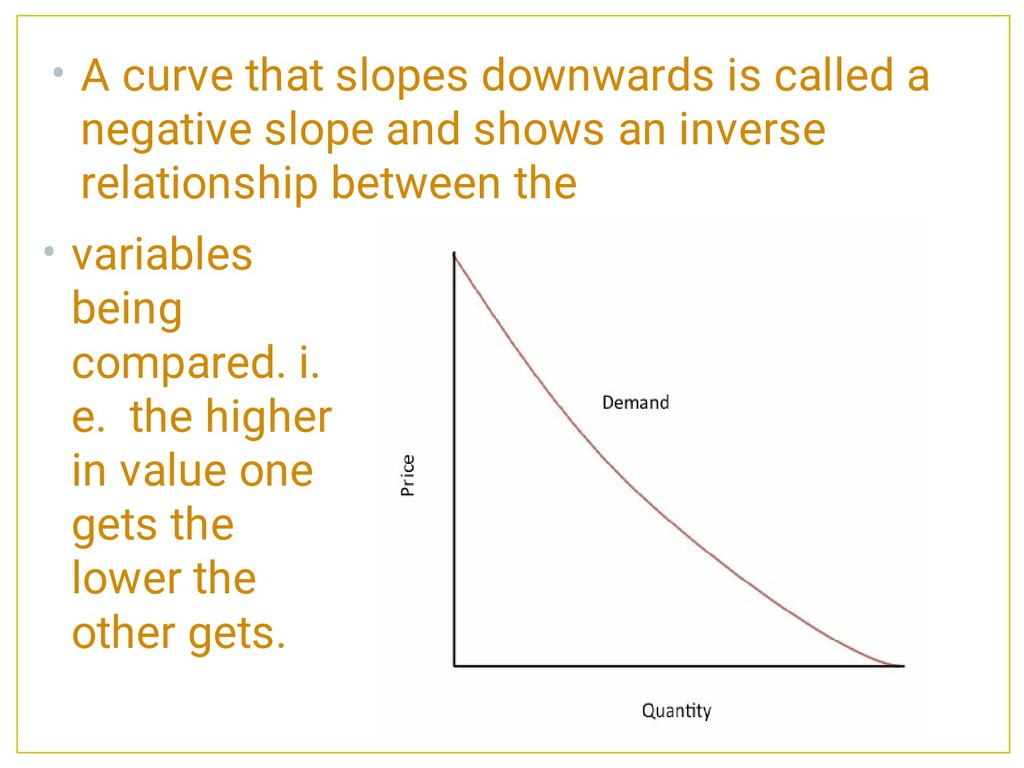
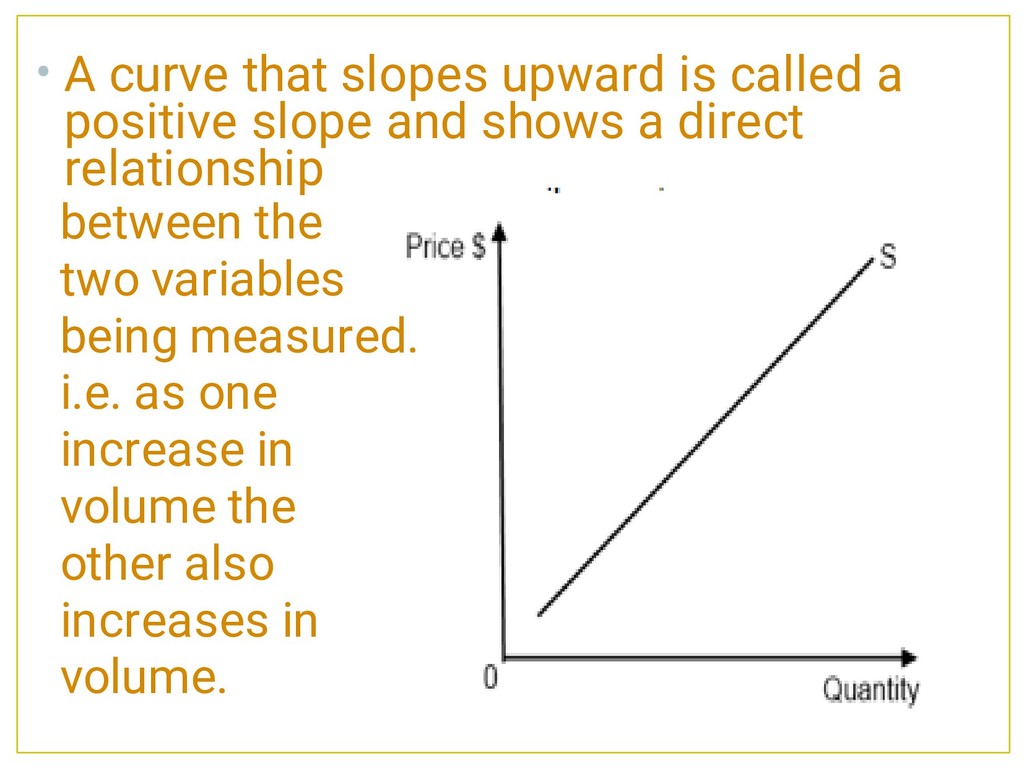
show the relationship between two or more variables where one item is represented on the y-axis and the other on the x-axis. Note: When illustrating graphs which involves price and/quantity The vertical axis ( or the y axes), represents price (P) The horizontal axis (or the x axes) represents quantity (Q). y-axis x-axis
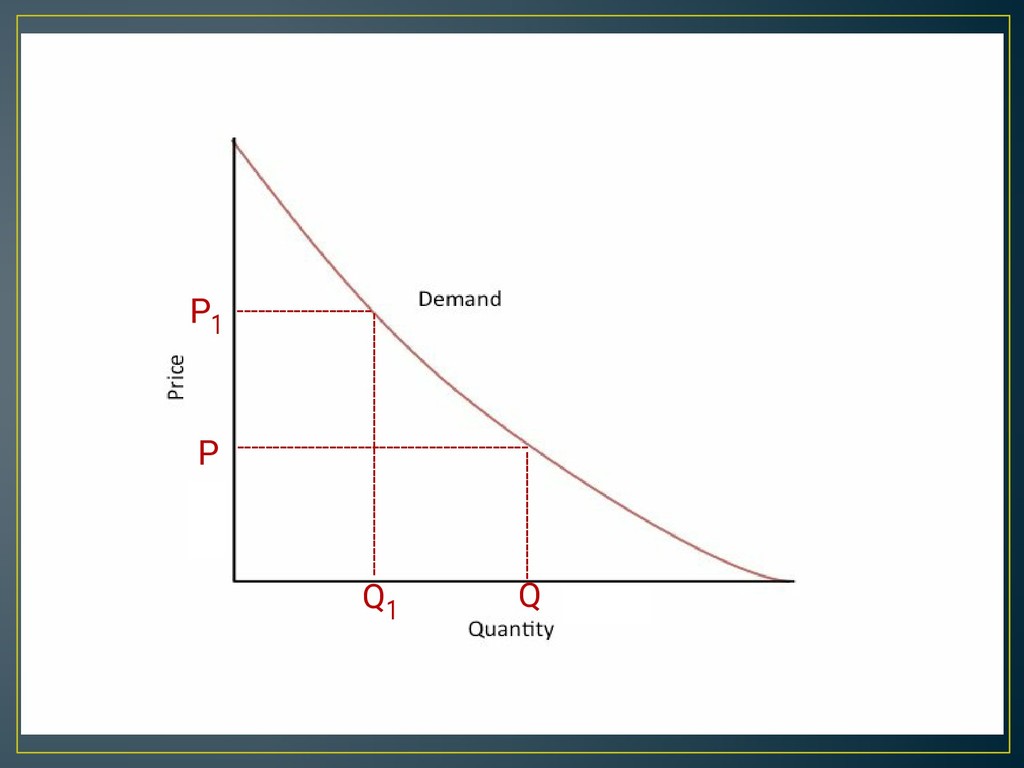
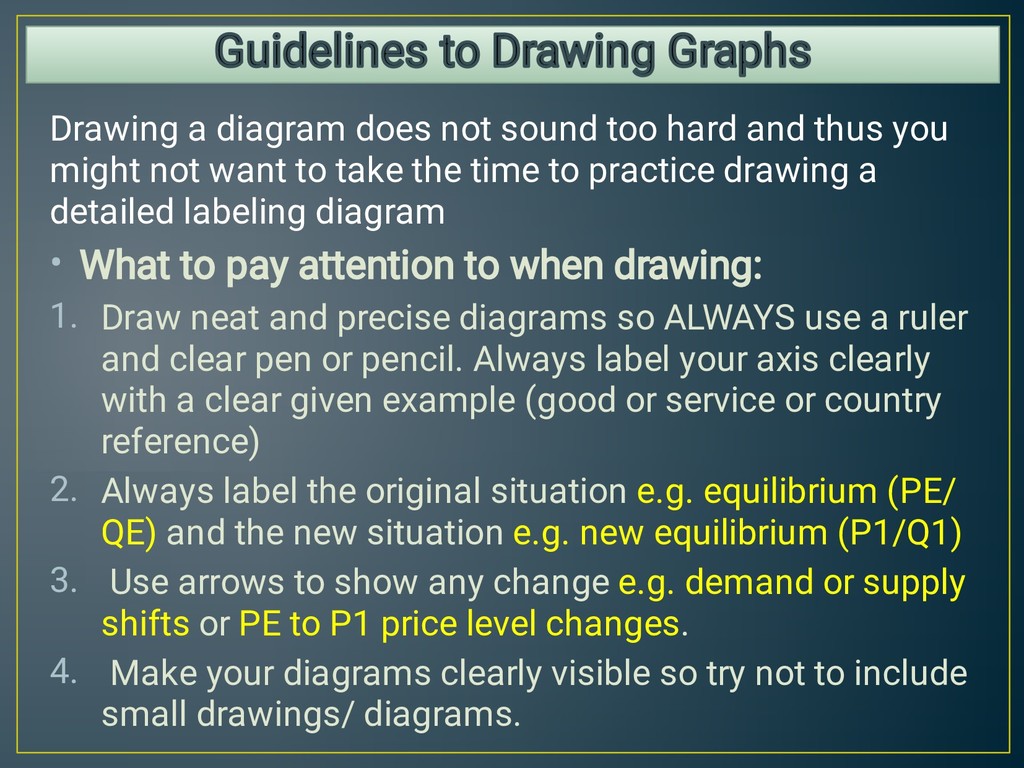
2. 3. 4. Drawing a diagram does not sound too hard and thus you might not want to take the time to practice drawing a detailed labeling diagram What to pay attention to when drawing: Draw neat and precise diagrams so ALWAYS use a ruler and clear pen or pencil. Always label your axis clearly with a clear given example (good or service or country reference) Always label the original situation e.g. equilibrium (PE/ QE) and the new situation e.g. new equilibrium (P1/Q1) Use arrows to show any change e.g. demand or supply shifts or PE to P1 price level changes. Make your diagrams clearly visible so try not to include small drawings/ diagrams.
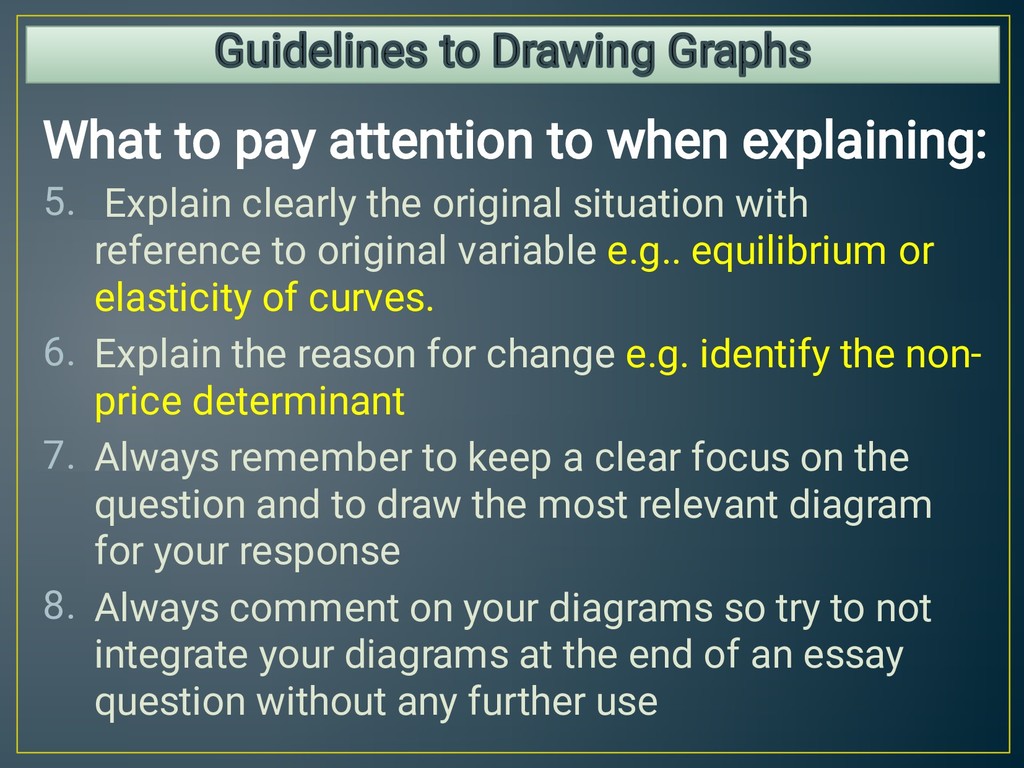
7. 8. What to pay attention to when explaining: Explain clearly the original situation with reference to original variable e.g.. equilibrium or elasticity of curves. Explain the reason for change e.g. identify the non - price determinant Always remember to keep a clear focus on the question and to draw the most relevant diagram for your response Always comment on your diagrams so try to not integrate your diagrams at the end of an essay question without any further use
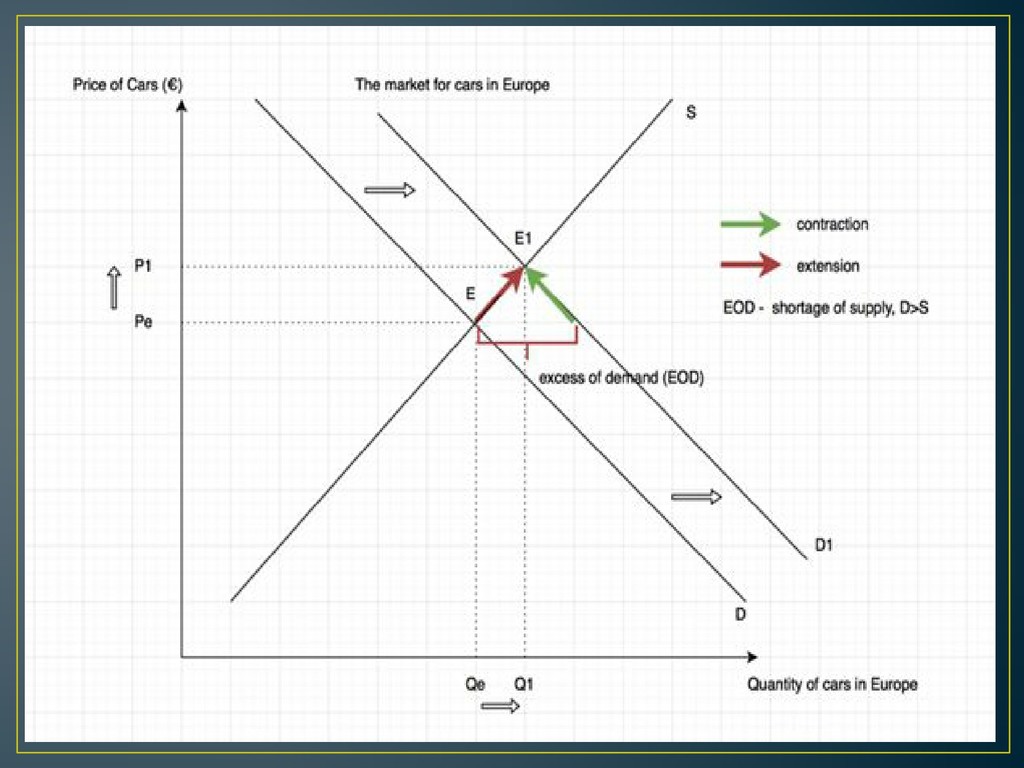
supply for cars in Europe is shown by Pe and Qe which is the equilibrium price and quantity of cars (E). As income tax in European countries decreased, European consumer’s disposable income and their purchasing power increased, leading to more demand for cars in Europe. This causes the demand curve to shift to the right from D to D1 at the price of Pe. This creates a shortage which causes an upward pressure on price.
to the producer to extend supply along the supply curve due to the law of supply and the profit motive (incentive). However, an increase in price signals to consumers to buy less and therefore demand contracts along the demand curve due to the law of demand and the income effect (incentive). This leads to a new equilibrium of P1, Q1 whereby prices have risen from Pe to P1 and the quantity of cars in Europe increased from Qe to Q1, rationing cars to the people who now have the ability and willingness.
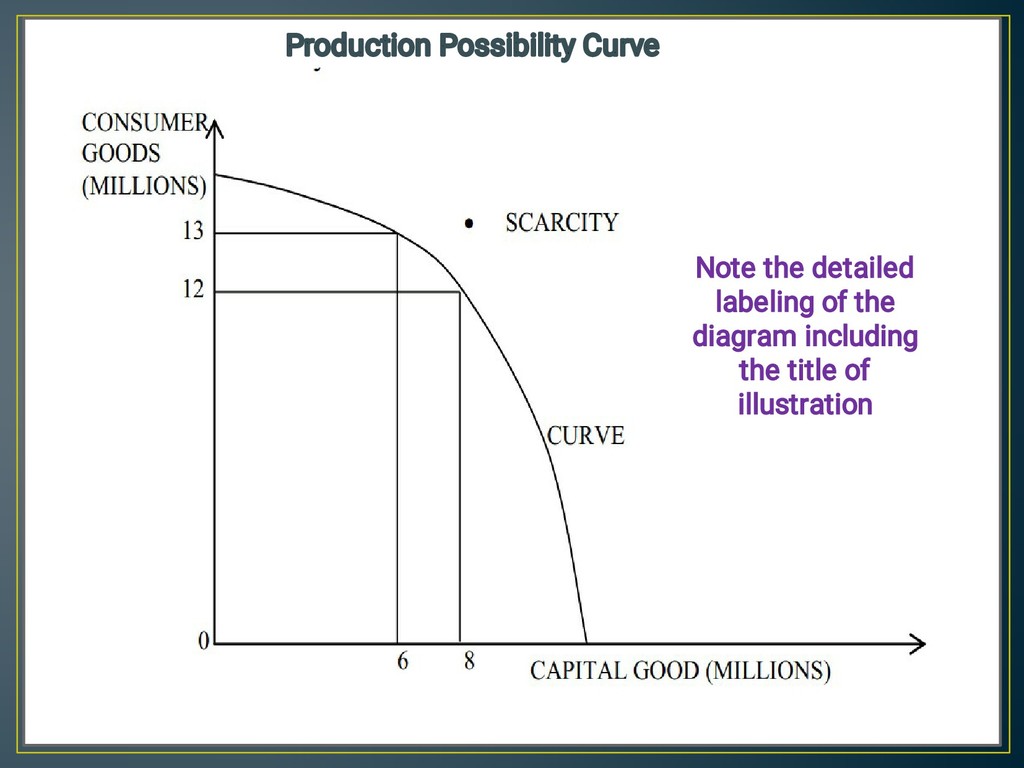
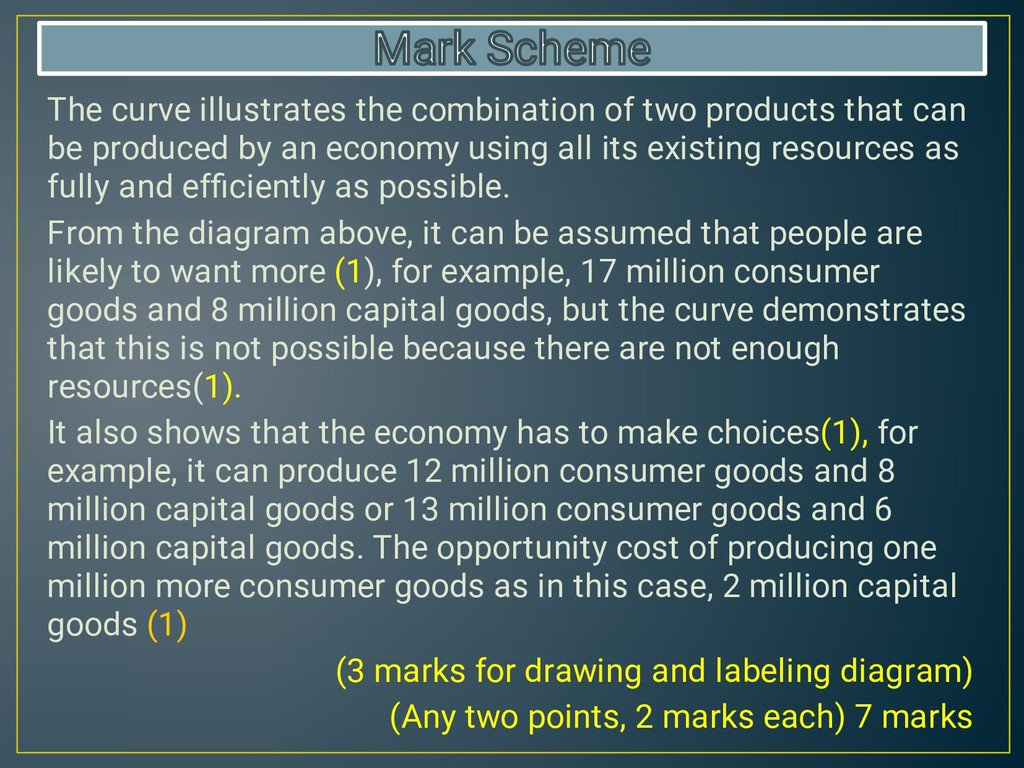
be produced by an economy using all its existing resources as fully and efficiently as possible. From the diagram above, it can be assumed that people are likely to want more (1), for example, 17 million consumer goods and 8 million capital goods, but the curve demonstrates that this is not possible because there are not enough resources(1). It also shows that the economy has to make choices(1), for example, it can produce 12 million consumer goods and 8 million capital goods or 13 million consumer goods and 6 million capital goods. The opportunity cost of producing one million more consumer goods as in this case, 2 million capital goods (1) (3 marks for drawing and labeling diagram) (Any two points, 2 marks each) 7 marks Mark Scheme Mark Scheme