Upgrade to Pro — share decks privately, control downloads, hide ads and more …

Multiome: Single-nucleus multiomic profiling id...

Avatar for Cynthia SC Cynthia SC
September 22, 2025

Multiome: Single-nucleus multiomic profiling identifies cis-regulatory mechanisms in Alzheimer’s disease (AD)

Multiome Journal Club: 2023-11-07

Summary:
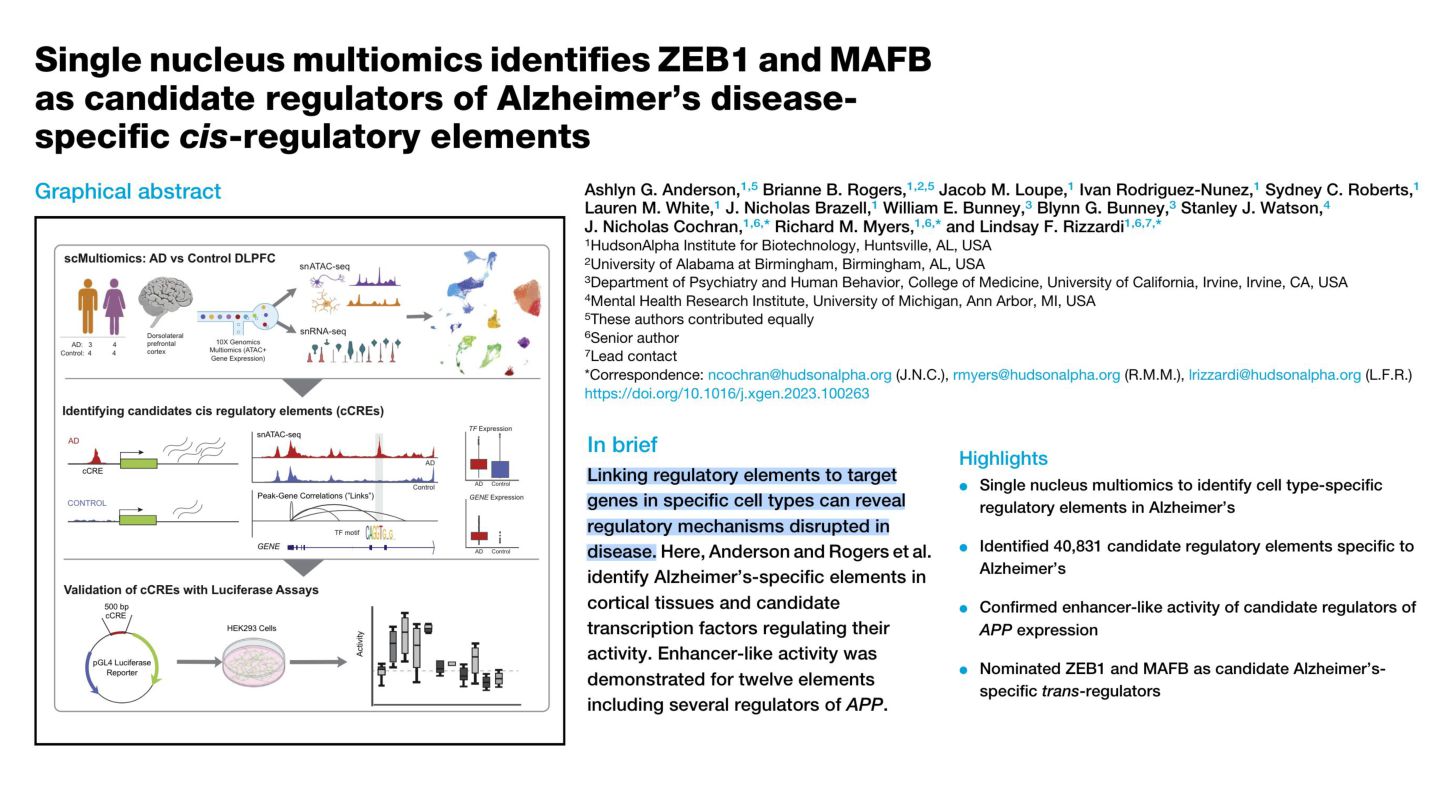
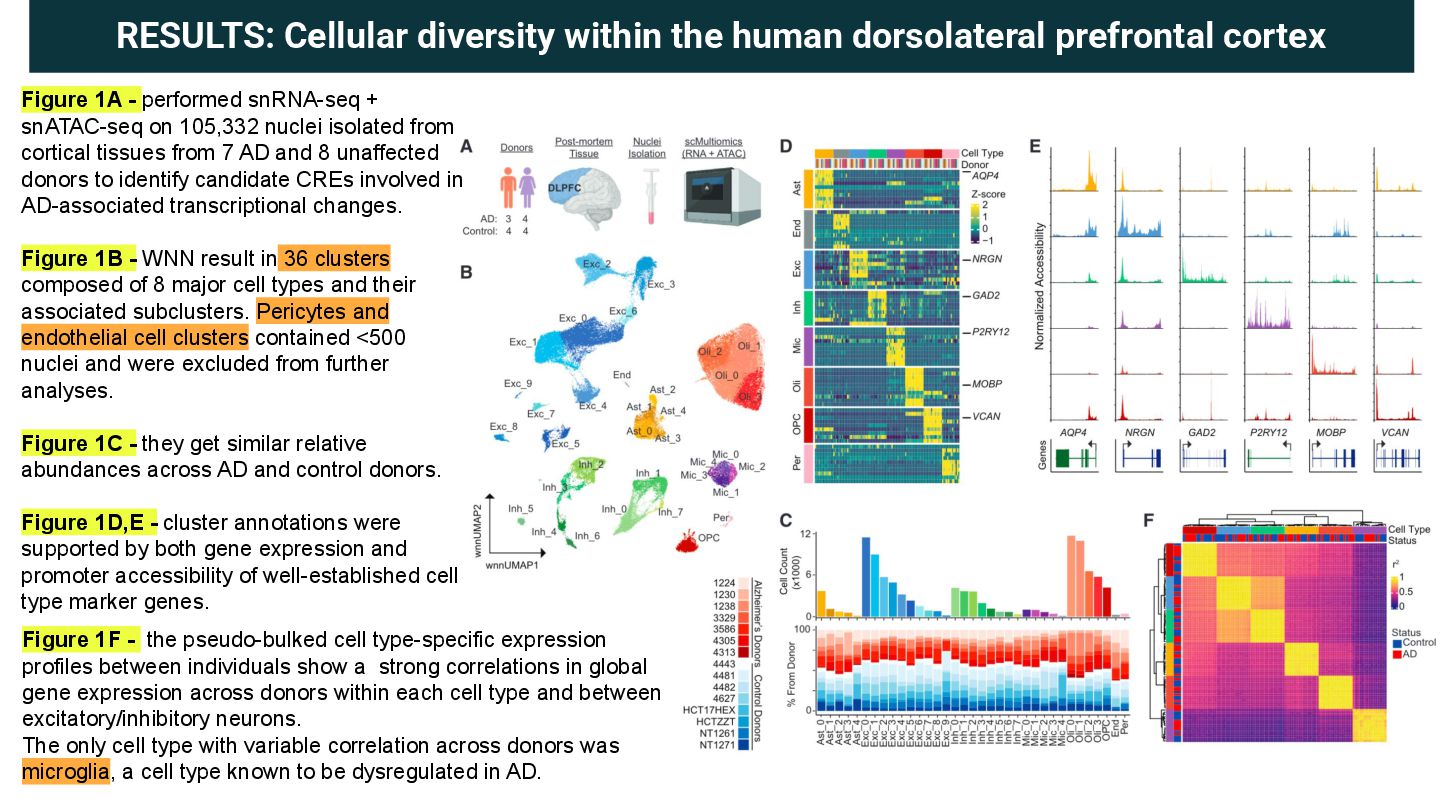
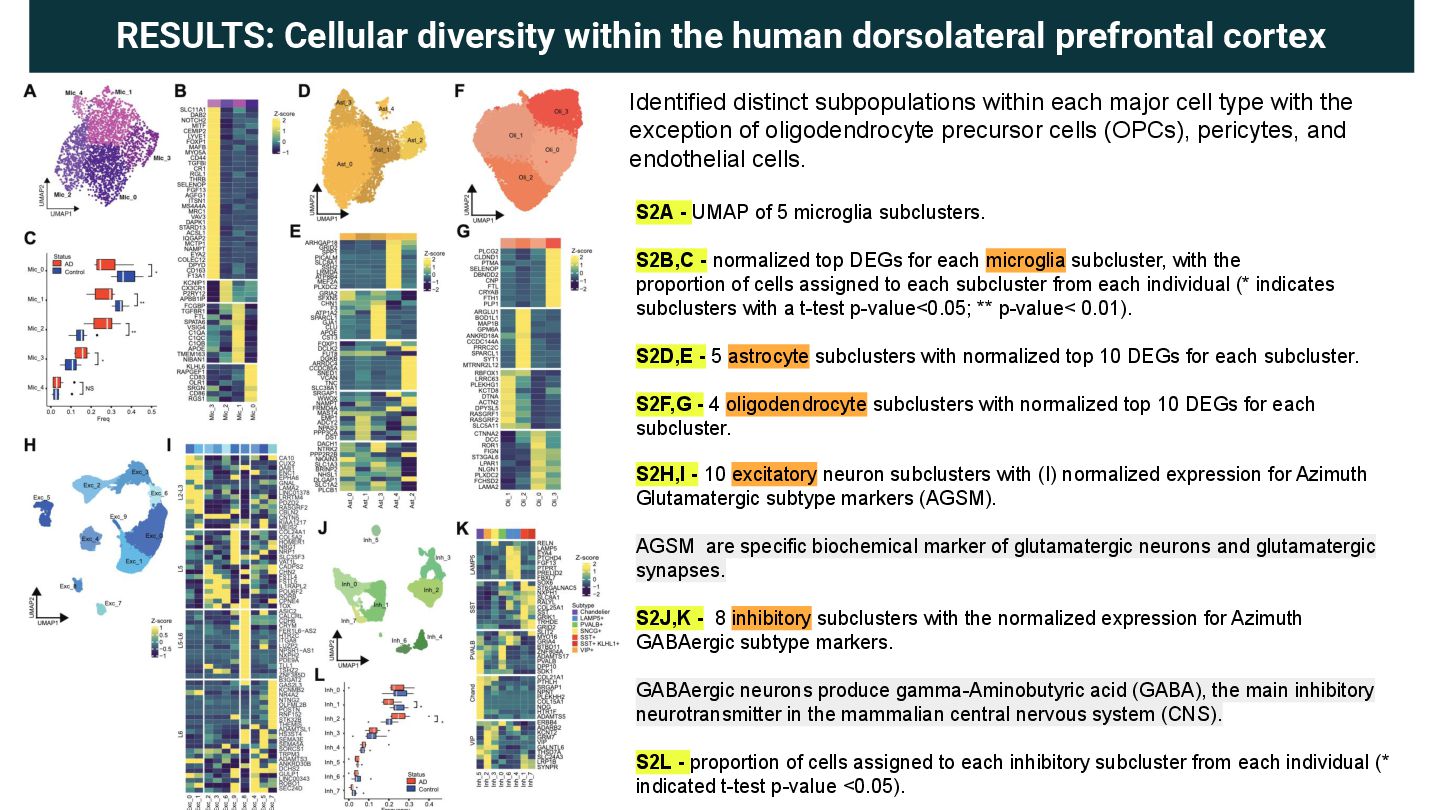
This study integrates snRNA-seq + snATAC-seq from DLPFC tissue of AD and control donors to identify candidate cis-regulatory elements (CREs) that are disrupted in disease. Using 105k nuclei, they mapped chromatin accessibility and gene expression across major brain cell types and subpopulations.
Key findings:
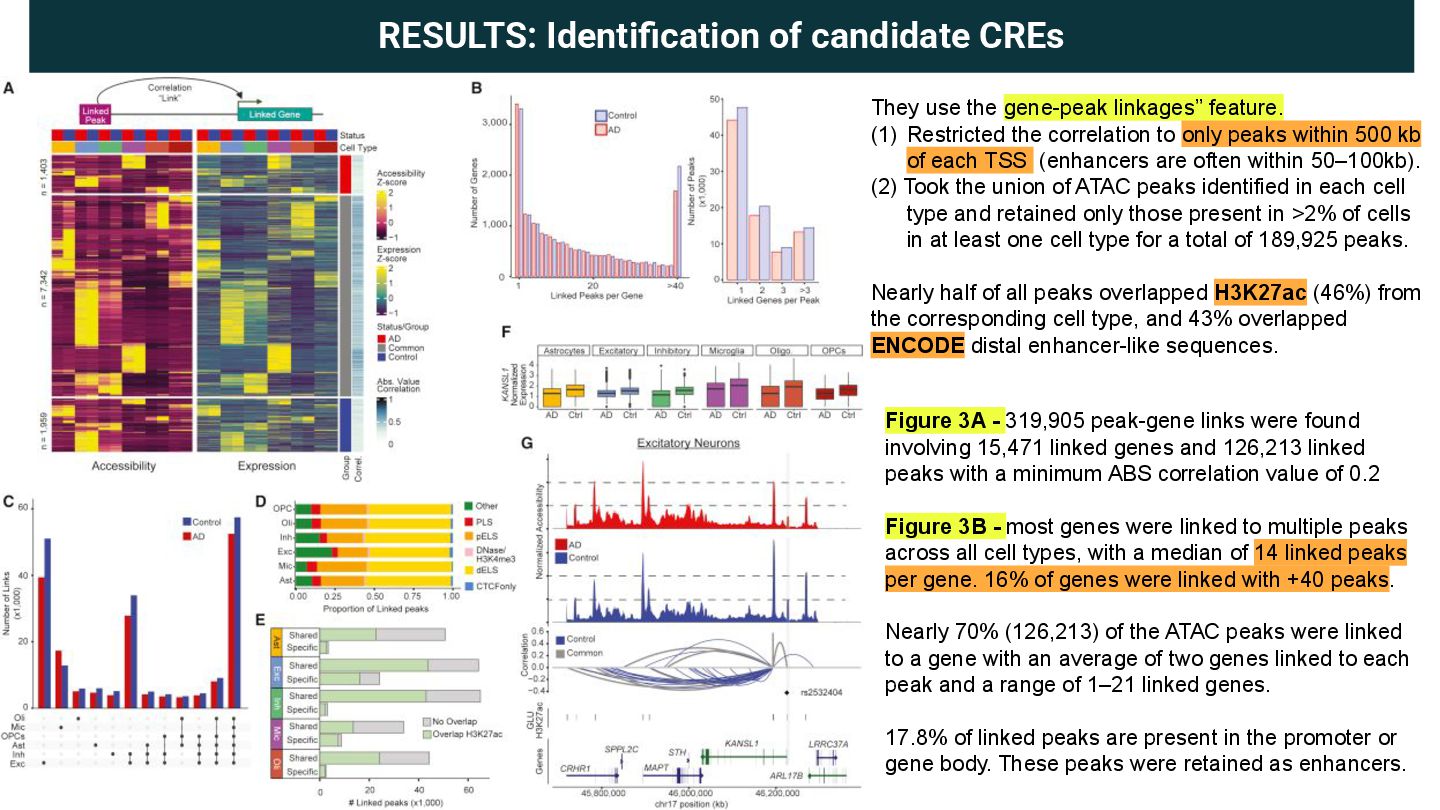
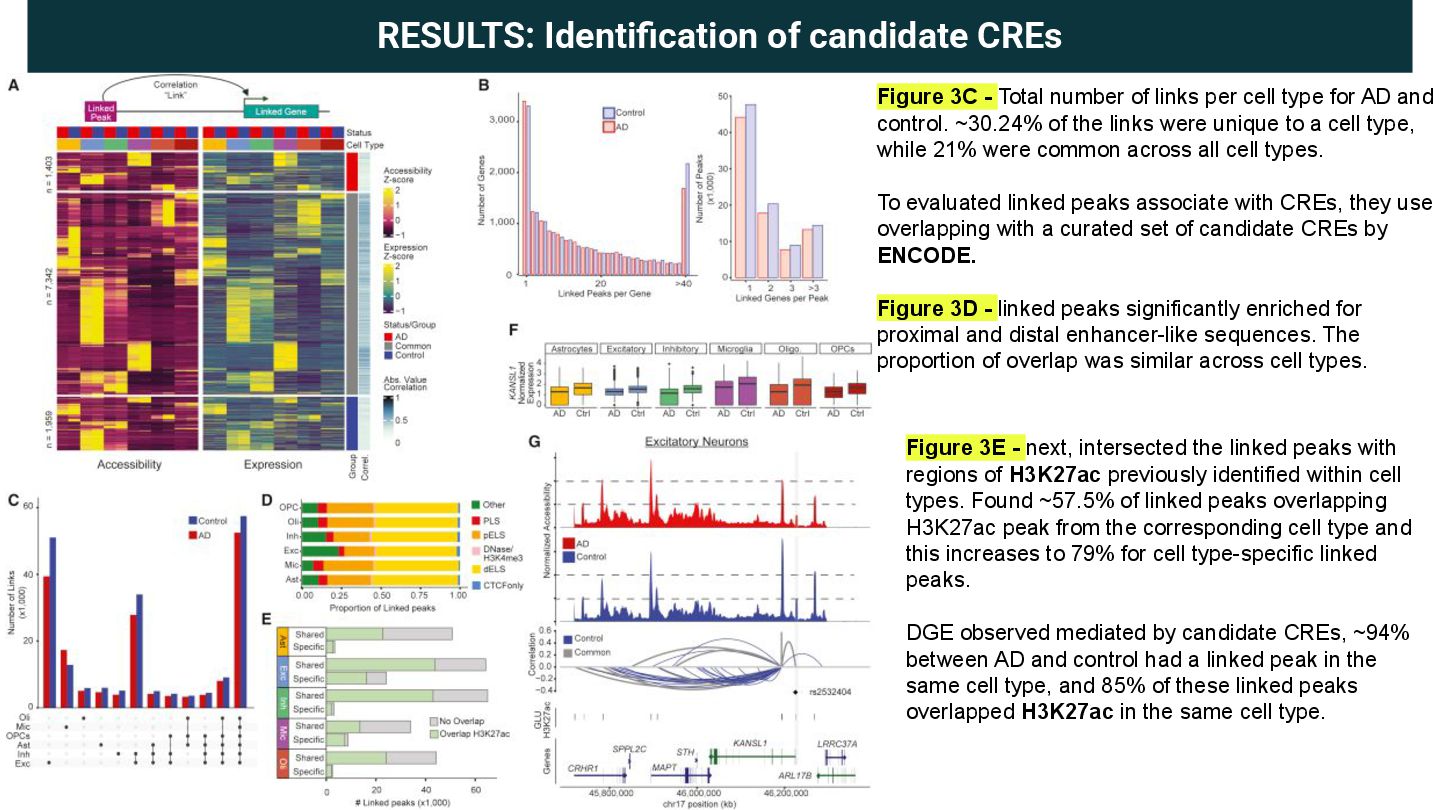
Identified ~320k peak-gene links, many cell-type specific and enriched for H3K27ac and ENCODE enhancer regions.
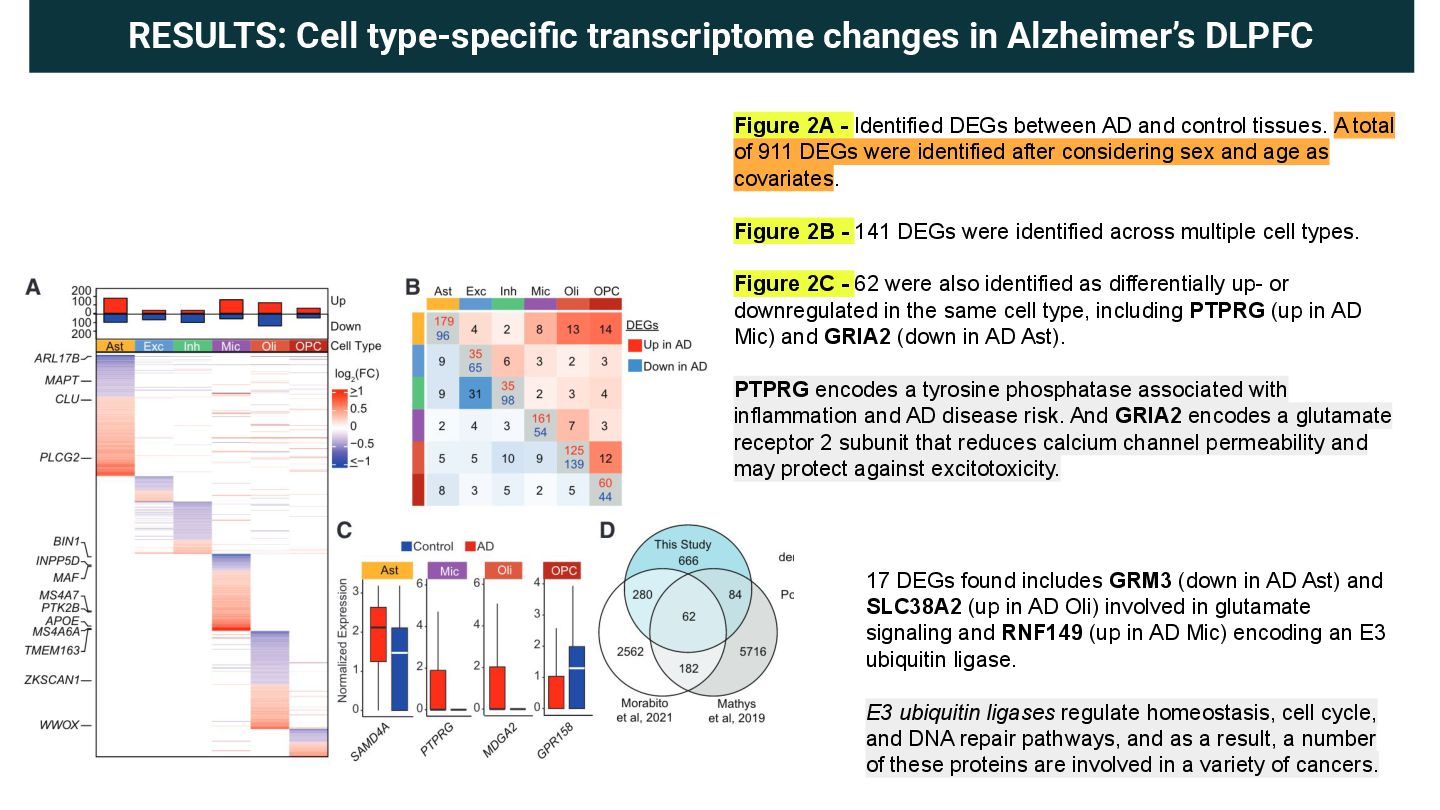
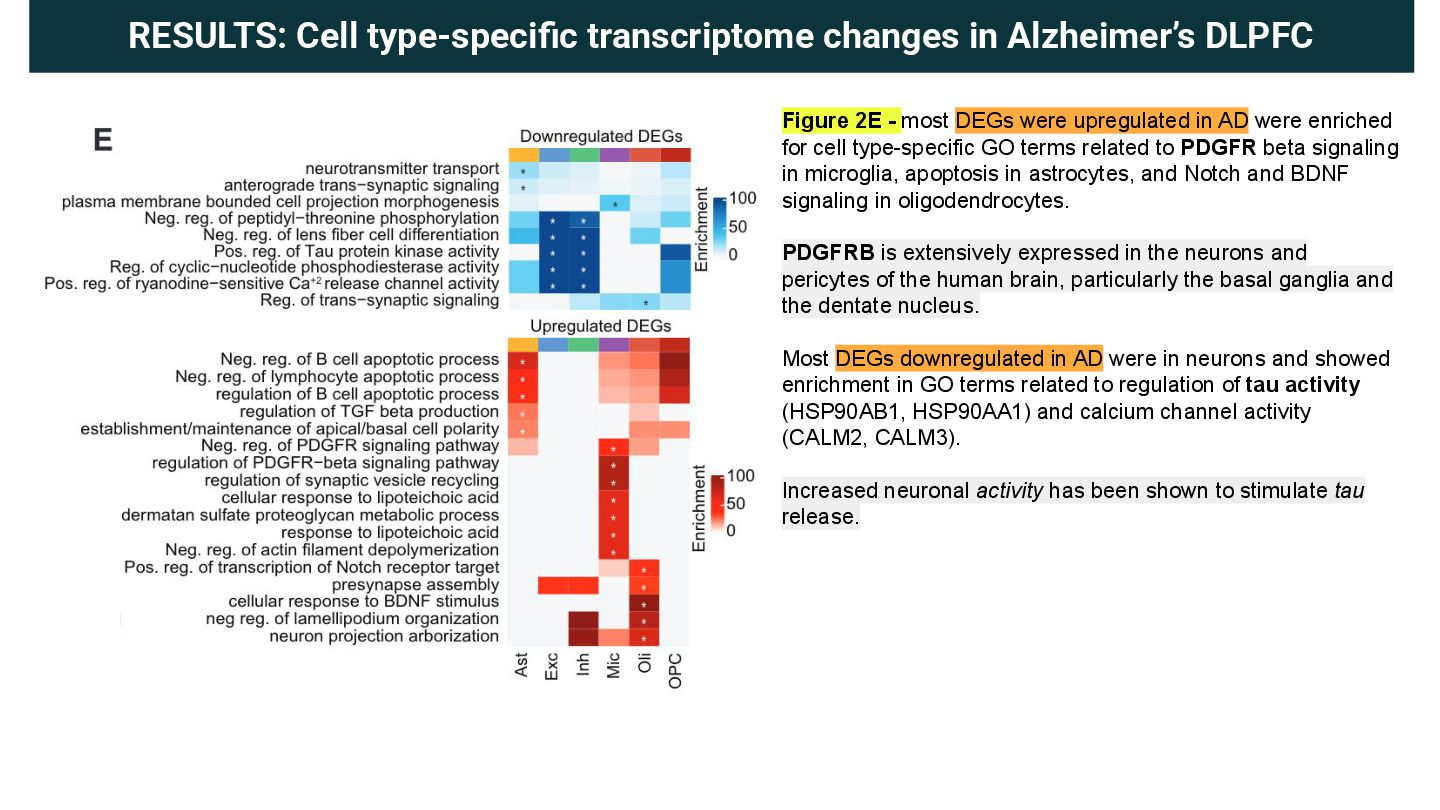
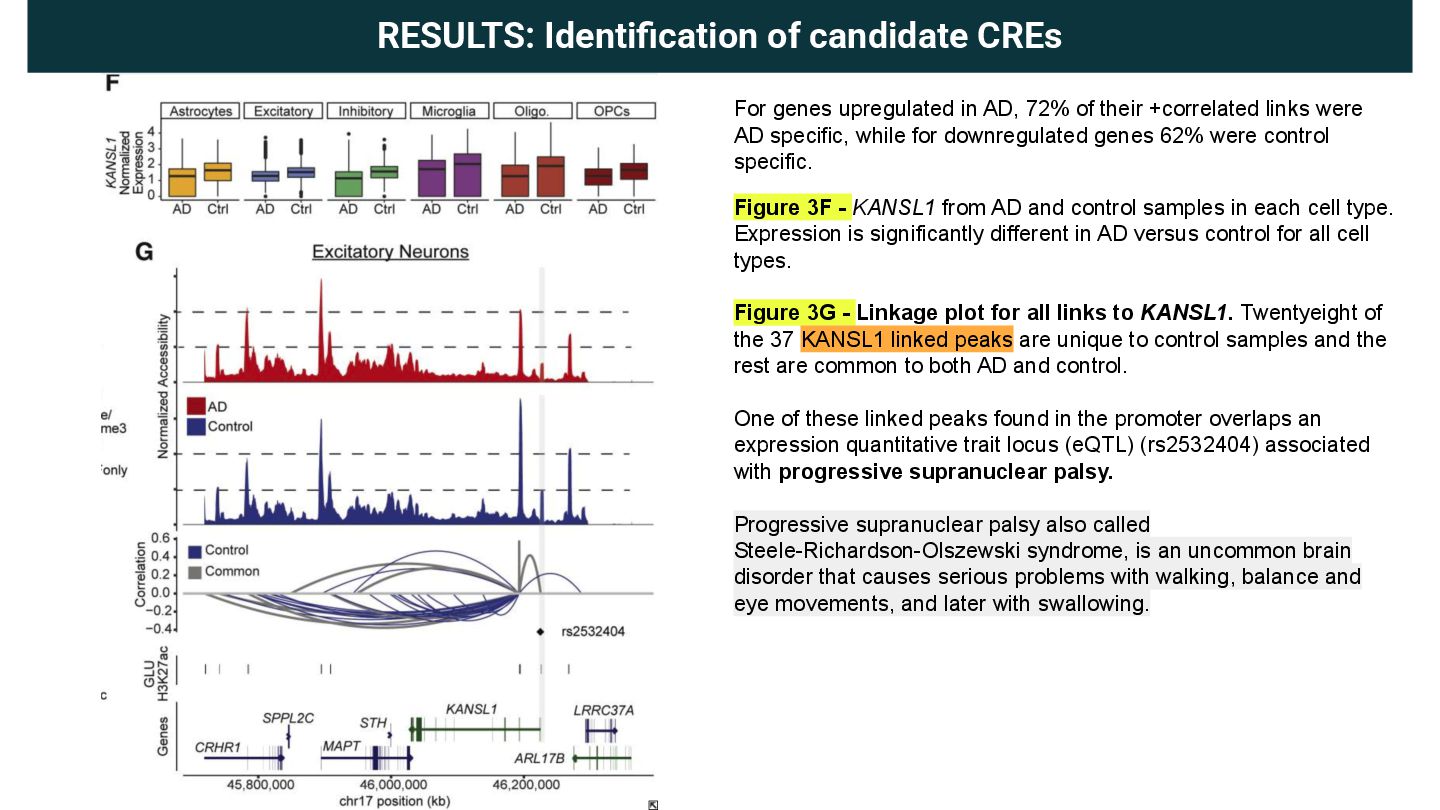
Found AD-specific CREs that correlate with transcriptional changes in microglia, neurons, astrocytes, etc.
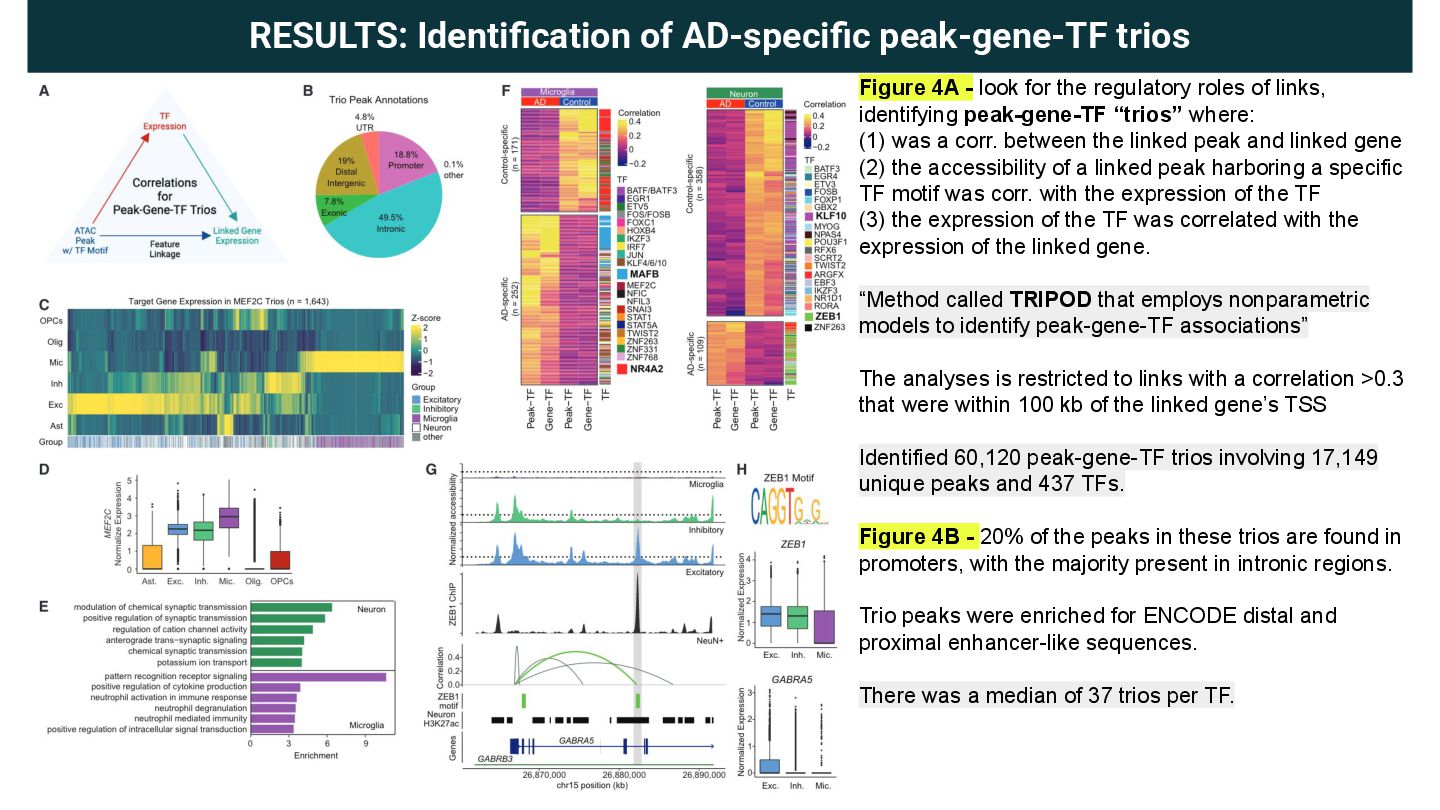
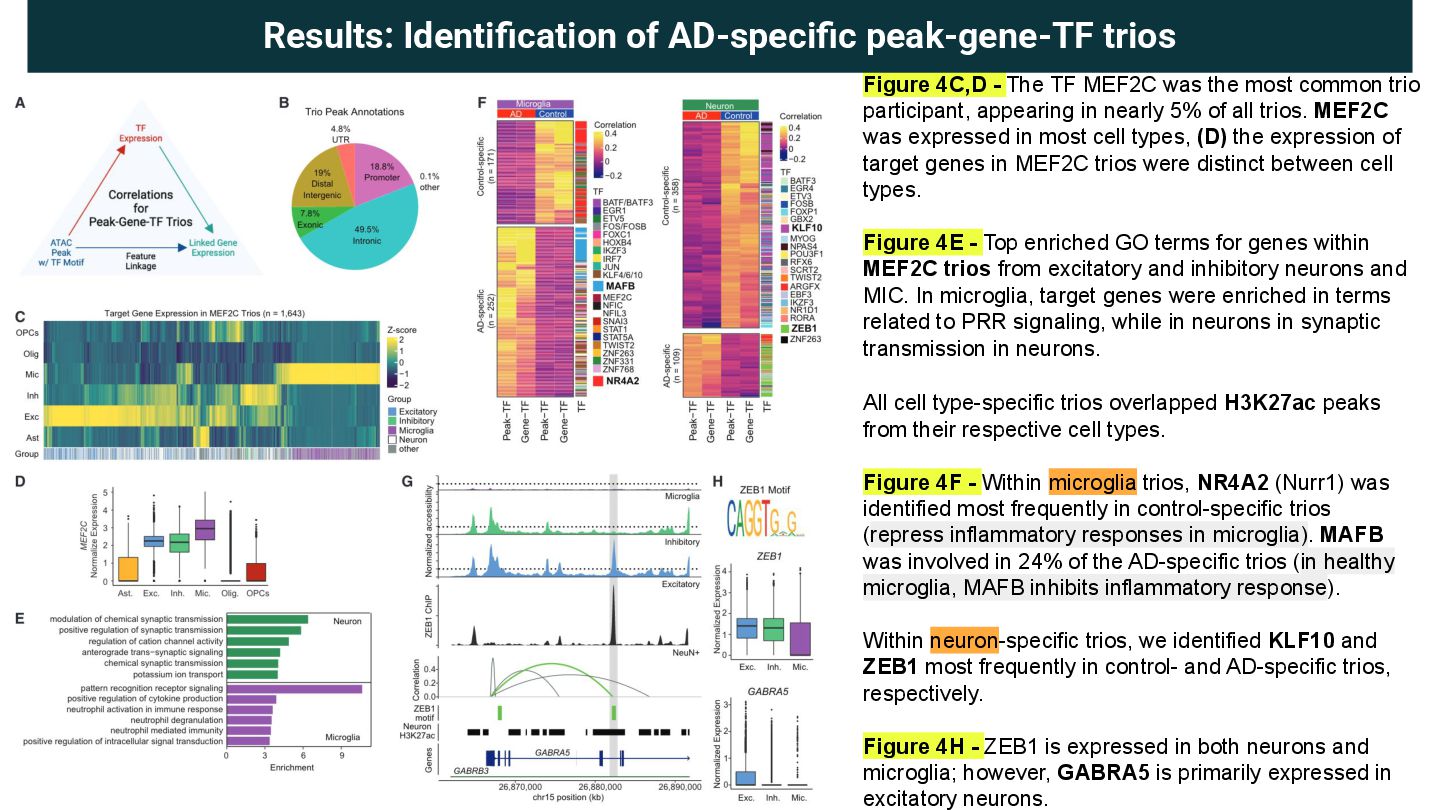
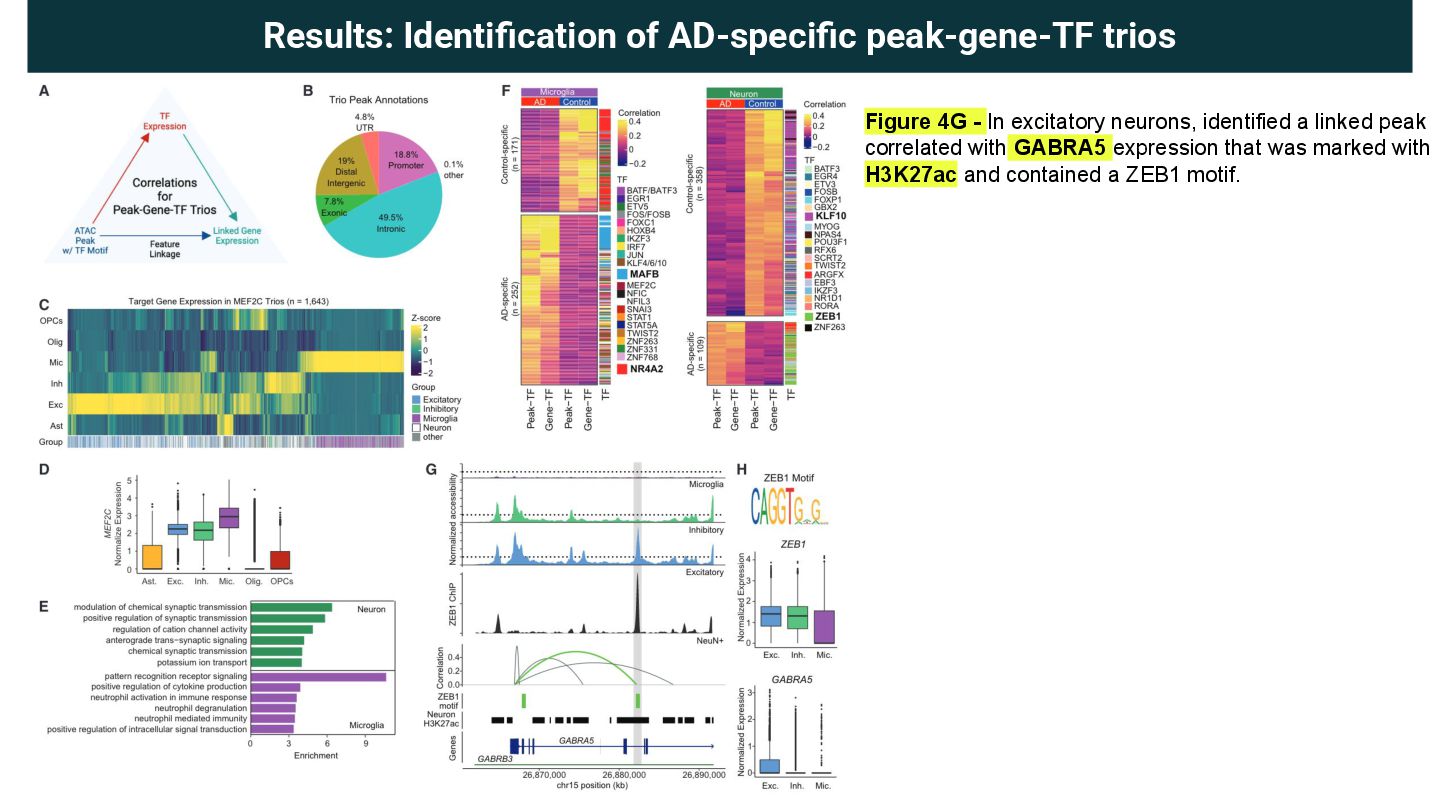
Constructed peak-gene-TF "trios" (e.g., ZEB1 in neurons, MAFB in microglia) to reveal transcription factor roles in AD regulation.
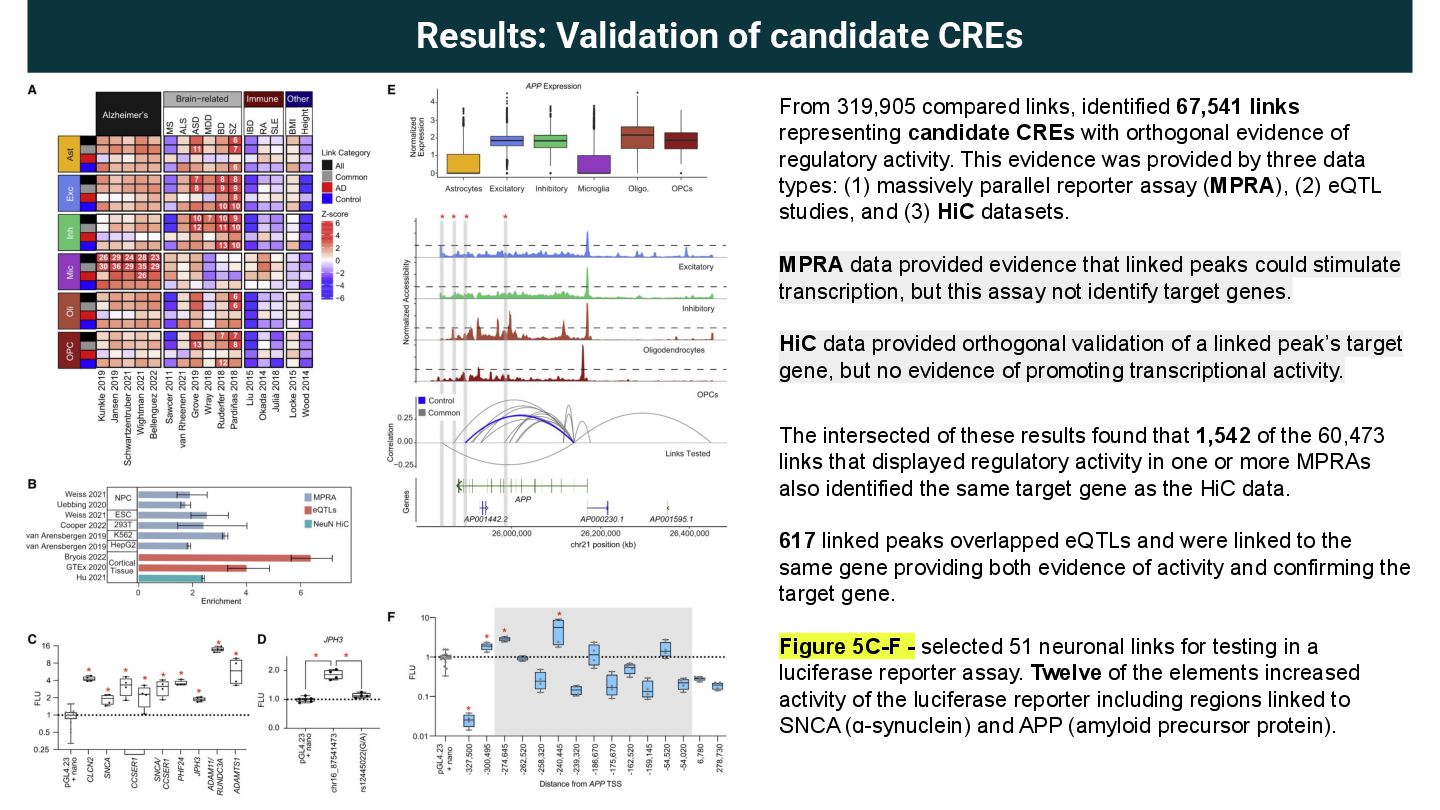
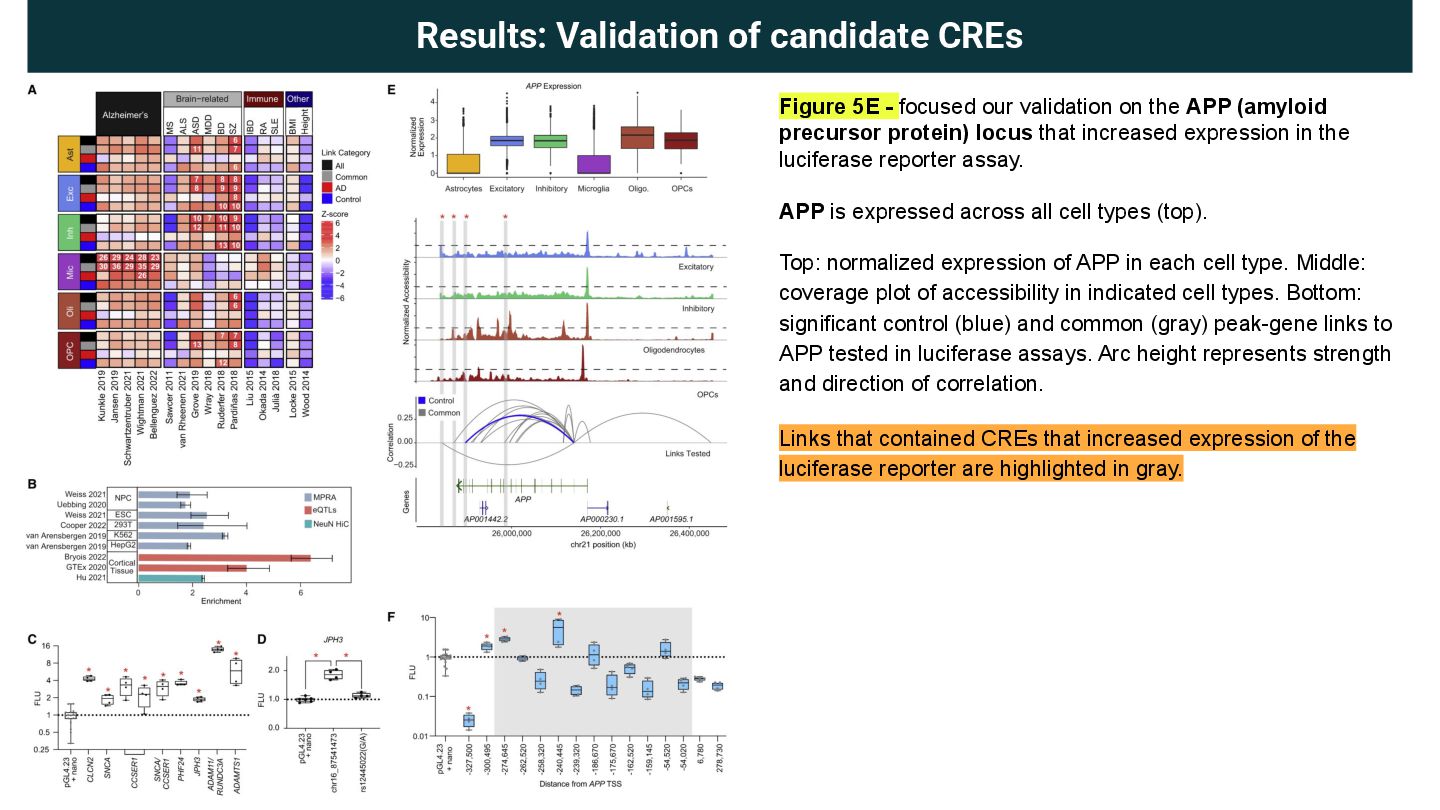
Validated select CREs using luciferase assays and linked them to disease genes like APP and SNCA.
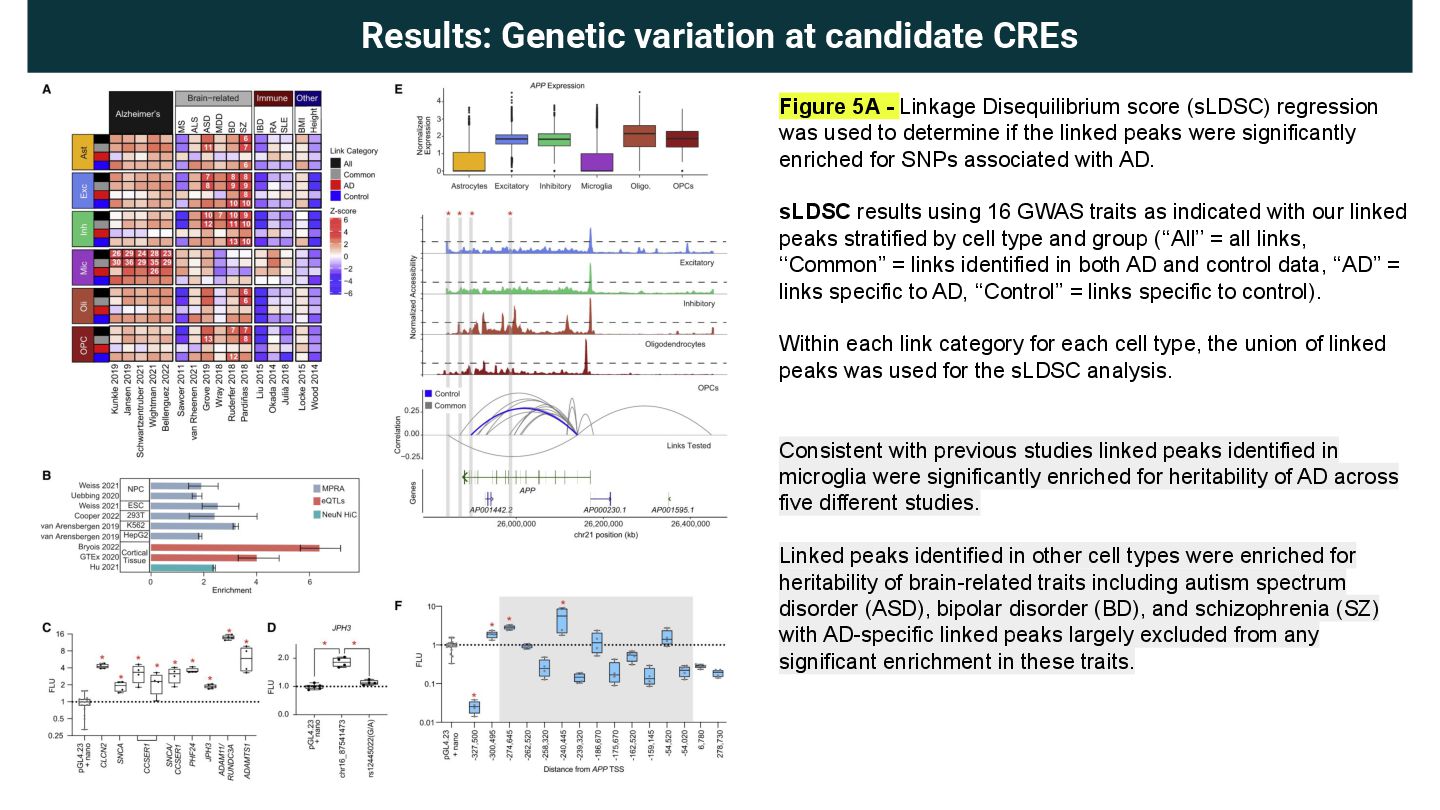
AD-specific linked peaks in microglia were enriched for heritability in AD GWAS, underscoring their functional relevance.

Tools: 10x Genomics Multiome, WNN clustering, TRIPOD framework, sLDSC, MPRA, HiC, eQTL.

Avatar for Cynthia SC

Cynthia SC

September 22, 2025
Tweet

More Decks by Cynthia SC

Other Decks in Science

Transcript

  1. Multiome Journal Club Single nucleus multiomics identifies ZEB1 and MAFB

    as candidate regulators of Alzheimer’s disease specific cis-regulatory elements Cynthia Soto Cardinault (Nov 7th, 2023) Leonardo Collado’s Team
  2. In AD, there are rare, protein-altering variants that cause early-onset

    and autosomal-dominant AD. Linking regulatory elements to target genes in specific cell types can reveal regulatory mechanisms disrupted in disease. Challenges: • Associating common and rare regulatory variants with affected genes is a challenge. • Disease-associated variants often function only in specific cell types, further interpretation of their effects is complicated. INTRODUCTION: Alzheimer’s disease (AD) AD is a neurodegenerative disease that starts slowly and progressively worsens, and is the cause of 60–70% of cases of dementia. And as the disease advances, symptoms can include problems with language, disorientation, loss of motivation, self-neglect, and behavioral issues.
  3. RESULTS: Cellular diversity within the human dorsolateral prefrontal cortex Figure

    1A - performed snRNA-seq + snATAC-seq on 105,332 nuclei isolated from cortical tissues from 7 AD and 8 unaffected donors to identify candidate CREs involved in AD-associated transcriptional changes. Figure 1B - WNN result in 36 clusters composed of 8 major cell types and their associated subclusters. Pericytes and endothelial cell clusters contained <500 nuclei and were excluded from further analyses. Figure 1C - they get similar relative abundances across AD and control donors. Figure 1D,E - cluster annotations were supported by both gene expression and promoter accessibility of well-established cell type marker genes. Figure 1F - the pseudo-bulked cell type-specific expression profiles between individuals show a strong correlations in global gene expression across donors within each cell type and between excitatory/inhibitory neurons. The only cell type with variable correlation across donors was microglia, a cell type known to be dysregulated in AD.
  4. RESULTS: Cellular diversity within the human dorsolateral prefrontal cortex Identified

    distinct subpopulations within each major cell type with the exception of oligodendrocyte precursor cells (OPCs), pericytes, and endothelial cells. S2A - UMAP of 5 microglia subclusters. S2B,C - normalized top DEGs for each microglia subcluster, with the proportion of cells assigned to each subcluster from each individual (* indicates subclusters with a t-test p-value<0.05; ** p-value< 0.01). S2D,E - 5 astrocyte subclusters with normalized top 10 DEGs for each subcluster. S2F,G - 4 oligodendrocyte subclusters with normalized top 10 DEGs for each subcluster. S2H,I - 10 excitatory neuron subclusters with (I) normalized expression for Azimuth Glutamatergic subtype markers (AGSM). AGSM are specific biochemical marker of glutamatergic neurons and glutamatergic synapses. S2J,K - 8 inhibitory subclusters with the normalized expression for Azimuth GABAergic subtype markers. GABAergic neurons produce gamma-Aminobutyric acid (GABA), the main inhibitory neurotransmitter in the mammalian central nervous system (CNS). S2L - proportion of cells assigned to each inhibitory subcluster from each individual (* indicated t-test p-value <0.05).
  5. RESULTS: Cell type-specific transcriptome changes in Alzheimer’s DLPFC Figure 2A

    - Identified DEGs between AD and control tissues. A total of 911 DEGs were identified after considering sex and age as covariates. Figure 2B - 141 DEGs were identified across multiple cell types. Figure 2C - 62 were also identified as differentially up- or downregulated in the same cell type, including PTPRG (up in AD Mic) and GRIA2 (down in AD Ast). PTPRG encodes a tyrosine phosphatase associated with inflammation and AD disease risk. And GRIA2 encodes a glutamate receptor 2 subunit that reduces calcium channel permeability and may protect against excitotoxicity. 17 DEGs found includes GRM3 (down in AD Ast) and SLC38A2 (up in AD Oli) involved in glutamate signaling and RNF149 (up in AD Mic) encoding an E3 ubiquitin ligase. E3 ubiquitin ligases regulate homeostasis, cell cycle, and DNA repair pathways, and as a result, a number of these proteins are involved in a variety of cancers.
  6. RESULTS: Cell type-specific transcriptome changes in Alzheimer’s DLPFC Figure 2E

    - most DEGs were upregulated in AD were enriched for cell type-specific GO terms related to PDGFR beta signaling in microglia, apoptosis in astrocytes, and Notch and BDNF signaling in oligodendrocytes. PDGFRB is extensively expressed in the neurons and pericytes of the human brain, particularly the basal ganglia and the dentate nucleus. Most DEGs downregulated in AD were in neurons and showed enrichment in GO terms related to regulation of tau activity (HSP90AB1, HSP90AA1) and calcium channel activity (CALM2, CALM3). Increased neuronal activity has been shown to stimulate tau release.
  7. RESULTS: Identification of candidate CREs They use the gene-peak linkages’’

    feature. (1) Restricted the correlation to only peaks within 500 kb of each TSS (enhancers are often within 50–100kb). (2) Took the union of ATAC peaks identified in each cell type and retained only those present in >2% of cells in at least one cell type for a total of 189,925 peaks. Nearly half of all peaks overlapped H3K27ac (46%) from the corresponding cell type, and 43% overlapped ENCODE distal enhancer-like sequences. Figure 3A - 319,905 peak-gene links were found involving 15,471 linked genes and 126,213 linked peaks with a minimum ABS correlation value of 0.2 Figure 3B - most genes were linked to multiple peaks across all cell types, with a median of 14 linked peaks per gene. 16% of genes were linked with +40 peaks. Nearly 70% (126,213) of the ATAC peaks were linked to a gene with an average of two genes linked to each peak and a range of 1–21 linked genes. 17.8% of linked peaks are present in the promoter or gene body. These peaks were retained as enhancers.
  8. Results: Identification of candidate CREs S3A - The median distance

    between the linked peak and the TSS of the linked gene was 201,506 bp, and there was an inverse relationship between absolute correlation value and distance to TSS. S3B - 1,294 genes had only AD links and 1,596 had only control links. No significant bias when comparing the number of links identified AD or control for a given gene. S3C - Most of the genes (16%) with +40 peaks are significantly longer and more highly expressed than those with fewer links. S3D - Permutation analyses determined that the fraction of AD- and control-specific links (0.36 of total links) was greater than expected by chance (p = 0.027, Z test). S3E - Target genes of cell type-specific links identified in both AD and control samples were enriched in expected pathways..
  9. RESULTS: Identification of candidate CREs Figure 3C - Total number

    of links per cell type for AD and control. ~30.24% of the links were unique to a cell type, while 21% were common across all cell types. To evaluated linked peaks associate with CREs, they use overlapping with a curated set of candidate CREs by ENCODE. Figure 3D - linked peaks significantly enriched for proximal and distal enhancer-like sequences. The proportion of overlap was similar across cell types. Figure 3E - next, intersected the linked peaks with regions of H3K27ac previously identified within cell types. Found ~57.5% of linked peaks overlapping H3K27ac peak from the corresponding cell type and this increases to 79% for cell type-specific linked peaks. DGE observed mediated by candidate CREs, ~94% between AD and control had a linked peak in the same cell type, and 85% of these linked peaks overlapped H3K27ac in the same cell type.
  10. For genes upregulated in AD, 72% of their +correlated links

    were AD specific, while for downregulated genes 62% were control specific. Figure 3F - KANSL1 from AD and control samples in each cell type. Expression is significantly different in AD versus control for all cell types. Figure 3G - Linkage plot for all links to KANSL1. Twentyeight of the 37 KANSL1 linked peaks are unique to control samples and the rest are common to both AD and control. One of these linked peaks found in the promoter overlaps an expression quantitative trait locus (eQTL) (rs2532404) associated with progressive supranuclear palsy. Progressive supranuclear palsy also called Steele-Richardson-Olszewski syndrome, is an uncommon brain disorder that causes serious problems with walking, balance and eye movements, and later with swallowing. RESULTS: Identification of candidate CREs
  11. Figure 4A - look for the regulatory roles of links,

    identifying peak-gene-TF ‘‘trios’’ where: (1) was a corr. between the linked peak and linked gene (2) the accessibility of a linked peak harboring a specific TF motif was corr. with the expression of the TF (3) the expression of the TF was correlated with the expression of the linked gene. “Method called TRIPOD that employs nonparametric models to identify peak-gene-TF associations” The analyses is restricted to links with a correlation >0.3 that were within 100 kb of the linked gene’s TSS Identified 60,120 peak-gene-TF trios involving 17,149 unique peaks and 437 TFs. Figure 4B - 20% of the peaks in these trios are found in promoters, with the majority present in intronic regions. Trio peaks were enriched for ENCODE distal and proximal enhancer-like sequences. There was a median of 37 trios per TF. RESULTS: Identification of AD-specific peak-gene-TF trios
  12. Figure 4C,D - The TF MEF2C was the most common

    trio participant, appearing in nearly 5% of all trios. MEF2C was expressed in most cell types, (D) the expression of target genes in MEF2C trios were distinct between cell types. Figure 4E - Top enriched GO terms for genes within MEF2C trios from excitatory and inhibitory neurons and MIC. In microglia, target genes were enriched in terms related to PRR signaling, while in neurons in synaptic transmission in neurons. PRRs including Toll-like receptors that are critical for microglial activation. Results: Identification of AD-specific peak-gene-TF trios All cell type-specific trios overlapped H3K27ac peaks from their respective cell types. Figure 4F - Within microglia trios, NR4A2 (Nurr1) was identified most frequently in control-specific trios (repress inflammatory responses in microglia). MAFB was involved in 24% of the AD-specific trios (in healthy microglia, MAFB inhibits inflammatory response). Within neuron-specific trios, we identified KLF10 and ZEB1 most frequently in control- and AD-specific trios, respectively. Figure 4H - ZEB1 is expressed in both neurons and microglia; however, GABRA5 is primarily expressed in excitatory neurons.
  13. Figure 4G - In excitatory neurons, identified a linked peak

    correlated with GABRA5 expression that was marked with H3K27ac and contained a ZEB1 motif. Results: Identification of AD-specific peak-gene-TF trios
  14. Figure 5A - Linkage Disequilibrium score (sLDSC) regression was used

    to determine if the linked peaks were significantly enriched for SNPs associated with AD. sLDSC results using 16 GWAS traits as indicated with our linked peaks stratified by cell type and group (‘‘All’’ = all links, ‘‘Common’’ = links identified in both AD and control data, ‘‘AD’’ = links specific to AD, ‘‘Control’’ = links specific to control). Within each link category for each cell type, the union of linked peaks was used for the sLDSC analysis. Results: Genetic variation at candidate CREs Consistent with previous studies linked peaks identified in microglia were significantly enriched for heritability of AD across five different studies. Linked peaks identified in other cell types were enriched for heritability of brain-related traits including autism spectrum disorder (ASD), bipolar disorder (BD), and schizophrenia (SZ) with AD-specific linked peaks largely excluded from any significant enrichment in these traits.
  15. From 319,905 compared links, identified 67,541 links representing candidate CREs

    with orthogonal evidence of regulatory activity. This evidence was provided by three data types: (1) massively parallel reporter assay (MPRA), (2) eQTL studies, and (3) HiC datasets. MPRA data provided evidence that linked peaks could stimulate transcription, but this assay not identify target genes. HiC data provided orthogonal validation of a linked peak’s target gene, but no evidence of promoting transcriptional activity. Results: Validation of candidate CREs The intersected of these results found that 1,542 of the 60,473 links that displayed regulatory activity in one or more MPRAs also identified the same target gene as the HiC data. 617 linked peaks overlapped eQTLs and were linked to the same gene providing both evidence of activity and confirming the target gene. Figure 5C-F - selected 51 neuronal links for testing in a luciferase reporter assay. Twelve of the elements increased activity of the luciferase reporter including regions linked to SNCA (ɑ-synuclein) and APP (amyloid precursor protein).
  16. Figure 5E - focused our validation on the APP (amyloid

    precursor protein) locus that increased expression in the luciferase reporter assay. APP is expressed across all cell types (top). Top: normalized expression of APP in each cell type. Middle: coverage plot of accessibility in indicated cell types. Bottom: significant control (blue) and common (gray) peak-gene links to APP tested in luciferase assays. Arc height represents strength and direction of correlation. Links that contained CREs that increased expression of the luciferase reporter are highlighted in gray. Results: Validation of candidate CREs
  17. Using this strategy they identified five times as many new

    candidate CREs than previously reported. Only Parkinson’s, used the 10x Genomics Multiomics technology, and identified a similarly large number of peak-gene links (193,732 compared with our 319,905). The study provides two main advances of altered gene regulation in AD. - First, they constructed peak-gene-TF trios to determine which TFs were particularly involved in regulating AD-specific transcriptional programs. - Second, demonstrated enhancer-like activity for 12 candidate CREs linked to neurodegeneration-associated genes. The study provides important new insights into the contribution of CREs to AD including the roles of TFs ZEB1 and MAFB in neurons and microglia. Discussion and Limitations The snATAC-seq data can contain spurious signals, as well as bias from transcribed genes. This limitation underscores the importance of evaluation via orthogonal methods, which we have provided using both published and newly generated data. A second limitation is that our sample size is small. Finally, as with any study from postmortem tissue, we are measuring by definition the material that remains in a neurodegenerative disease, which can confound interpretation.
  18. Linkage Disequilibrium (LD) Imagine two alleles, A and B, located

    on the same chromosome. If these alleles are in linkage disequilibrium, it means that they are often inherited together, rather than independently, as would be expected if they were on different chromosomes. Linkage disequilibrium can have important implications for understanding the inheritance of genetic traits and diseases. It can provide insights into the likelihood of certain combinations of alleles being passed on from one generation to the next, which can be relevant in genetics and the study of complex genetic traits. However, it's important to note that linkage disequilibrium is not always present between all genes and alleles and can change over time due to factors such as genetic recombination and evolution. LD is a population-based parameter that describes the degree to which an allele of one genetic variant is inherited or correlated with an allele of a nearby genetic variant within a given population (Bush and Moore, 2012) LD are non-random association of alleles at different loci (positions) on a chromosome.