Upgrade to Pro — share decks privately, control downloads, hide ads and more …

User Acceptance of Proactivity in Restaurant Recommendations for Android Smartphones

User Acceptance of Proactivity in Restaurant Recommendations for Android Smartphones

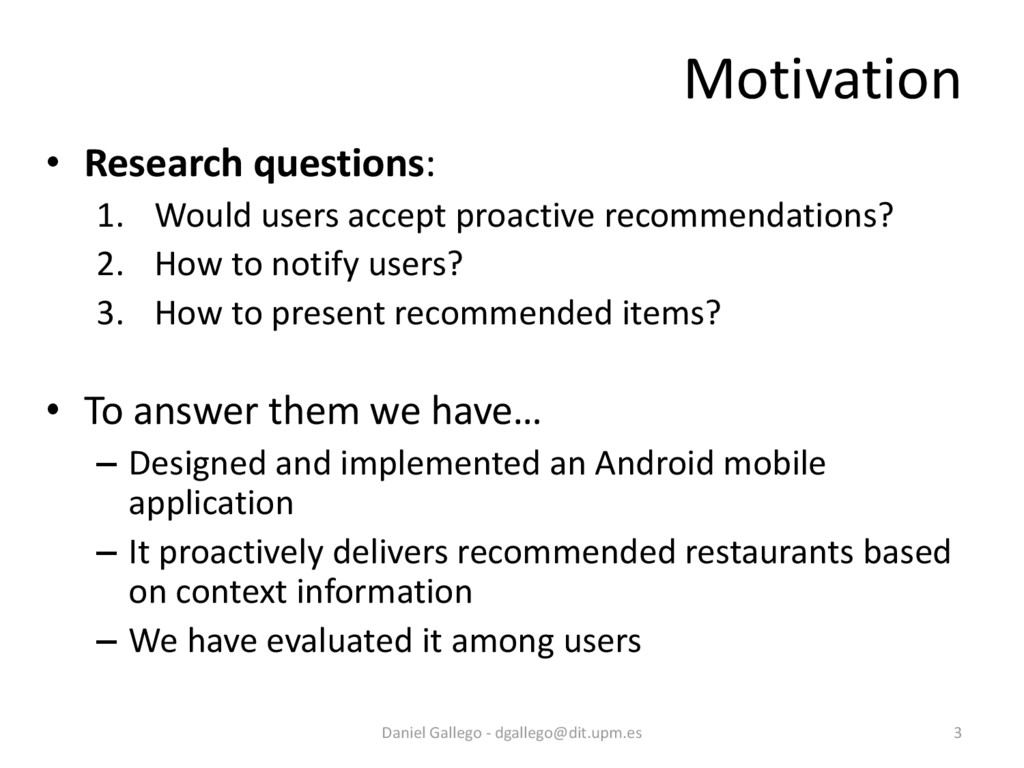
A proactive recommender system pushes recommendations to the user when the current situation seems appropriate, without explicit user request.
Important research questions include whether users would accept proactive recommendations, how to present recommended items and possibly notify users.

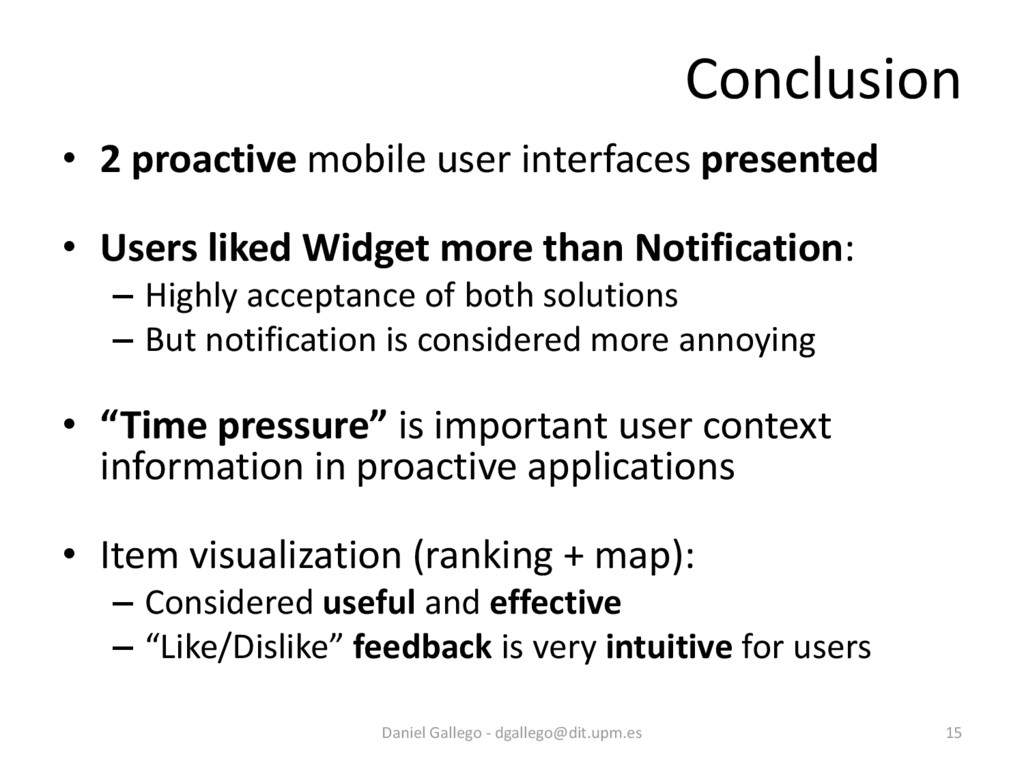
Our scenario is a context-aware restaurant recommender for Android smartphones. We have designed two options for the user interaction with a proactive recommender: a widget- and a notification-based solution.
In addition, our user interface includes a visualization of recommended items and allows for user feedback.

The approach was evaluated in a survey among users with good results regarding usefulness and effectiveness. The results also showed that test users preferred the widget-based solution.

* Presented at the 2012 FTRA International Workshop on Smart Devices, Applications, and Services (SmartIT 2012), Jeju, South Korea

Daniel Gallego Vico

November 22, 2012
Tweet

More Decks by Daniel Gallego Vico

Other Decks in Science

Transcript

  1. Proactivity means… • The system pushes recommendations to the user

    • When current situation seems appropriate • Without user explicit request Daniel Gallego - [email protected] 2
  2. Motivation • Research questions: 1. Would users accept proactive recommendations?

    2. How to notify users? 3. How to present recommended items? • To answer them we have… – Designed and implemented an Android mobile application – It proactively delivers recommended restaurants based on context information – We have evaluated it among users Daniel Gallego - [email protected] 3
  3. • Always visible in the Android device's desktop • Informs

    about: – Category (e.g. Lunch, Dinner…) – Number of places • User feedback – Not now button – Inform if the time chosen for the proactive recommendation is suitable – The system learns about user behavior Daniel Gallego - [email protected] 5 Widget-based User Interface
  4. Notification-based User Interface Daniel Gallego - [email protected] 6 • Similar

    to the widget solution • But: – Only visible when a recommendation is available – Notification with sound and vibration
  5. Recommendations Visualization: Ranking Daniel Gallego - [email protected] 7 • Items

    ordered by a combination of: – Places attributes – Current context • User feedback – Like/Dislike – Learns about user tastes for future recommendations
  6. Daniel Gallego - [email protected] 8 • Google Maps integration to:

    – Represent the ranking items after the user feedback process – Create routes – See restaurants details Recommendations Visualization: Map
  7. • 58 test users completed the survey (of 87) •

    Recruited from: – Computer Science and Engineering departments – Spanish theater group not related to the university or technological issues • Test users split up randomly into: – α group (evaluated first the Notification, then the Widget solution) – β group (first Widget, then Notification) Daniel Gallego - [email protected] 9 Evaluation
  8. Results: Notification and Widget Daniel Gallego - [email protected] 10 Notication-based

    scenarios responses Widget-based scenarios responses • Scenarios S1 and S2: – S1: On the way from home to work. Morning. You have not had breakfast – S2: Like S1, but you have had breakfast • Application ignored when recommendation not needed (intuitive result)
  9. Results: Notification and Widget Daniel Gallego - [email protected] 11 Notication-based

    scenarios responses Widget-based scenarios responses • Scenarios: – S3: On the way from work to home. Evening. You are not in a hurry – S4: Like S3, but you are in a hurry • Time pressure factor – Define when a proactive recommendation is reasonable – Users give less feedback when they are in a hurry
  10. Results: Notification and Widget Daniel Gallego - [email protected] 12 Notication-based

    scenarios responses Widget-based scenarios responses • Scenarios: – S5: Business trip. Lunch time. You have not had lunch – S6: Tourist weekend. Lunch time. You have not had lunch • Both solutions work well with typical non- proactive scenarios
  11. Results: Notification and Widget Daniel Gallego - [email protected] 13 0%

    10% 20% 30% 40% 50% 60% 70% 80% 90% 100% 1 (very bad) 2 (bad) 3 (normal) 4 (good) 5 (very good) 0% 10% 20% 30% 40% 50% 60% 70% 80% 90% 100% 1 (very bad) 2 (bad) 3 (normal) 4 (good) 5 (very good) Notication-based scenarios responses Widget-based scenarios responses • β users gave lower marks to Notification compare to α • Their perception about it was worse after testing the Widget solution
  12. Results: comparing both solutions Daniel Gallego - [email protected] 14 0%

    10% 20% 30% 40% 50% 60% 70% 80% 90% 100% Wb more easy to use than Nb Wb more annoying than Nb Wb saves more time/clicks than Nb Wb more comfortable than Nb Overall, Wb better than Nb 5 (totally agree) 4 (agree) 3 (similar) 2 (disagree) 1 (totally disagree) • Widget solution considered better to achieve proactivity by users: – When comparing both, Widget always had higher acceptance 50% 28%
  13. Conclusion • 2 proactive mobile user interfaces presented • Users

    liked Widget more than Notification: – Highly acceptance of both solutions – But notification is considered more annoying • “Time pressure” is important user context information in proactive applications • Item visualization (ranking + map): – Considered useful and effective – “Like/Dislike” feedback is very intuitive for users Daniel Gallego - [email protected] 15
  14. Future Work • Integration of the presented proactive solutions in

    a real system: – Field study evaluation – With people using the system in their daily life • Definition of a user context model for proactive scenarios in ubiquitous systems • Proactive cross-domains recommendations Daniel Gallego - [email protected] 16
  15. Evaluation: Demographic Data Daniel Gallego - [email protected] 18 76% 24%

    Have an smartphone? Yes No 72% 28% Gender Male Female 23% 40% 28% 9% Smartphone checking period Several times per hour Every hour Several times per day Few times per day 0 1 2 3 4 5 6 7 8 9 10 22 23 24 25 26 27 28 29 30 31 32 33 34 35 36 38 41 46 58 Age distribution