Customers – 22% take rate • Total capital cost: $811,563 • Per passing (426) - $1,593 • Per drop - $2,658 Projection Actual Internet 76% 67% Enhanced 10% 27% Tenant 14% 6%
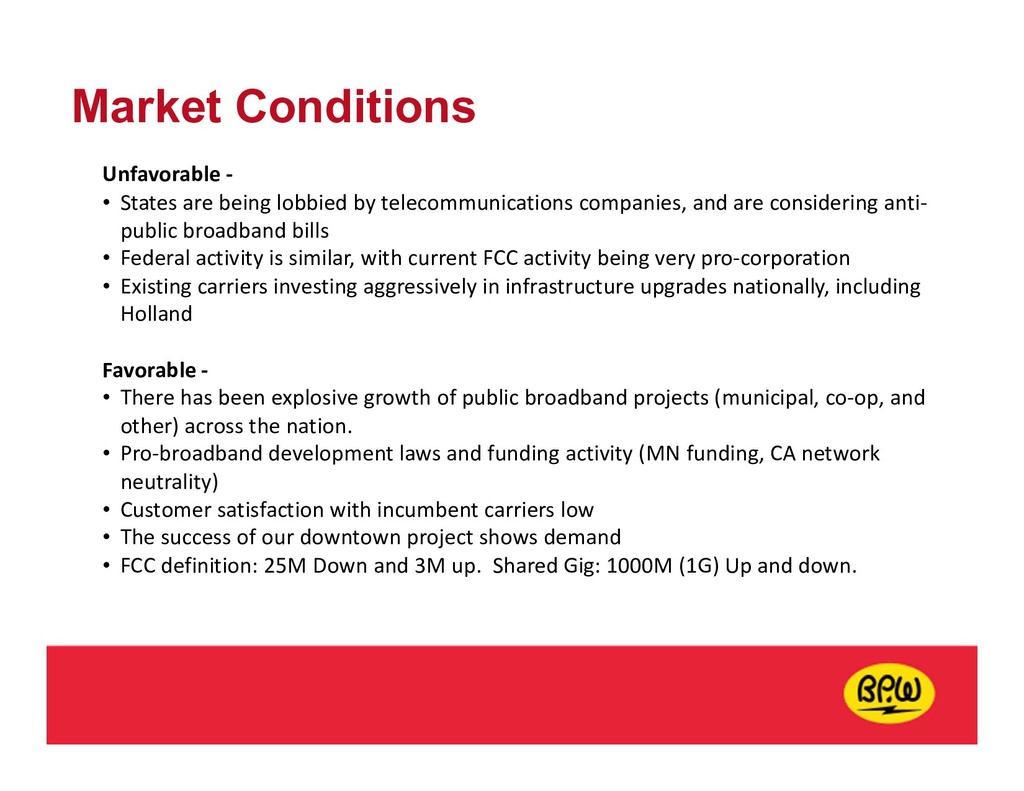
telecommunications companies, and are considering anti- public broadband bills • Federal activity is similar, with current FCC activity being very pro-corporation • Existing carriers investing aggressively in infrastructure upgrades nationally, including Holland Favorable - • There has been explosive growth of public broadband projects (municipal, co-op, and other) across the nation. • Pro-broadband development laws and funding activity (MN funding, CA network neutrality) • Customer satisfaction with incumbent carriers low • The success of our downtown project shows demand • FCC definition: 25M Down and 3M up. Shared Gig: 1000M (1G) Up and down.
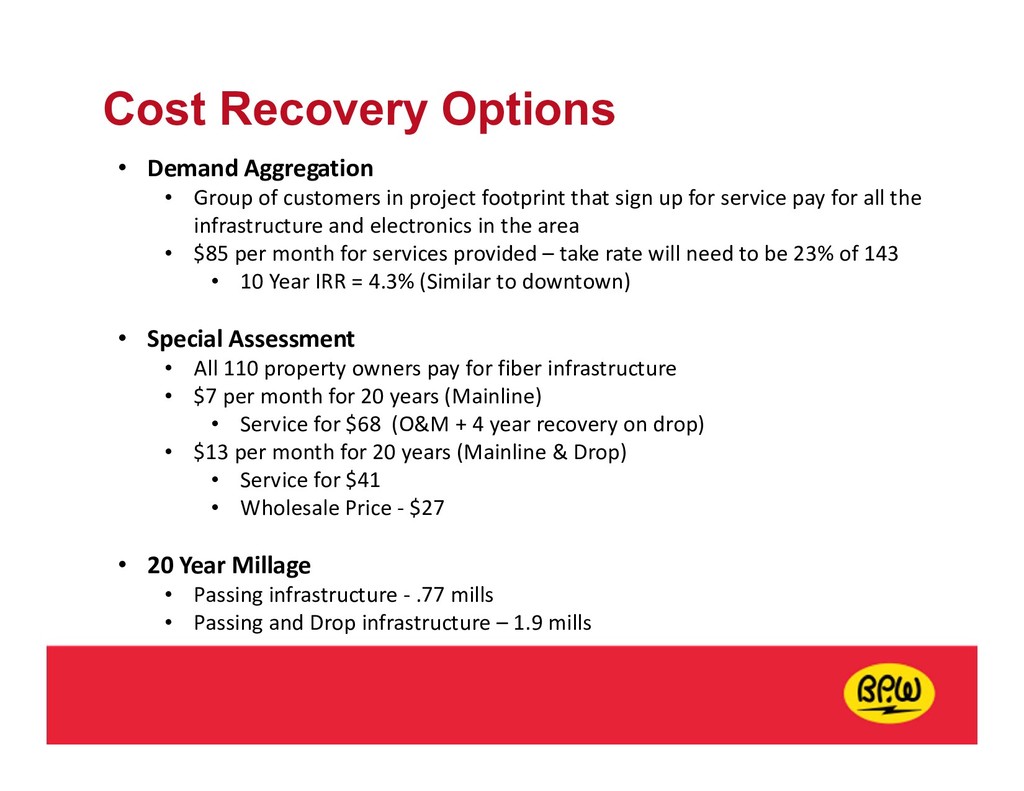
in project footprint that sign up for service pay for all the infrastructure and electronics in the area • $85 per month for services provided – take rate will need to be 23% of 143 • 10 Year IRR = 4.3% (Similar to downtown) • Special Assessment • All 110 property owners pay for fiber infrastructure • $7 per month for 20 years (Mainline) • Service for $68 (O&M + 4 year recovery on drop) • $13 per month for 20 years (Mainline & Drop) • Service for $41 • Wholesale Price - $27 • 20 Year Millage • Passing infrastructure - .77 mills • Passing and Drop infrastructure – 1.9 mills
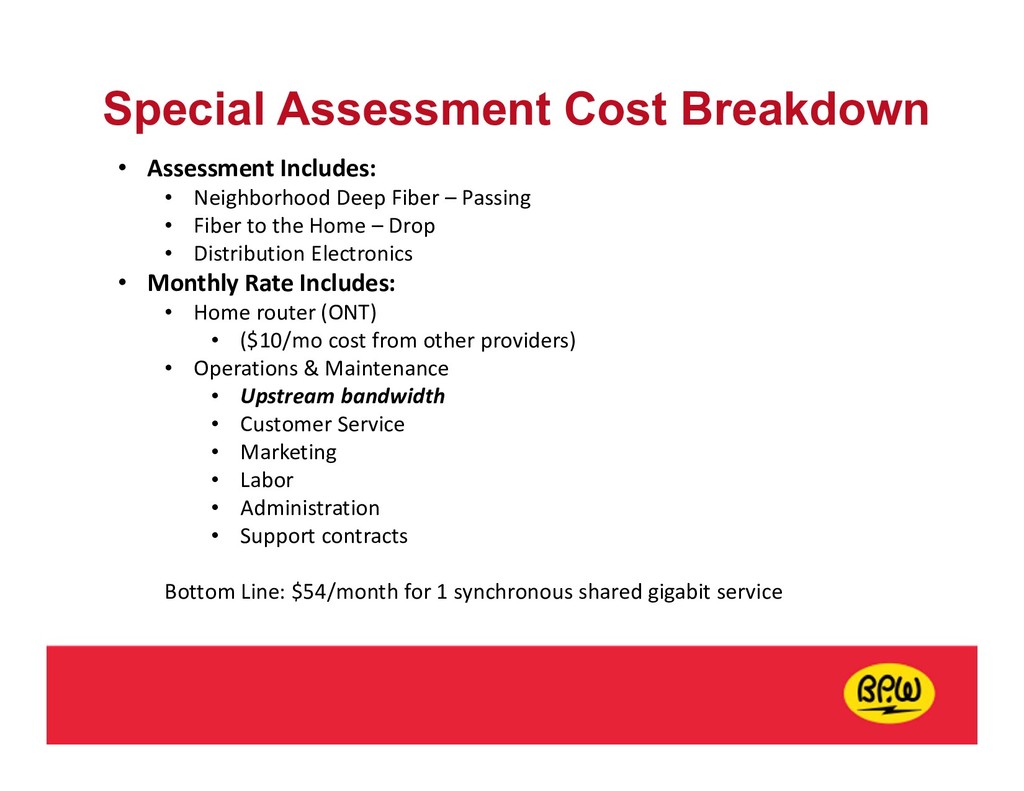
Fiber – Passing • Fiber to the Home – Drop • Distribution Electronics • Monthly Rate Includes: • Home router (ONT) • ($10/mo cost from other providers) • Operations & Maintenance • Upstream bandwidth • Customer Service • Marketing • Labor • Administration • Support contracts Bottom Line: $54/month for 1 synchronous shared gigabit service
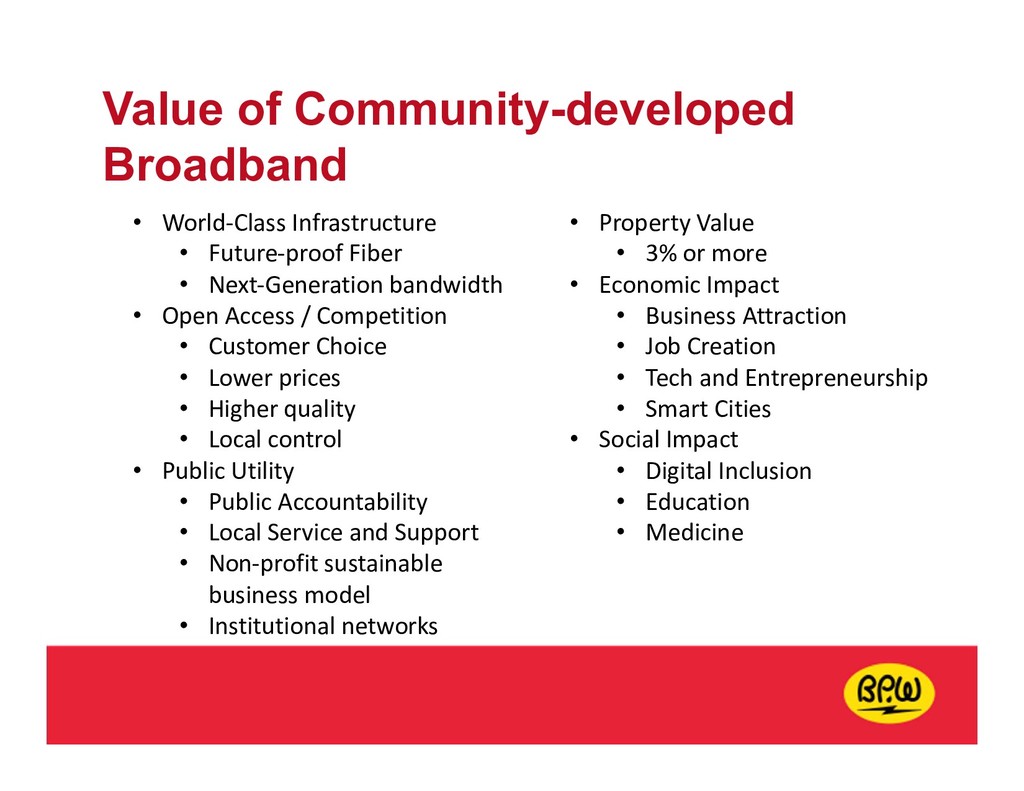
• Next-Generation bandwidth • Open Access / Competition • Customer Choice • Lower prices • Higher quality • Local control • Public Utility • Public Accountability • Local Service and Support • Non-profit sustainable business model • Institutional networks • Property Value • 3% or more • Economic Impact • Business Attraction • Job Creation • Tech and Entrepreneurship • Smart Cities • Social Impact • Digital Inclusion • Education • Medicine
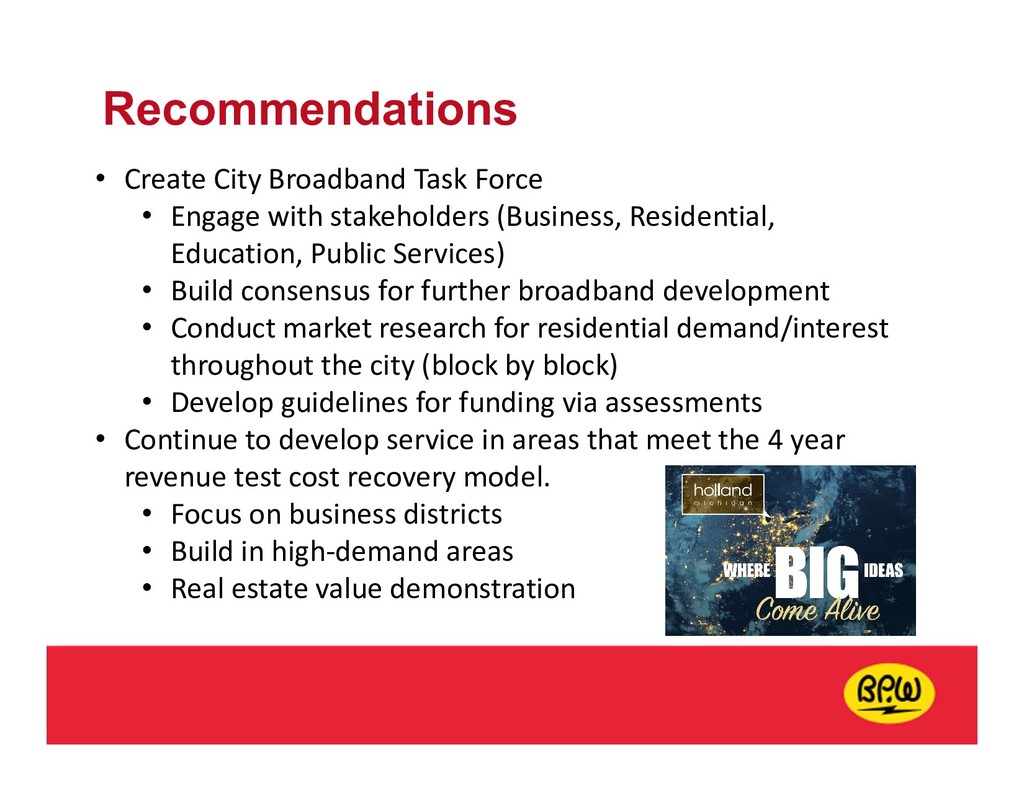
stakeholders (Business, Residential, Education, Public Services) • Build consensus for further broadband development • Conduct market research for residential demand/interest throughout the city (block by block) • Develop guidelines for funding via assessments • Continue to develop service in areas that meet the 4 year revenue test cost recovery model. • Focus on business districts • Build in high-demand areas • Real estate value demonstration