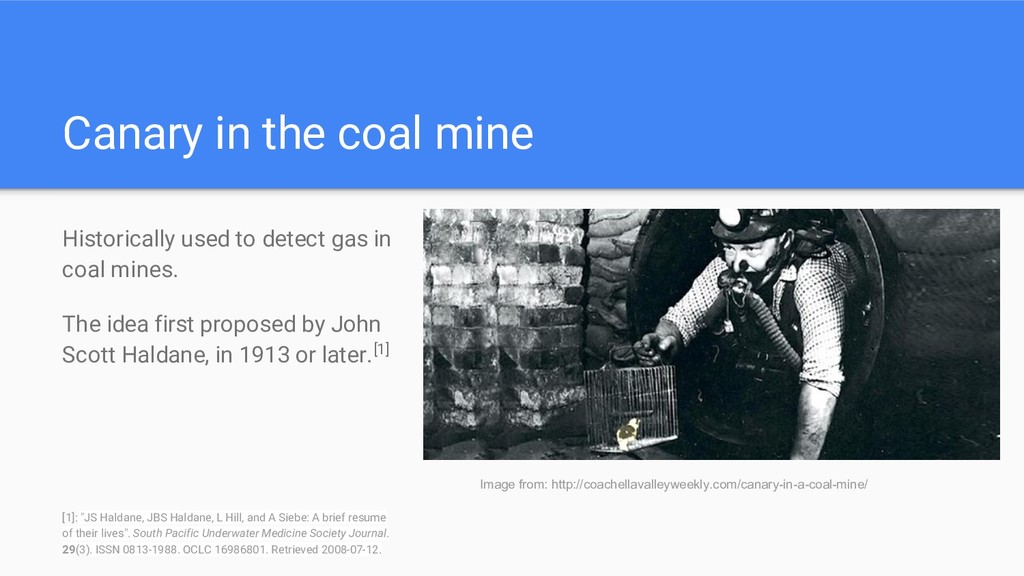
to detect gas in coal mines. The idea first proposed by John Scott Haldane, in 1913 or later.[1] [1]: "JS Haldane, JBS Haldane, L Hill, and A Siebe: A brief resume of their lives". South Pacific Underwater Medicine Society Journal. 29(3). ISSN 0813-1988. OCLC 16986801. Retrieved 2008-07-12.
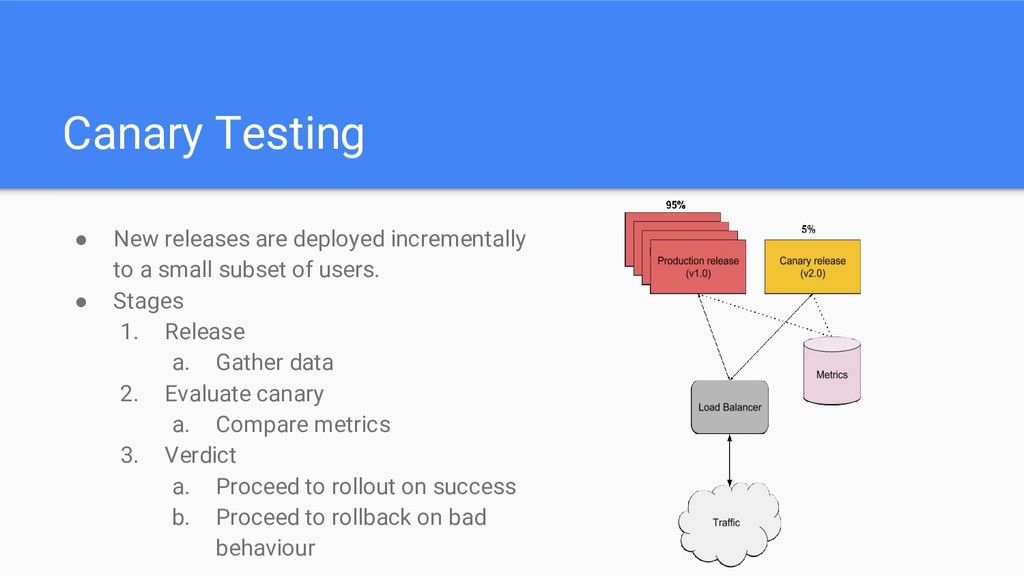
small subset of users. • Stages 1. Release a. Gather data 2. Evaluate canary a. Compare metrics 3. Verdict a. Proceed to rollout on success b. Proceed to rollback on bad behaviour
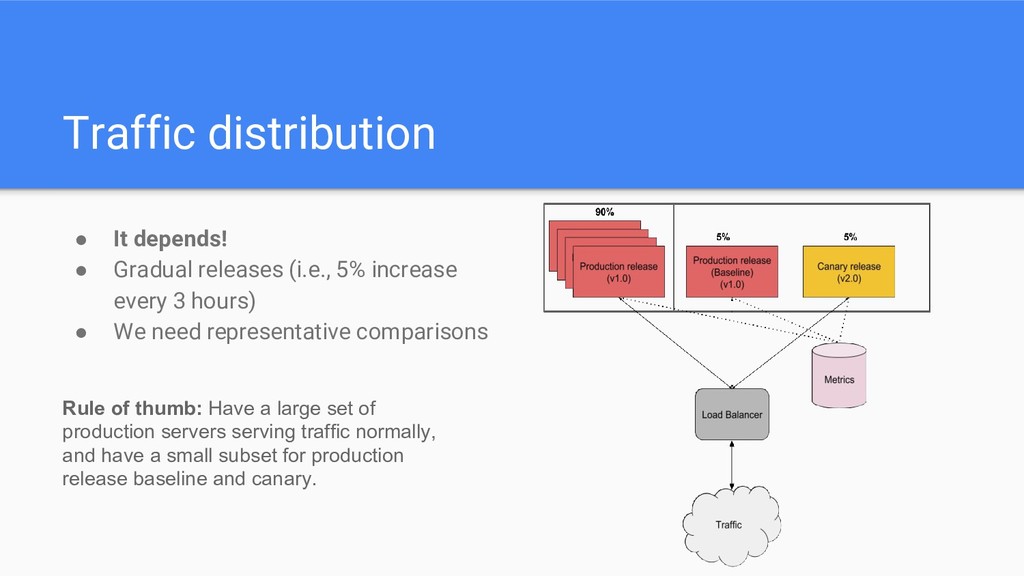
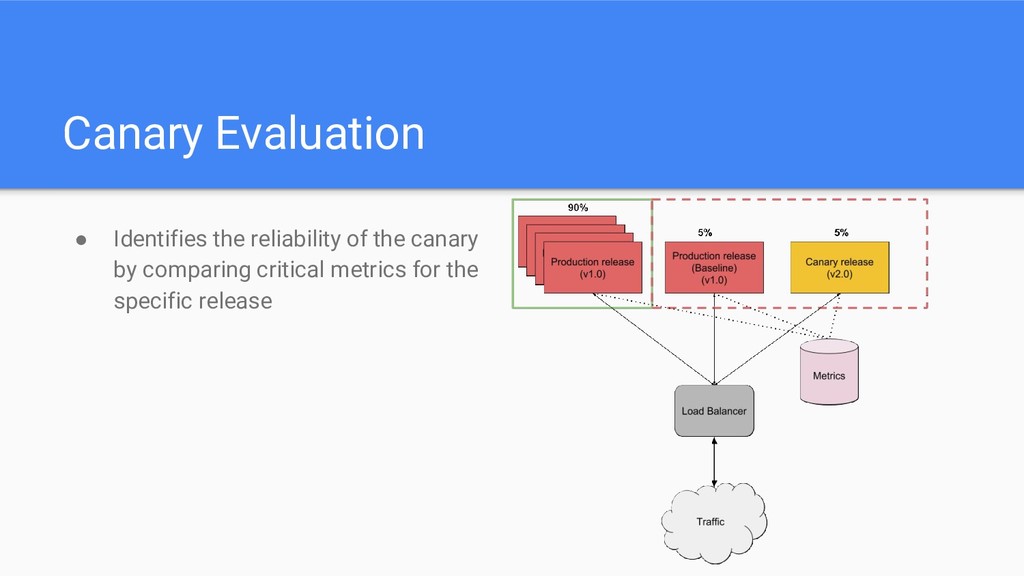
increase every 3 hours) • We need representative comparisons Rule of thumb: Have a large set of production servers serving traffic normally, and have a small subset for production release baseline and canary.
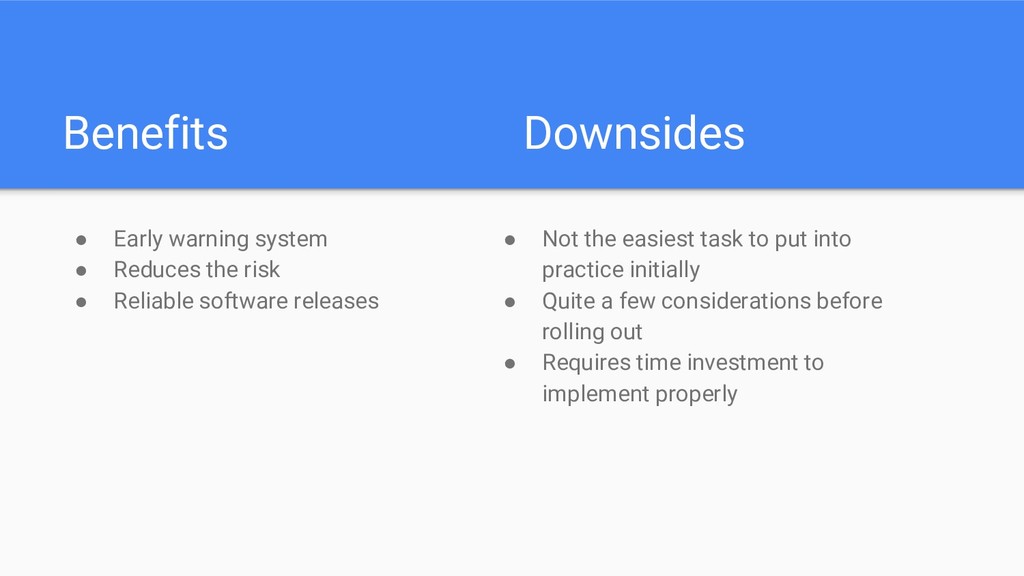
• Reliable software releases • Not the easiest task to put into practice initially • Quite a few considerations before rolling out • Requires time investment to implement properly
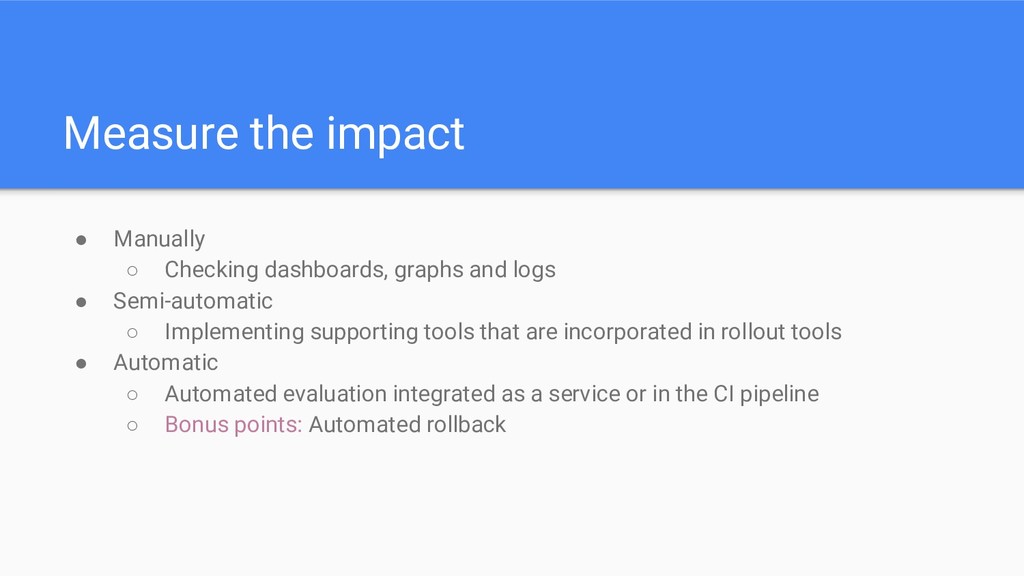
logs • Semi-automatic ◦ Implementing supporting tools that are incorporated in rollout tools • Automatic ◦ Automated evaluation integrated as a service or in the CI pipeline ◦ Bonus points: Automated rollback
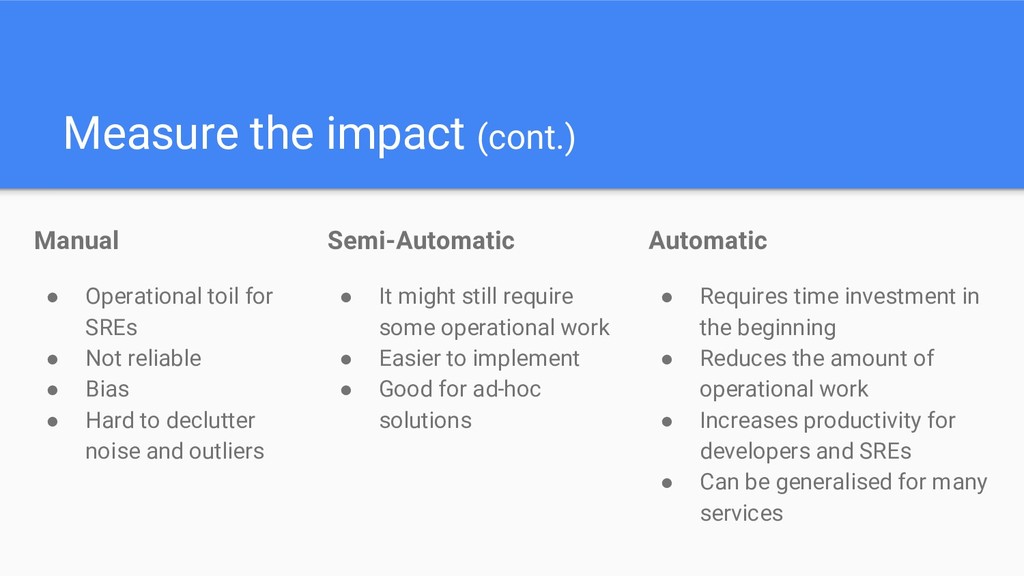
• Not reliable • Bias • Hard to declutter noise and outliers Semi-Automatic • It might still require some operational work • Easier to implement • Good for ad-hoc solutions Automatic • Requires time investment in the beginning • Reduces the amount of operational work • Increases productivity for developers and SREs • Can be generalised for many services
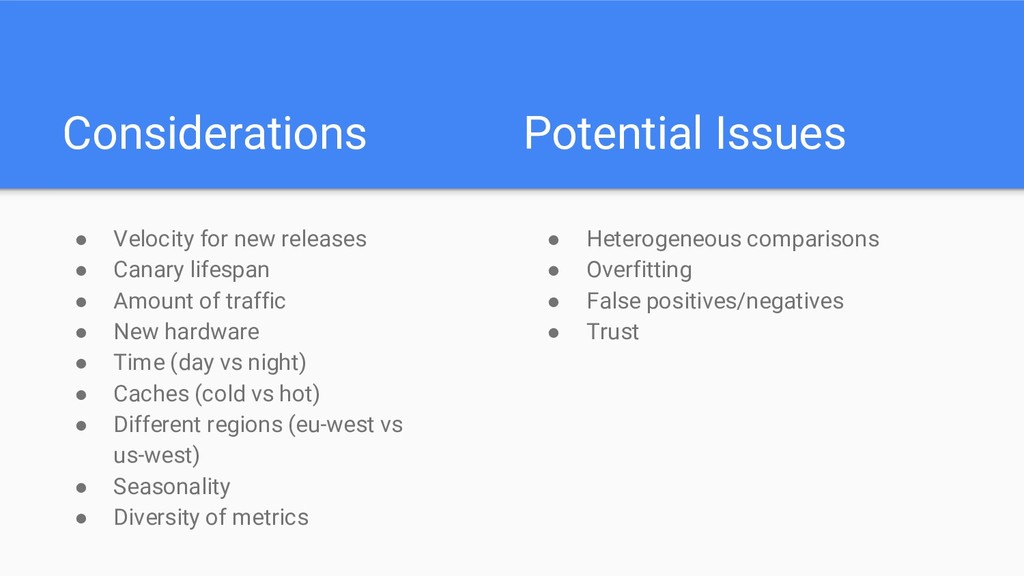
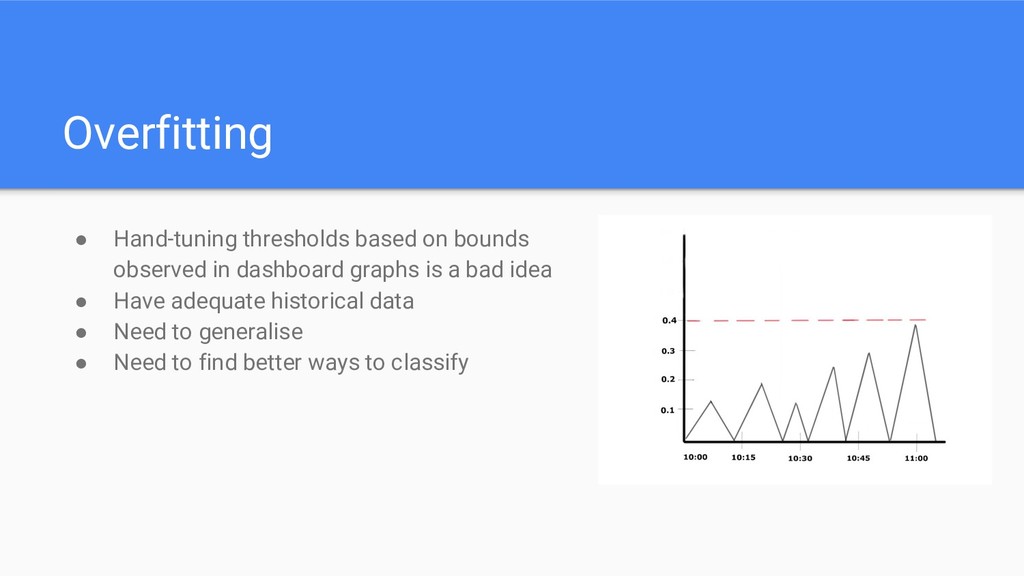
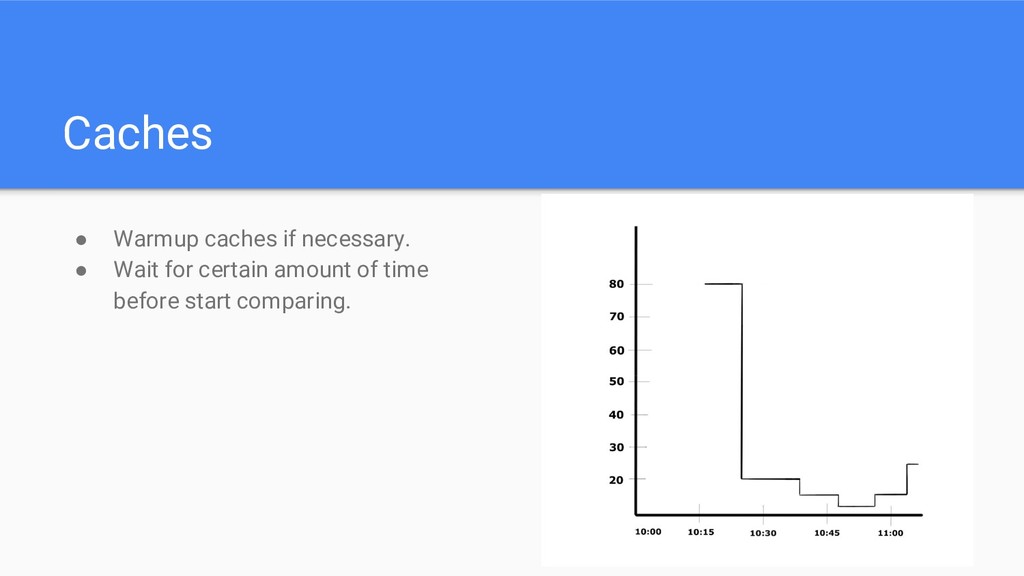
lifespan • Amount of traffic • New hardware • Time (day vs night) • Caches (cold vs hot) • Different regions (eu-west vs us-west) • Seasonality • Diversity of metrics • Heterogeneous comparisons • Overfitting • False positives/negatives • Trust
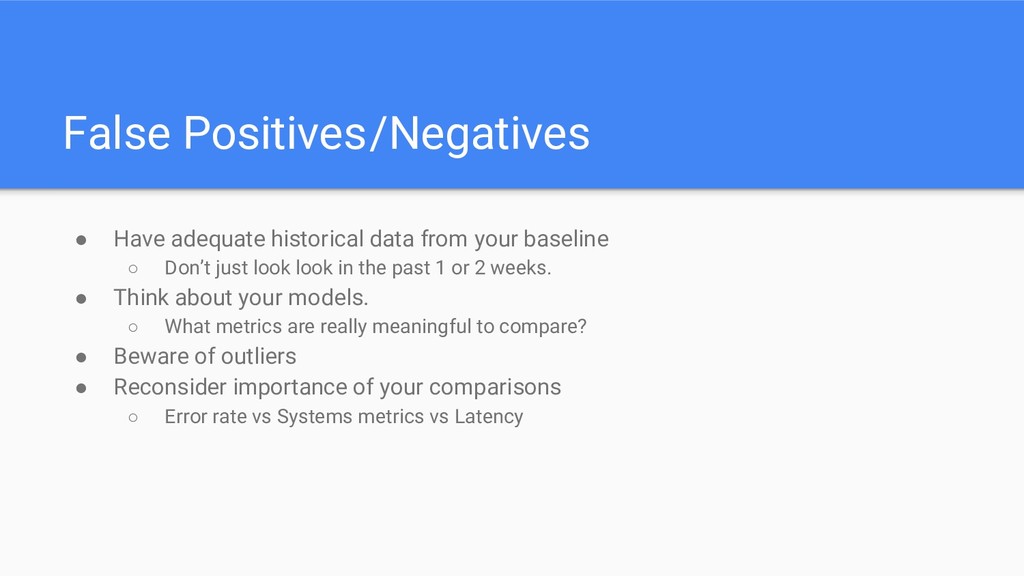
just look look in the past 1 or 2 weeks. • Think about your models. ◦ What metrics are really meaningful to compare? • Beware of outliers • Reconsider importance of your comparisons ◦ Error rate vs Systems metrics vs Latency False Positives/Negatives
any other public event will affect your metrics • High variance. • Difficult problem. Requires thorough investigation. • Start with moving averages. • Investigate different anomaly detection algorithms. ◦ Example: Anomaly Detection algorithm by Twitter for big events and public holidays.
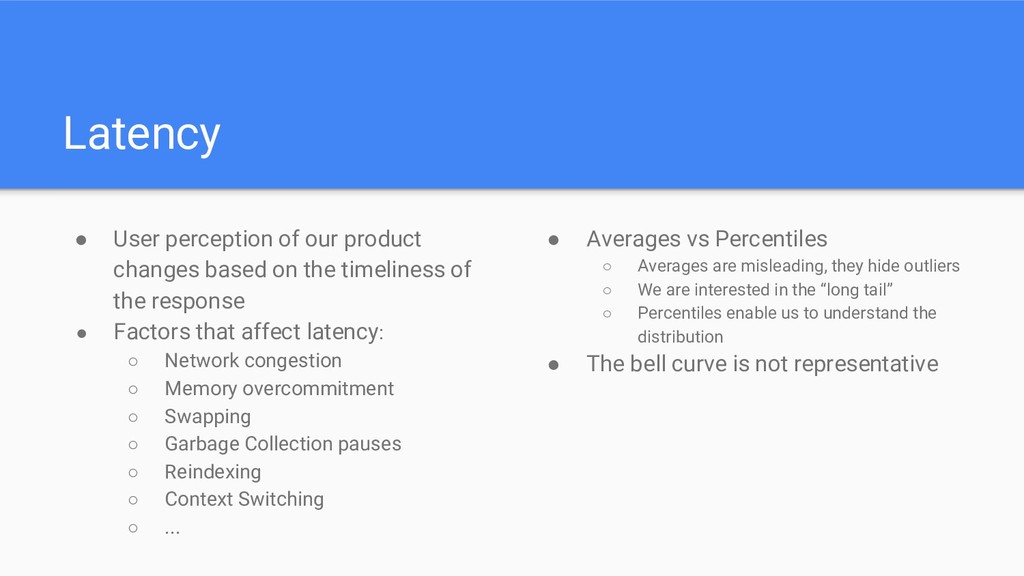
the timeliness of the response • Factors that affect latency: ◦ Network congestion ◦ Memory overcommitment ◦ Swapping ◦ Garbage Collection pauses ◦ Reindexing ◦ Context Switching ◦ ... • Averages vs Percentiles ◦ Averages are misleading, they hide outliers ◦ We are interested in the “long tail” ◦ Percentiles enable us to understand the distribution • The bell curve is not representative
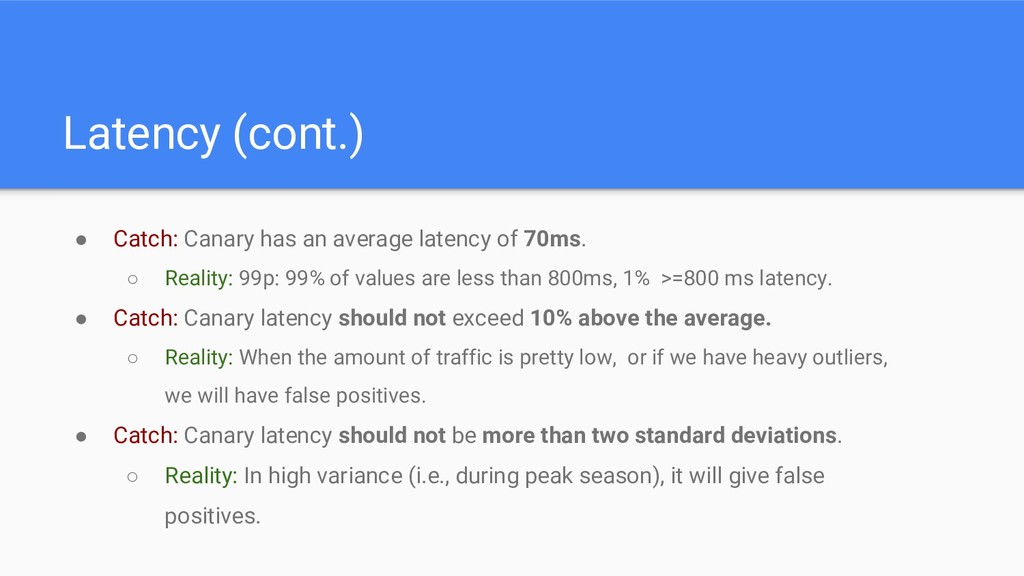
70ms. ◦ Reality: 99p: 99% of values are less than 800ms, 1% >=800 ms latency. • Catch: Canary latency should not exceed 10% above the average. ◦ Reality: When the amount of traffic is pretty low, or if we have heavy outliers, we will have false positives. • Catch: Canary latency should not be more than two standard deviations. ◦ Reality: In high variance (i.e., during peak season), it will give false positives.
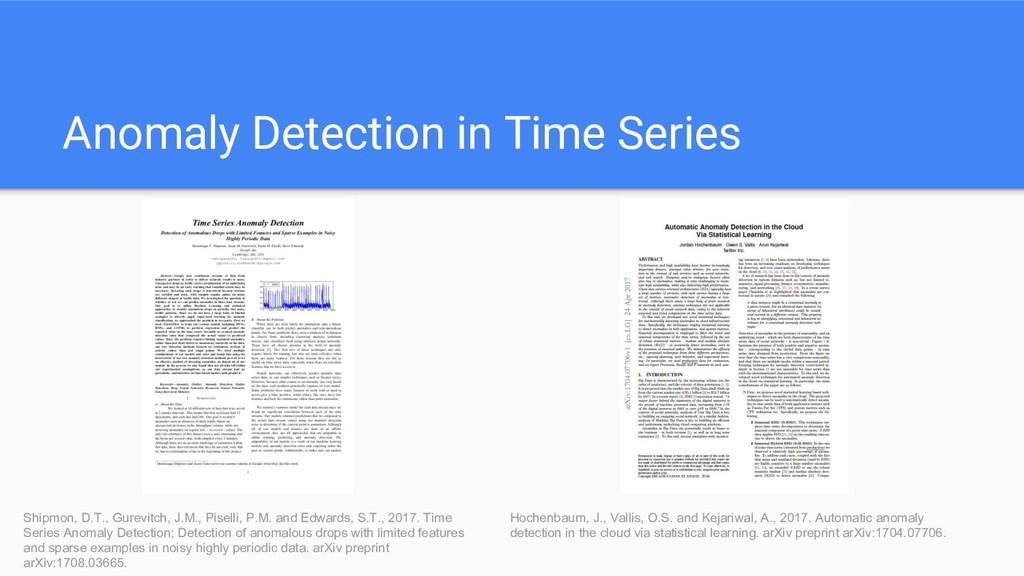
P.M. and Edwards, S.T., 2017. Time Series Anomaly Detection; Detection of anomalous drops with limited features and sparse examples in noisy highly periodic data. arXiv preprint arXiv:1708.03665. Hochenbaum, J., Vallis, O.S. and Kejariwal, A., 2017. Automatic anomaly detection in the cloud via statistical learning. arXiv preprint arXiv:1704.07706.
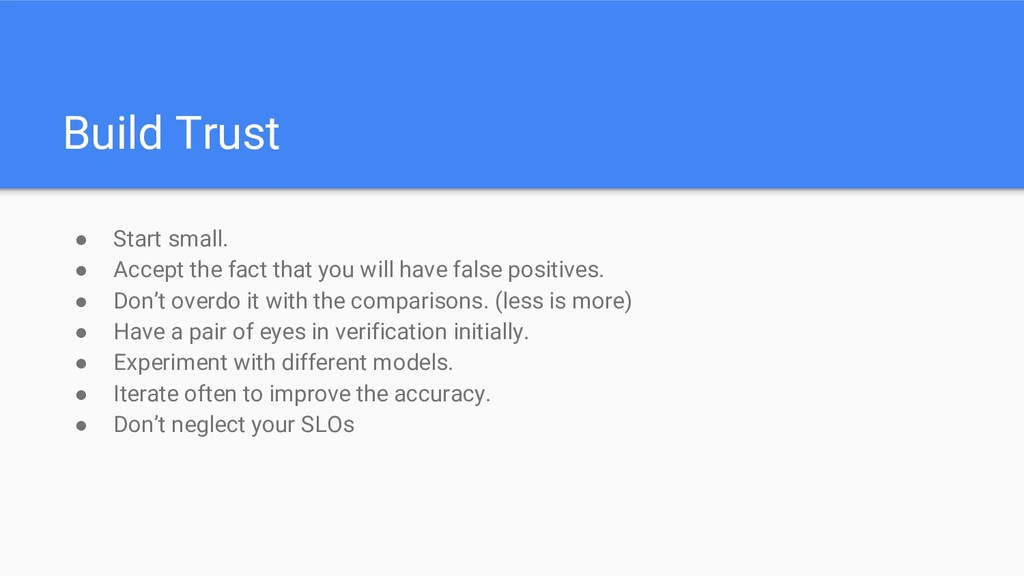
you will have false positives. • Don’t overdo it with the comparisons. (less is more) • Have a pair of eyes in verification initially. • Experiment with different models. • Iterate often to improve the accuracy. • Don’t neglect your SLOs
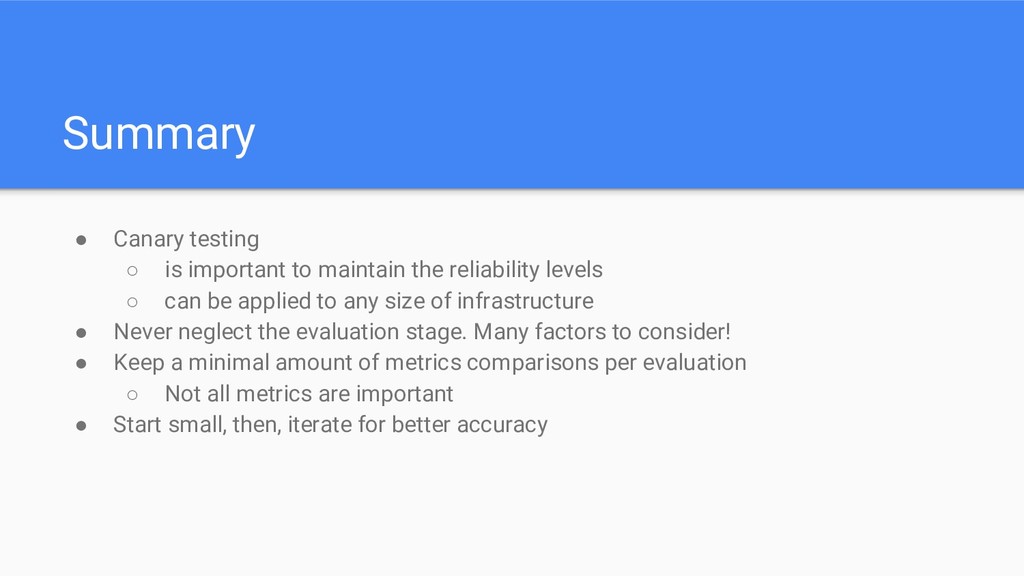
reliability levels ◦ can be applied to any size of infrastructure • Never neglect the evaluation stage. Many factors to consider! • Keep a minimal amount of metrics comparisons per evaluation ◦ Not all metrics are important • Start small, then, iterate for better accuracy
release canaries can save your bacon - CRE life lessons • Canary Analysis Service • Automated Canary Analysis at Netflix with Kayenta • Canarying Well: Lessons Learned from Canarying Large Populations • Introducing practical and robust anomaly detection in a time series • "How NOT to Measure Latency" by Gil Tene