$30 off During Our Annual Pro Sale. View Details »

What can student results tell us about school performance?

Dave Kinkead
December 09, 2015

What can student results tell us about school performance?

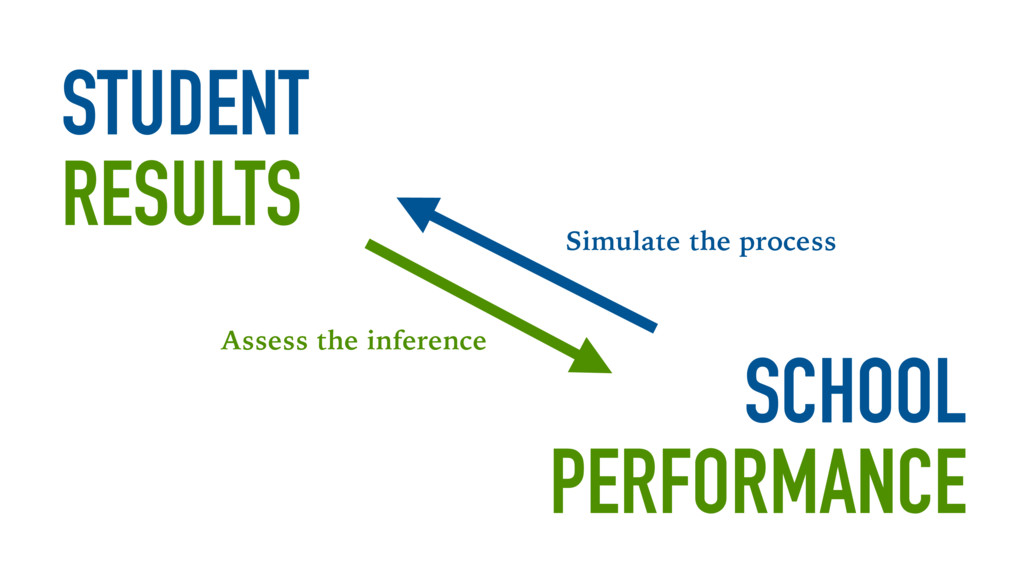
It seems likely that most people believe schooling somehow affects student ability. After all, we as a society invest significant amounts of time and money in various endeavours trying to measure exactly this. Yet these endeavours face an epistemic challenge. Because we can't measure the causal impact of schools directly, we can't know this causal impact with certainty. Instead, we infer the causal impact of schools on student ability by way of proxy measures such as student results. If student results improve, then we can infer that some aspect of schooling caused this. Perhaps.

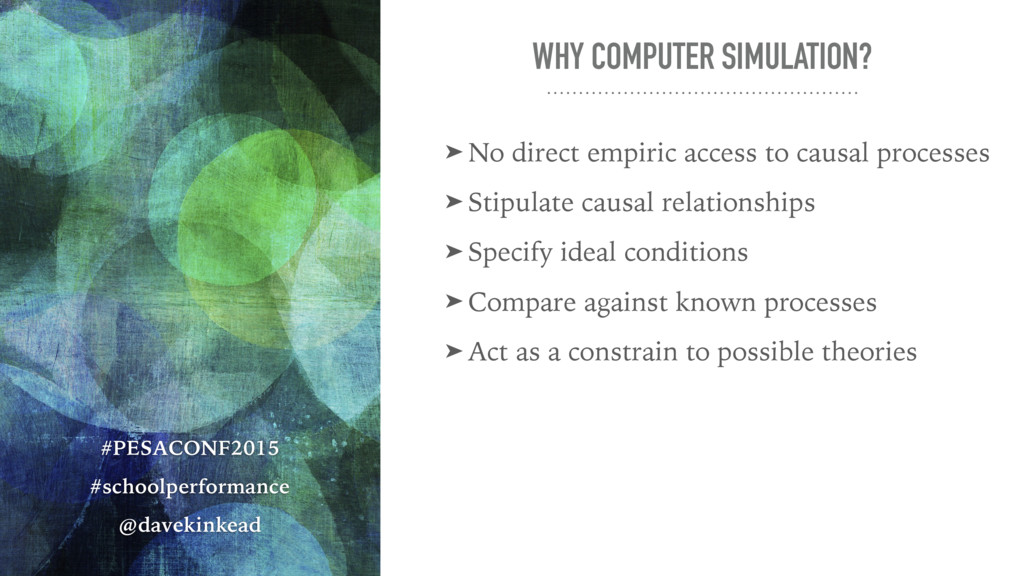
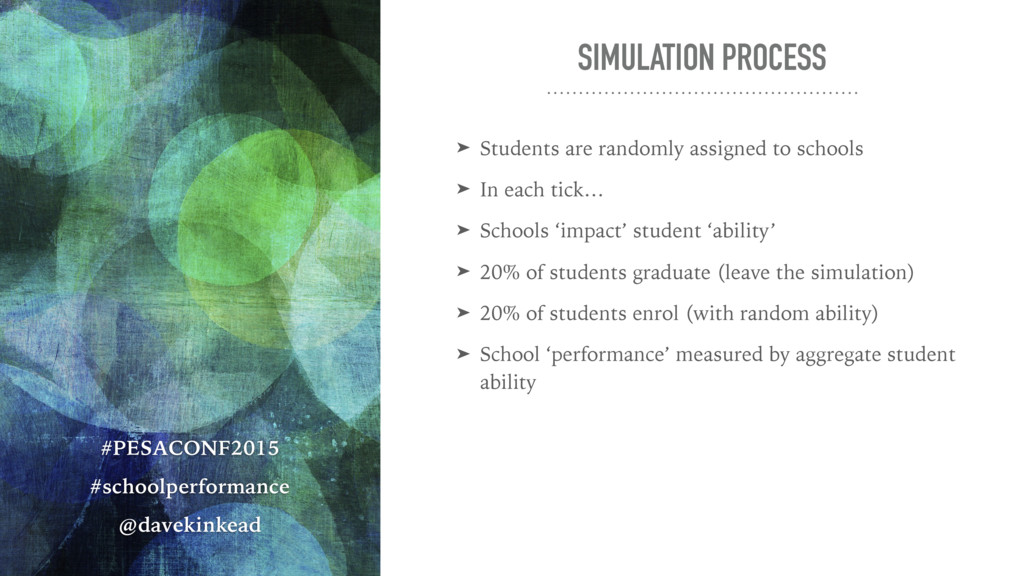
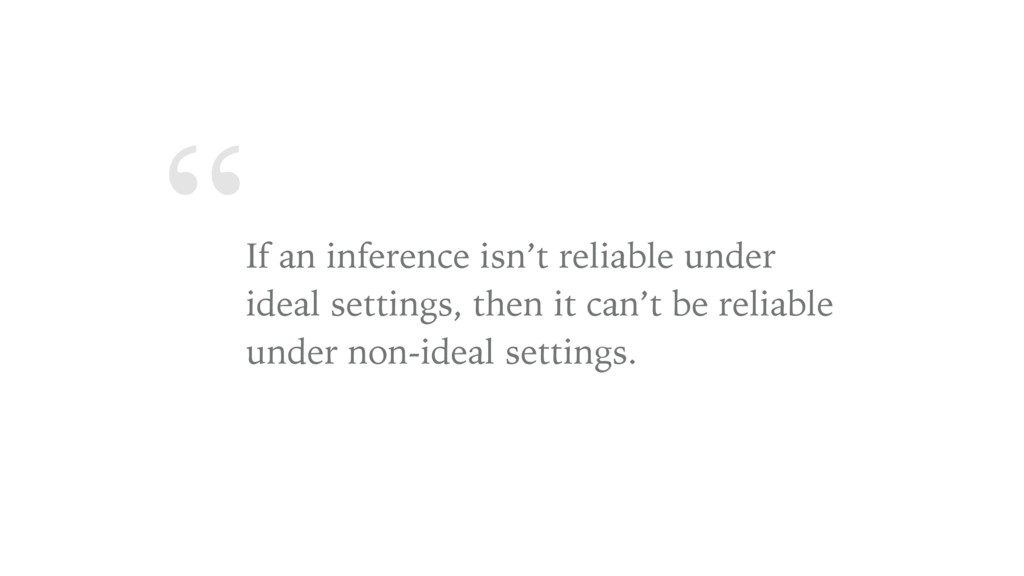
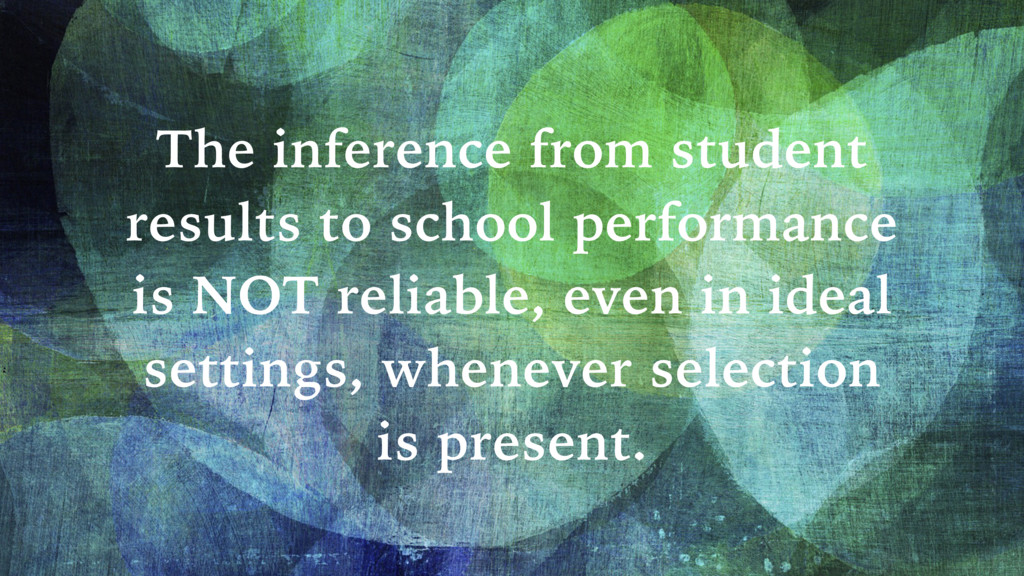
How warranted is this inference from student results to school performance? With the aid of computer simulation, I investigate the robustness of this inference mechanism in a variety of common scenarios. Simulation allows us to stipulate causal mechanisms that cannot be observed in the real word and measure how well our empiric inferences map actual causes. I show that when selectivity, either by student or school, is present, the inference mechanism from student results to school performance is very poor. And if our causal inferences fail when causes are known, they must also fail when causes are not known.

Dave Kinkead

December 09, 2015
Tweet

Other Decks in Education

Transcript

  1. WHAT CAN STUDENT RESULTS TELL
    US ABOUT SCHOOL PERFORMANCE?
    Dave Kinkead, University of Queensland

    View Slide

  2. WHICH
    SCHOOL DO
    WE CHOOSE?
    #PESACONF2015
    #schoolperformance
    @davekinkead

    View Slide

  3. MEASURING SCHOOL
    PERFORMANCE IS
    IMPORTANT
    #PESACONF2015
    #schoolperformance
    @davekinkead

    View Slide

  4. MEASURING SCHOOL
    PERFORMANCE IS
    DIFFICULT
    #PESACONF2015
    #schoolperformance
    @davekinkead

    View Slide

  5. STUDENT
    RESULTS
    SCHOOL
    PERFORMANCE

    View Slide

  6. HOW ROBUST IS THIS
    INFERENCE?
    #PESACONF2015
    #schoolperformance
    @davekinkead

    View Slide

  7. This is an
    argument for
    skepticism

    View Slide

  8. STUDENT
    RESULTS
    SCHOOL
    PERFORMANCE
    Assess the inference
    Simulate the process

    View Slide

  9. WHY COMPUTER SIMULATION?
    ➤ No direct empiric access to causal processes
    ➤ Stipulate causal relationships
    ➤ Specify ideal conditions
    ➤ Compare against known processes
    ➤ Act as a constrain to possible theories
    #PESACONF2015
    #schoolperformance
    @davekinkead

    View Slide


  10. If an inference isn’t reliable under
    ideal settings, then it can’t be reliable
    under non-ideal settings.

    View Slide

  11. THE MODEL

    View Slide

  12. STUDENT & SCHOOLS
    ➤ Students have randomly assigned ‘ability’ (0.0 - 1.0)
    ➤ Schools are collections of 1000 students
    ➤ Schools have stipulated ‘impact’ (0.0 - 1.0)
    ➤ School impact exclusively affects student ability
    ➤ School ‘performance’ perfectly tracks aggregate
    student ability
    #PESACONF2015
    #schoolperformance
    @davekinkead

    View Slide

  13. SIMULATION PROCESS
    ➤ Students are randomly assigned to schools
    ➤ In each tick…
    ➤ Schools ‘impact’ student ‘ability’
    ➤ 20% of students graduate (leave the simulation)
    ➤ 20% of students enrol (with random ability)
    ➤ School ‘performance’ measured by aggregate student
    ability
    #PESACONF2015
    #schoolperformance
    @davekinkead

    View Slide

  14. ENROLMENT
    ➤ The simulation has stipulated ‘selectivity’ (0.0 - 1.0)
    ➤ Students (selectivity %) will choose the top
    performing school
    ➤ Schools will accept the best students to maintain
    1000 students each
    ➤ The remainder will be randomly enrolled.
    #PESACONF2015
    #schoolperformance
    @davekinkead

    View Slide

  15. SANITY CHECKS
    ➤ Two schools of 1000 students
    ➤ No causal impact
    ➤ No selectivity
    ➤ dave.kinkead.com.au/school-performance/#sanity-check-1
    ➤ With causal impact
    ➤ dave.kinkead.com.au/school-performance/#sanity-check-2
    ➤ Student result to school performance inference is warranted

    View Slide

  16. SHIFTING AVERAGES
    ➤ Two schools
    ➤ No causal impact
    ➤ 50% selectivity
    ➤ http://dave.kinkead.com.au/school-performance/
    #shifting-averages
    ➤ One school always ‘out-performs’ despite schools
    being identical
    ➤ Student results to school performance inference is
    NOT warranted
    #PESACONF2015
    #schoolperformance
    @davekinkead

    View Slide

  17. DIFFERENTIAL PERFORMANCE
    ➤ Two schools
    ➤ Different causal impact
    ➤ No selectivity
    ➤ http://dave.kinkead.com.au/school-performance/
    #relative-1
    ➤ Student results to school performance inference is
    warranted
    ➤ With selectivity
    ➤ http://dave.kinkead.com.au/school-performance/
    #relative-2
    ➤ Student results to school performance inference is NOT
    warranted
    #PESACONF2015
    #schoolperformance
    @davekinkead

    View Slide

  18. WHAT CAN STUDENT
    RESULTS TELL US
    ABOUT SCHOOL
    PERFORMANCE?
    #PESACONF2015
    #schoolperformance
    @davekinkead

    View Slide


  19. If an inference isn’t reliable under
    ideal settings, then it can’t be reliable
    under non-ideal settings.

    View Slide

  20. The inference from student
    results to school performance
    is NOT reliable, even in ideal
    settings, whenever selection
    is present.

    View Slide

  21. #PESACONF2015
    #schoolperformance
    @davekinkead
    ➤ Which measures of school performance
    are vulnerable?
    ➤ Static, aggregative measures.
    ➤ To what extent is selection present in
    reality?
    ➤ Private vs public
    ➤ Student vs School
    WHAT NOW?

    View Slide

  22. dave.kinkead.com.au/school-performance
    @davekinkead
    [email protected]
    Questions?

    View Slide