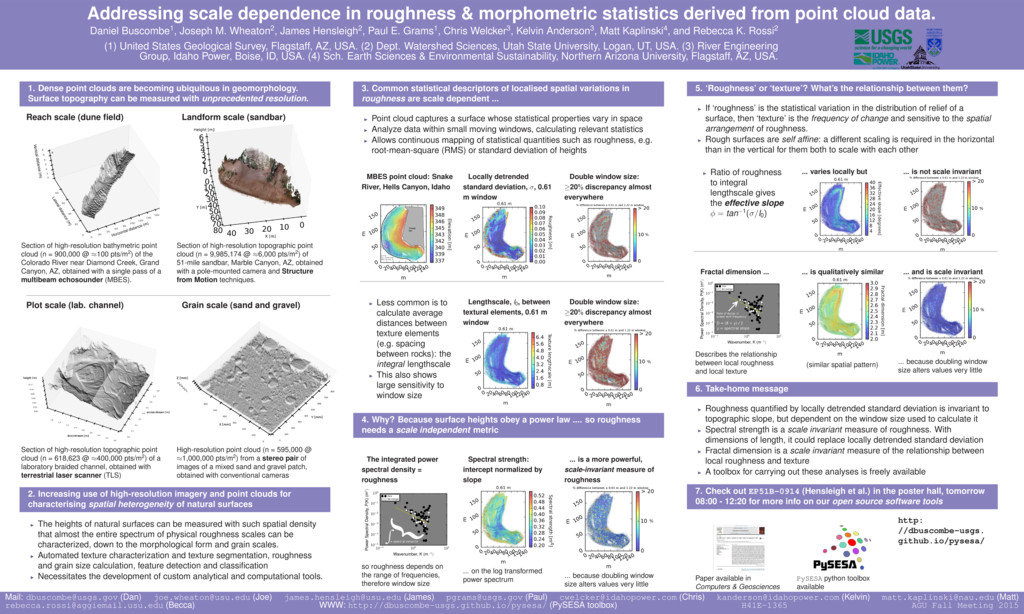
point cloud data. Daniel Buscombe1, Joseph M. Wheaton2, James Hensleigh2, Paul E. Grams1, Chris Welcker3, Kelvin Anderson3, Matt Kaplinski4, and Rebecca K. Rossi2 (1) United States Geological Survey, Flagstaff, AZ, USA. (2) Dept. Watershed Sciences, Utah State University, Logan, UT, USA. (3) River Engineering Group, Idaho Power, Boise, ID, USA. (4) Sch. Earth Sciences & Environmental Sustainability, Northern Arizona University, Flagstaff, AZ, USA. 1. Dense point clouds are becoming ubiquitous in geomorphology. Surface topography can be measured with unprecedented resolution. Reach scale (dune field) Section of high-resolution bathymetric point cloud (n = 900,000 @ ≈100 pts/m2) of the Colorado River near Diamond Creek, Grand Canyon, AZ, obtained with a single pass of a multibeam echosounder (MBES). Landform scale (sandbar) Section of high-resolution topographic point cloud (n = 9,985,174 @ ≈6,000 pts/m2) of 51-mile sandbar, Marble Canyon, AZ, obtained with a pole-mounted camera and Structure from Motion techniques. Plot scale (lab. channel) Section of high-resolution topographic point cloud (n = 618,623 @ ≈400,000 pts/m2) of a laboratory braided channel, obtained with terrestrial laser scanner (TLS) Grain scale (sand and gravel) High-resolution point cloud (n = 595,000 @ ≈1,000,000 pts/m2) from a stereo pair of images of a mixed sand and gravel patch, obtained with conventional cameras 2. Increasing use of high-resolution imagery and point clouds for characterising spatial heterogeneity of natural surfaces The heights of natural surfaces can be measured with such spatial density that almost the entire spectrum of physical roughness scales can be characterized, down to the morphological form and grain scales. Automated texture characterization and texture segmentation, roughness and grain size calculation, feature detection and classification Necessitates the development of custom analytical and computational tools. 3. Common statistical descriptors of localised spatial variations in roughness are scale dependent ... Point cloud captures a surface whose statistical properties vary in space Analyze data within small moving windows, calculating relevant statistics Allows continuous mapping of statistical quantities such as roughness, e.g. root-mean-square (RMS) or standard deviation of heights MBES point cloud: Snake River, Hells Canyon, Idaho Locally detrended standard deviation, σ, 0.61 m window Double window size: ≥20% discrepancy almost everywhere Less common is to calculate average distances between texture elements (e.g. spacing between rocks): the integral lengthscale This also shows large sensitivity to window size Lengthscale, l0 , between textural elements, 0.61 m window Double window size: ≥20% discrepancy almost everywhere 4. Why? Because surface heights obey a power law .... so roughness needs a scale independent metric The integrated power spectral density = roughness so roughness depends on the range of frequencies, therefore window size Spectral strength: intercept normalized by slope ... on the log transformed power spectrum ... is a more powerful, scale-invariant measure of roughness ... because doubling window size alters values very little 5. ‘Roughness’ or ‘texture’? What’s the relationship between them? If ‘roughness’ is the statistical variation in the distribution of relief of a surface, then ‘texture’ is the frequency of change and sensitive to the spatial arrangement of roughness. Rough surfaces are self affine: a different scaling is required in the horizontal than in the vertical for them both to scale with each other Ratio of roughness to integral lengthscale gives the effective slope φ = tan−1(σ/l0) ... varies locally but ... is not scale invariant Fractal dimension ... Describes the relationship between local roughness and local texture ... is qualitatively similar (similar spatial pattern) ... and is scale invariant ... because doubling window size alters values very little 6. Take-home message Roughness quantified by locally detrended standard deviation is invariant to topographic slope, but dependent on the window size used to calculate it Spectral strength is a scale invariant measure of roughness. With dimensions of length, it could replace locally detrended standard deviation Fractal dimension is a scale invariant measure of the relationship between local roughness and texture A toolbox for carrying out these analyses is freely available 7. Check out EP51B-0914 (Hensleigh et al.) in the poster hall, tomorrow 08:00 - 12:20 for more info on our open source software tools Paper available in Computers & Geosciences PySESA python toolbox available http: //dbuscombe-usgs. github.io/pysesa/ Mail:
[email protected] (Dan)
[email protected] (Joe)
[email protected] (James)
[email protected] (Paul)
[email protected] (Chris)
[email protected] (Kelvin)
[email protected] (Matt)
[email protected] (Becca) WWW: http://dbuscombe-usgs.github.io/pysesa/ (PySESA toolbox) H41E-1365 AGU Fall Meeting 2015