Upgrade to Pro — share decks privately, control downloads, hide ads and more …

The Digital Grain Size Web Application

The Digital Grain Size Web Application

Presented to the USGS Center for Data Integration, March 2016

Daniel Buscombe

March 10, 2016
Tweet

More Decks by Daniel Buscombe

Other Decks in Science

Transcript

  1. The Digital Grain Size Web Application Daniel Buscombe Grand Canyon

    Monitoring & Research Center U.S. Geological Survey, Flagstaff, AZ. [email protected]
  2. Outline • Why take pictures of sediment? • How do

    you estimate grain size from those images? • https://digitalgrainsize.org/ • The future?
  3. Why take pictures of sediment? Traditional particle size analysis (sieves,

    laser diffraction settling tube, etc) is costly and slow Physical sampling (heavy, can be intrusive) Laboratory analysis No ’real-time’ data Using digital imagery instead ... • No physical samples required • No laboratory analysis • Huge increase in temporal resolution and/or spatial coverage
  4. Why take pictures of sediment? Using digital imagery ... •

    Huge increase in spatial coverage of river bed sediment sampling on the Colorado River in Grand Canyon • The map on the right is composed of ~5,000 grain size measurements over 30 miles
  5. Why take pictures of sediment? Huge increase in temporal resolution

    You can’t always visit your field site The plots on the right are ~7,000 grain size measurements over ~18 months Offshore of Santa Cruz, California, 2008 - 2010
  6. Why take pictures of sediment? You can’t always visit your

    field site! Images from Mars Rovers Images from deep ocean (courtesy of British Geological Survey)
  7. How do you estimate grain size? Rubin (2004) J. Sed.

    Res Buscombe (2008), Sedimentary Geology Buscombe, Rubin & Warrick (2010) Journal of Geophysical Research Buscombe & Rubin (2012) Journal of Geophysical Research
  8. Buscombe (2013) Sedimentology How do you estimate grain size? Wavelet

    method to estimate grain size-distribution directly from image, with no calibration or tunable parameters
  9. Used by (at least) 50 institutions in 12 countries US

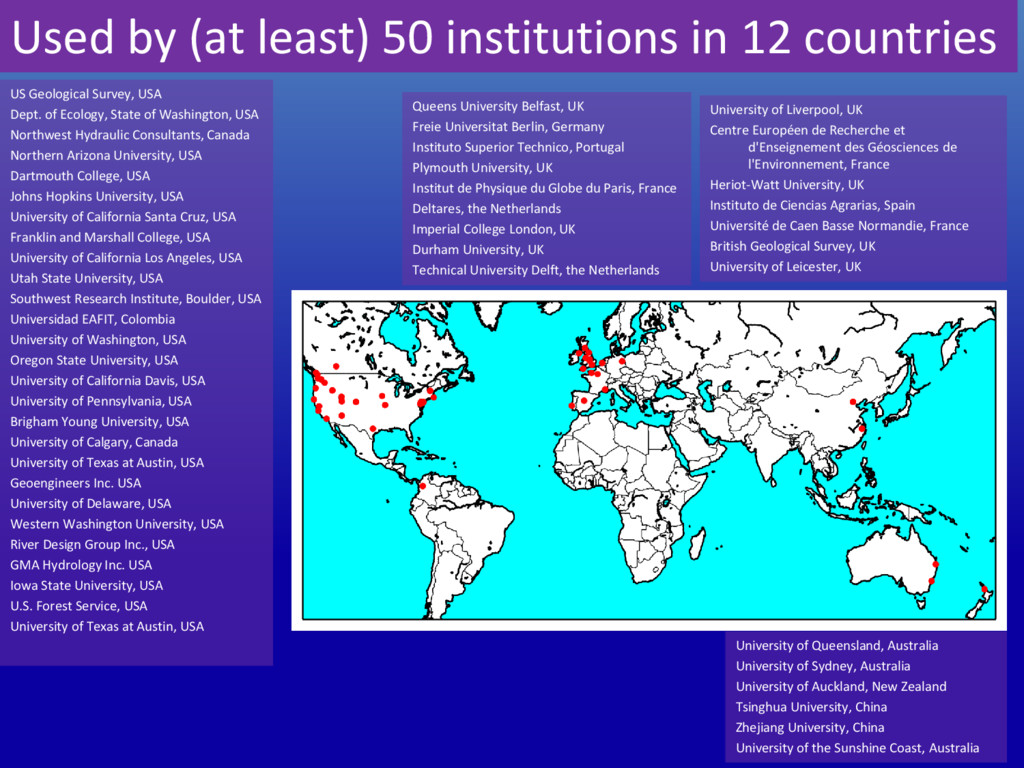
    Geological Survey, USA Dept. of Ecology, State of Washington, USA Northwest Hydraulic Consultants, Canada Northern Arizona University, USA Dartmouth College, USA Johns Hopkins University, USA University of California Santa Cruz, USA Franklin and Marshall College, USA University of California Los Angeles, USA Utah State University, USA Southwest Research Institute, Boulder, USA Universidad EAFIT, Colombia University of Washington, USA Oregon State University, USA University of California Davis, USA University of Pennsylvania, USA Brigham Young University, USA University of Calgary, Canada University of Texas at Austin, USA Geoengineers Inc. USA University of Delaware, USA Western Washington University, USA River Design Group Inc., USA GMA Hydrology Inc. USA Iowa State University, USA U.S. Forest Service, USA University of Texas at Austin, USA Queens University Belfast, UK Freie Universitat Berlin, Germany Instituto Superior Technico, Portugal Plymouth University, UK Institut de Physique du Globe du Paris, France Deltares, the Netherlands Imperial College London, UK Durham University, UK Technical University Delft, the Netherlands University of Queensland, Australia University of Sydney, Australia University of Auckland, New Zealand Tsinghua University, China Zhejiang University, China University of the Sunshine Coast, Australia University of Liverpool, UK Centre Européen de Recherche et d'Enseignement des Géosciences de l'Environnement, France Heriot-Watt University, UK Instituto de Ciencias Agrarias, Spain Université de Caen Basse Normandie, France British Geological Survey, UK University of Leicester, UK
  10. Why? • Accessibility: command line tools on local machines are

    hard to install and maintain • Batch processing of thousands of images leveraging cloud rather than personal computing • Monitor usage of the program • Easier to deploy program updates • Funded by CDI, 2015 (thanks!!) • Developed by North Arrow Research (www.northarrowresearch.com) The Digital Grain Size Web Application https://digitalgrainsize.org/
  11. • Add more features, such as Image filtering, Interactive drawing

    ROIs Better graphing tools • Deploy to the USGS ‘Cloud Hosting Solutions’ • Mobile computing application for tablets and phones with no internet – field data collection The future?
  12. Thanks for listening • Python: https://pypi.python.org/pypi/pyDGS https://github.com/dbuscombe-usgs/pyDGS • Matlab: https://github.com/dbuscombe-usgs/DGS

    • Web application: https://digitalgrainsize.org Daniel Buscombe Grand Canyon Monitoring & Research Center U.S. Geological Survey, Flagstaff, AZ. [email protected]