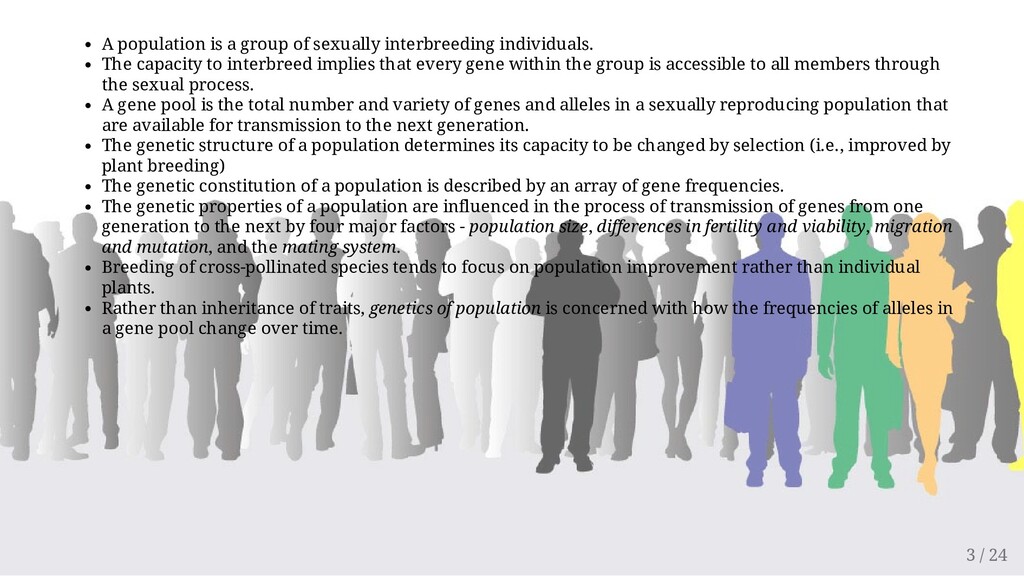
capacity to interbreed implies that every gene within the group is accessible to all members through the sexual process. A gene pool is the total number and variety of genes and alleles in a sexually reproducing population that are available for transmission to the next generation. The genetic structure of a population determines its capacity to be changed by selection (i.e., improved by plant breeding) The genetic constitution of a population is described by an array of gene frequencies. The genetic properties of a population are influenced in the process of transmission of genes from one generation to the next by four major factors - population size, differences in fertility and viability, migration and mutation, and the mating system. Breeding of cross-pollinated species tends to focus on population improvement rather than individual plants. Rather than inheritance of traits, genetics of population is concerned with how the frequencies of alleles in a gene pool change over time. 3 / 24
for each subsequent generation whereas the genes carried by the population have continuity from one generation to the next. Plant breeders often work with genetic phenomena in populations that exhibit no apparent Mendelian segregation, even though in actuality, they obey Mendelian laws. Mendel worked with genes whose effects were categorical (kinds) and were readily classifiable (ratios) into kinds in the progeny of crosses. Breeders, on the other hand, are usually concerned about differences in populations measured in degrees rather than kinds. Population genetics uses mathematical models to attempt to describe population phenomena. It is, thus, necessary to make assumptions about the population and its environment. 5 / 24
the different alleles of a gene in a population. To obtain these proportions we count the total number of organisms with various genotypes in the population and estimate the relative frequencies of the alleles involved. To understand the genetic structure of population, consider a large population in which random mating occurs, with no mutation or gene flow between this population and others, no selective advantage for any genotype, and normal meiosis. 6 / 24
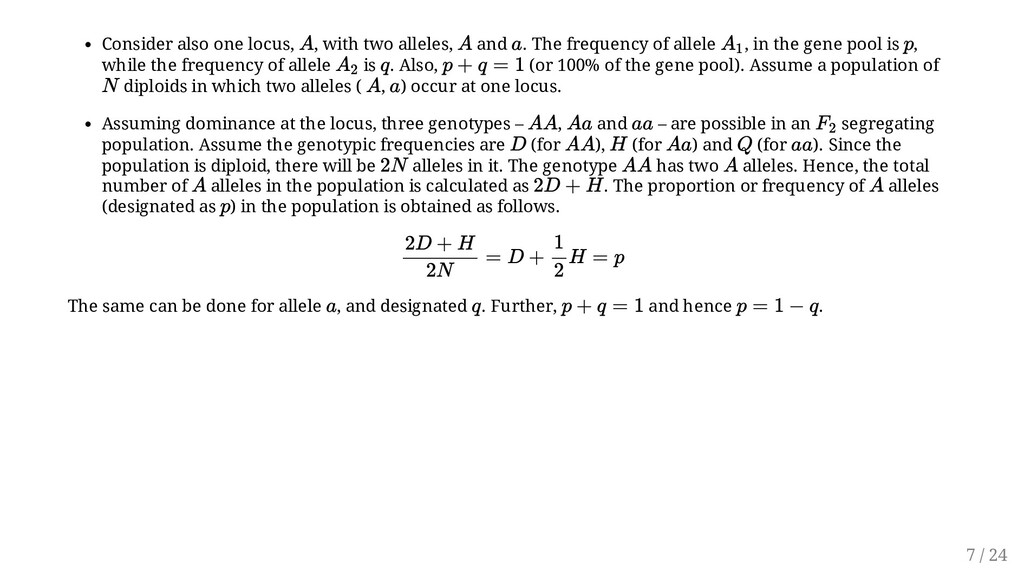
The frequency of allele , in the gene pool is , while the frequency of allele is . Also, (or 100% of the gene pool). Assume a population of diploids in which two alleles ( , ) occur at one locus. Assuming dominance at the locus, three genotypes – , and – are possible in an segregating population. Assume the genotypic frequencies are (for ), (for ) and (for ). Since the population is diploid, there will be alleles in it. The genotype has two alleles. Hence, the total number of alleles in the population is calculated as . The proportion or frequency of alleles (designated as ) in the population is obtained as follows. The same can be done for allele , and designated . Further, and hence . A A a A 1 p A 2 q p + q = 1 N A a AA Aa aa F 2 D AA H Aa Q aa 2N AA A A 2D + H A p = D + H = p 2D + H 2N 1 2 a q p + q = 1 p = 1 − q 7 / 24
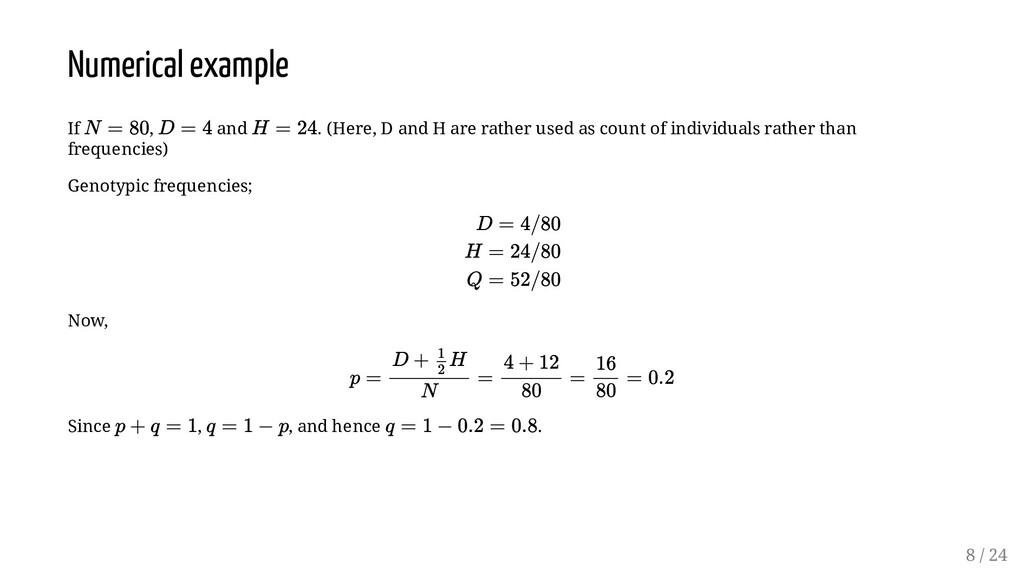
are rather used as count of individuals rather than frequencies) Genotypic frequencies; Now, Since , , and hence . N = 80 D = 4 H = 24 D = 4/80 H = 24/80 Q = 52/80 p = = = = 0.2 D + H 1 2 N 4 + 12 80 16 80 p + q = 1 q = 1 − p q = 1 − 0.2 = 0.8 8 / 24
equal chance of mating with any female gamete). Random mating involving the previous locus (A/a) will yield the following genotypes: , , and , with the corresponding frequencies of , respectively. The gene frequencies must add up to the unity. Consequently, . This mathematical relationship is called Hardy-Weinberg equilibrium. Hardy, from England, and Weinberg, from Germany, discovered that equilibrium between genes and genotypes is achieved in large populations. They showed that the frequency of genotypes in a population depends on the frequency of genes in the preceding generation, not on the frequency of the genotypes. AA Aa aa p 2 + 2pq + q 2 p2 + 2pq + q 2 = 1 10 / 24
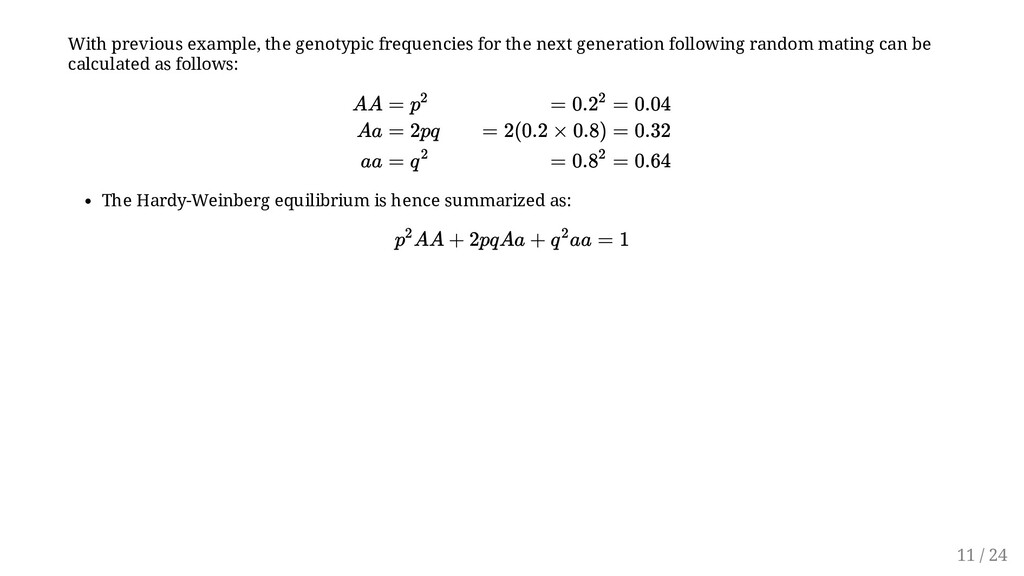
following random mating can be calculated as follows: The Hardy-Weinberg equilibrium is hence summarized as: AA = p 2 = 0.2 2 = 0.04 Aa = 2pq = 2(0.2 × 0.8) = 0.32 aa = q 2 = 0.8 2 = 0.64 p 2 AA + 2pqAa + q 2 aa = 1 11 / 24
before, about three plants will have a genotype of , 26 will be , and 51, . Using the previous formula, the frequencies of the genes in the next generation may be calculated as: And, The allele frequencies have remained unchanged, while the genotypic frequencies have changed (for AA, Aa, and aa, respectively) from 4, 24, and 52, to 3, 26, and 51. However, in subsequent generations, both the genotype and gene frequencies will remain unchanged, provided that: Random mating occurs in a very large diploid population; Allele and allele are equally fit (one does not confer a superior trait than the other); There is no differential migration of one allele into or out of the population; The mutation rate of allele is equal to that of allele . AA Aa aa P = = = 0.2 D + H 1 2 N 3 + 13 80 q = 1 − p = 0.8 A a A a 12 / 24
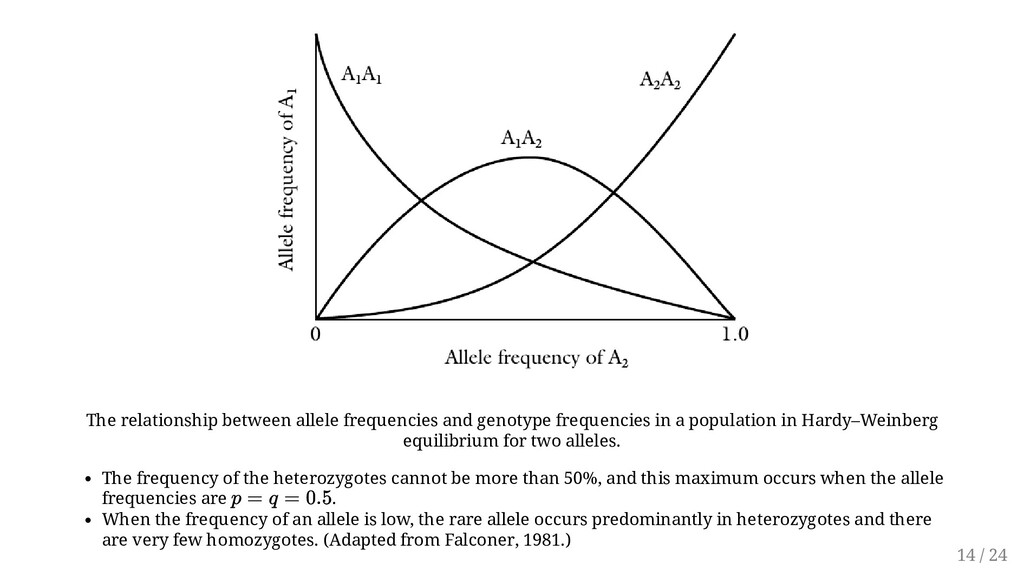
population in Hardy–Weinberg equilibrium for two alleles. The frequency of the heterozygotes cannot be more than 50%, and this maximum occurs when the allele frequencies are . When the frequency of an allele is low, the rare allele occurs predominantly in heterozygotes and there are very few homozygotes. (Adapted from Falconer, 1981.) p = q = 0.5 14 / 24
after the first generation is said to be in equilibrium. This genotypic equilibrium, based on stable gene frequencies and random mating, is known as Hardy- Weinberg principle (or law) Hence, Genetic differences in a randomly breeding population will tend to remain constant unless acted upon by external forces. In other words, the variability does not change from one generation to another in a random mating population. The maximum frequency of the heterozygote (H) cannot exceed 0.5. The Hardy-Weinberg law states that equilibrium is established at any locus after one generation of random mating. 15 / 24
are present – two homozygotes (AA, aa), called “free variability” that can be fixed by selection and the intermediate heterozygous (Aa), called “hidden or potential variability, that can generate new variability through segregation. In outcrossing species, the homozygotes can hybridize to generate more heterozygotic variability. Under random mating and no selection, the rate of crossing and segregation will be balanced to maintain the proportion of free and potential variability of 50%:50%. However, with two loci under consideration, equilibrium will be attained slowly over many generations. If genetic linkage is strong, the rate of attainment of equilibrium will be even much slower. 17 / 24
cultivar with one that has disease resistance. Consider a cross between two populations, susceptible x resistant. If the gene frequencies of an allele in the two populations are represented by and , the gene frequency in the . Assuming the frequency of the resistance gene (Note here that same allele is being considered) in the resistant cultivar is and that in the susceptible elite cultivar is , the gene frequency in the progeny of the cross p would be obtained as follows: Consequently, the gene frequency for the resistant trait is reduced by about 50% (from 0.7 to 0.375). A P 1 P 2 F 1 = = p P1 +P2 2 P 1 = 0.7 P 2 = 0.05 p = = (0.7 + 0.05)/2 = 0.375 P 1 +P 2 2 18 / 24
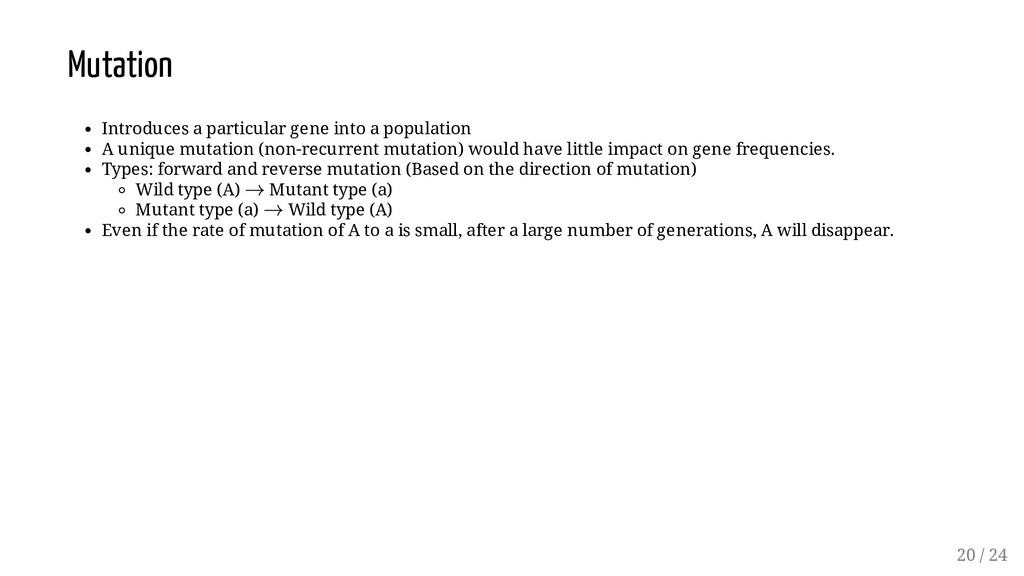
mutation (non-recurrent mutation) would have little impact on gene frequencies. Types: forward and reverse mutation (Based on the direction of mutation) Wild type (A) Mutant type (a) Mutant type (a) Wild type (A) Even if the rate of mutation of A to a is small, after a large number of generations, A will disappear. → → 20 / 24
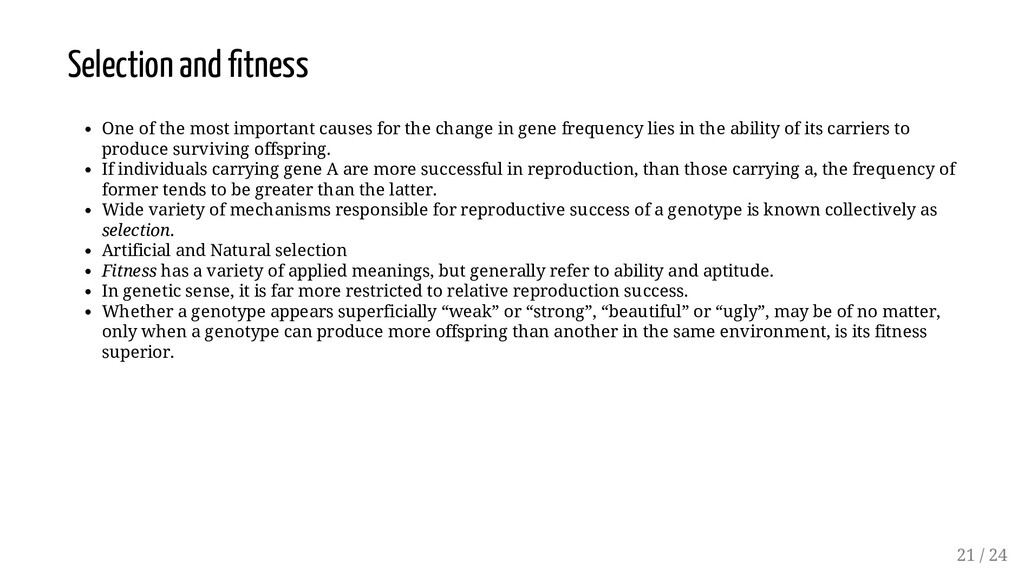
the change in gene frequency lies in the ability of its carriers to produce surviving offspring. If individuals carrying gene A are more successful in reproduction, than those carrying a, the frequency of former tends to be greater than the latter. Wide variety of mechanisms responsible for reproductive success of a genotype is known collectively as selection. Artificial and Natural selection Fitness has a variety of applied meanings, but generally refer to ability and aptitude. In genetic sense, it is far more restricted to relative reproduction success. Whether a genotype appears superficially “weak” or “strong”, “beautiful” or “ugly”, may be of no matter, only when a genotype can produce more offspring than another in the same environment, is its fitness superior. 21 / 24
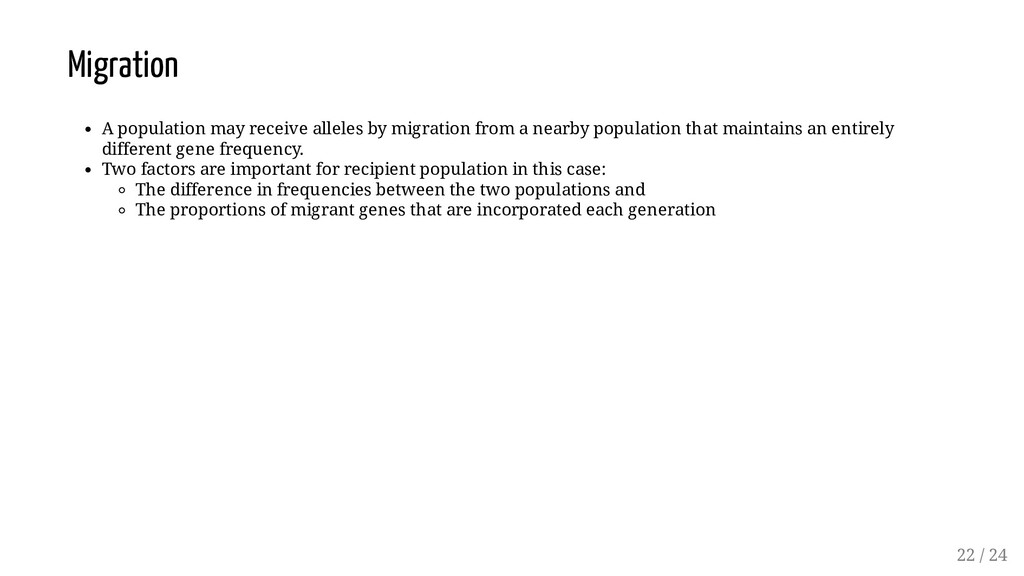
nearby population that maintains an entirely different gene frequency. Two factors are important for recipient population in this case: The difference in frequencies between the two populations and The proportions of migrant genes that are incorporated each generation 22 / 24
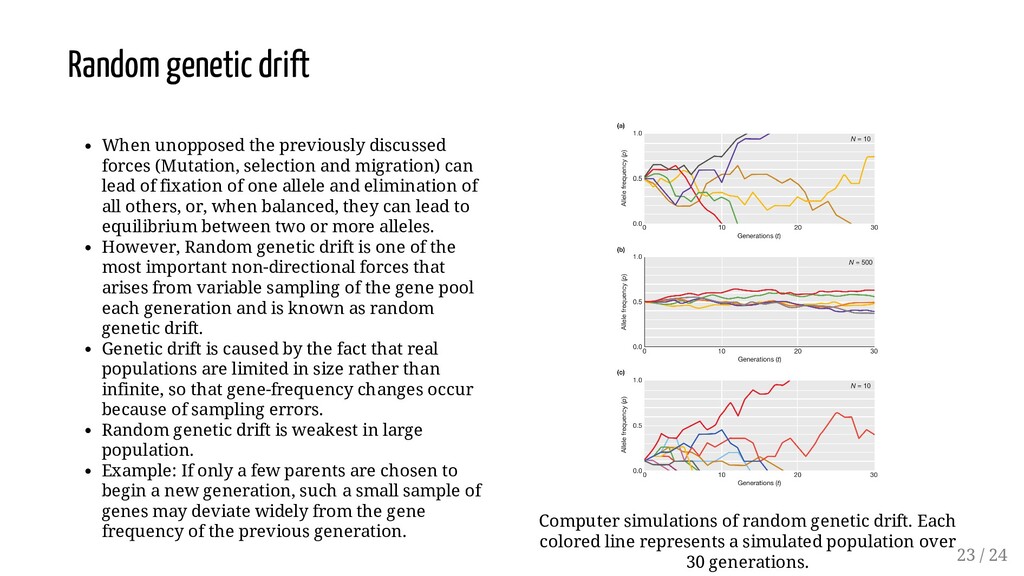
can lead of fixation of one allele and elimination of all others, or, when balanced, they can lead to equilibrium between two or more alleles. However, Random genetic drift is one of the most important non-directional forces that arises from variable sampling of the gene pool each generation and is known as random genetic drift. Genetic drift is caused by the fact that real populations are limited in size rather than infinite, so that gene-frequency changes occur because of sampling errors. Random genetic drift is weakest in large population. Example: If only a few parents are chosen to begin a new generation, such a small sample of genes may deviate widely from the gene frequency of the previous generation. Computer simulations of random genetic drift. Each colored line represents a simulated population over 30 generations. Random genetic drift 23 / 24
to themselves. Two types of assortative mating systems: Positive assortative mating and negative assortative mating. For example, if tall individuals preferentially mate with other tall individuals and short individuals mate with other short individuals. We expect an excess of homozygotes for the "tall" alleles among the progeny of tall mating pairs and excess of homozygotes for short alleles among the progeny of short mating pairs. Negative assortative mating is common in plant kingdom. It is exemplified by the self-incompatibility, or S, locus in Brassica crops. The stigma of a plant will not be receptive to pollen that carries either of its own alleles. For example, the stigma of an S1/S2 heterozygote will not allow pollen grains carrying either an S1 or S2 allele to germinate and fertilize its ovules, although pollen grain carrying S3 and S4 can do so. 24 / 24