You’ll be tempted to ● Street Light ○ Google it ○ Try and Fail ● Random Change ○ Change a random parameter ● Blame ○ Life ○ God ○ A Dependency ANTI-METHODOLOGIES
USE methodology for every Resource all physical server functional components 
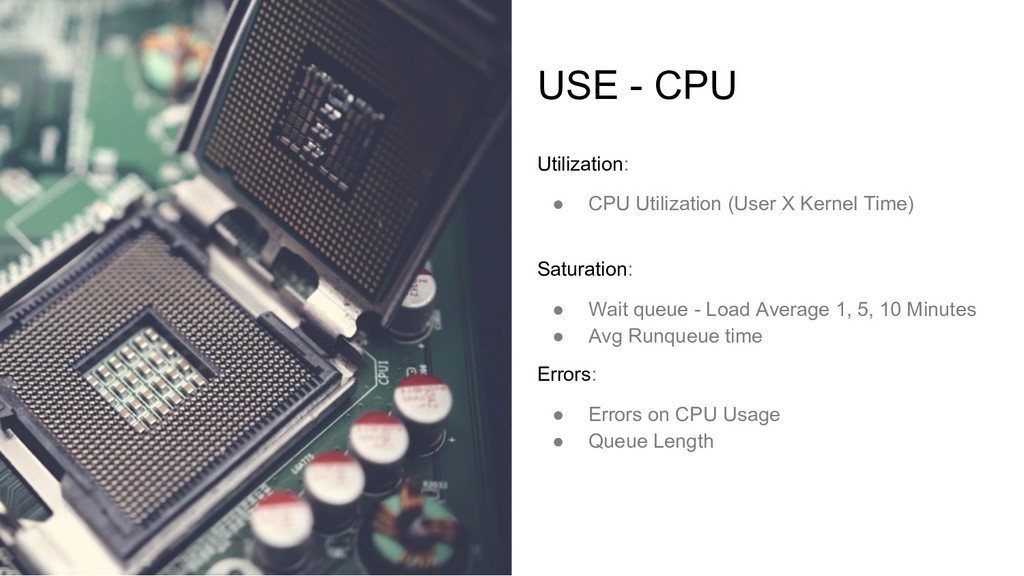
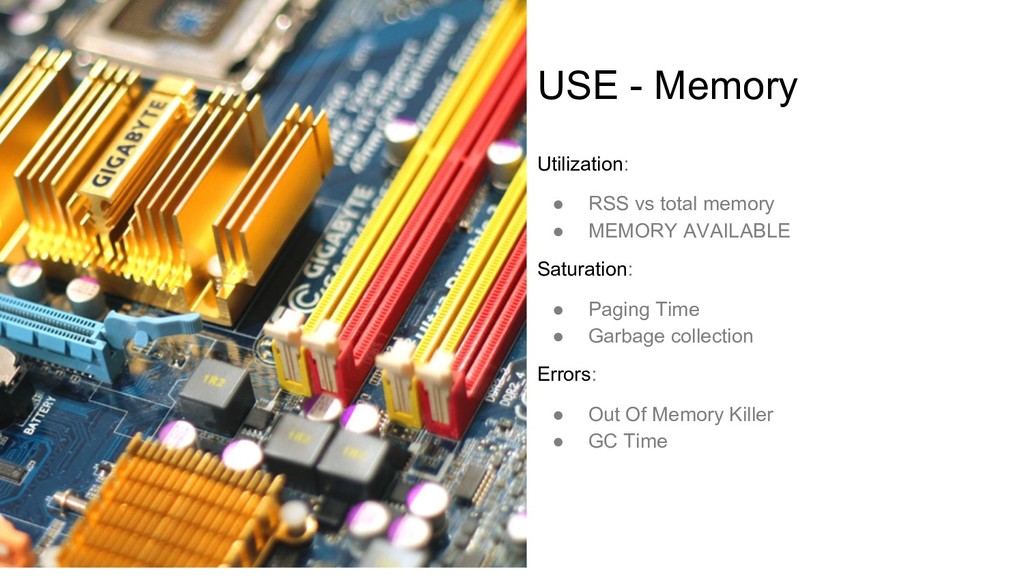
Utilization the average time that the resource was busy servicing work Saturation the degree to which the resource has extra work which it can't service, often queued Errors
USE - CPU Utilization: ● CPU Utilization (User X Kernel Time) Saturation: ● Wait queue - Load Average 1, 5, 10 Minutes ● Avg Runqueue time Errors: ● Errors on CPU Usage ● Queue Length
USE - Memory Utilization: ● RSS vs total memory ● MEMORY AVAILABLE Saturation: ● Paging Time ● Garbage collection Errors: ● Out Of Memory Killer ● GC Time
Tools $ iostat -xz 1 # io stats $ free -
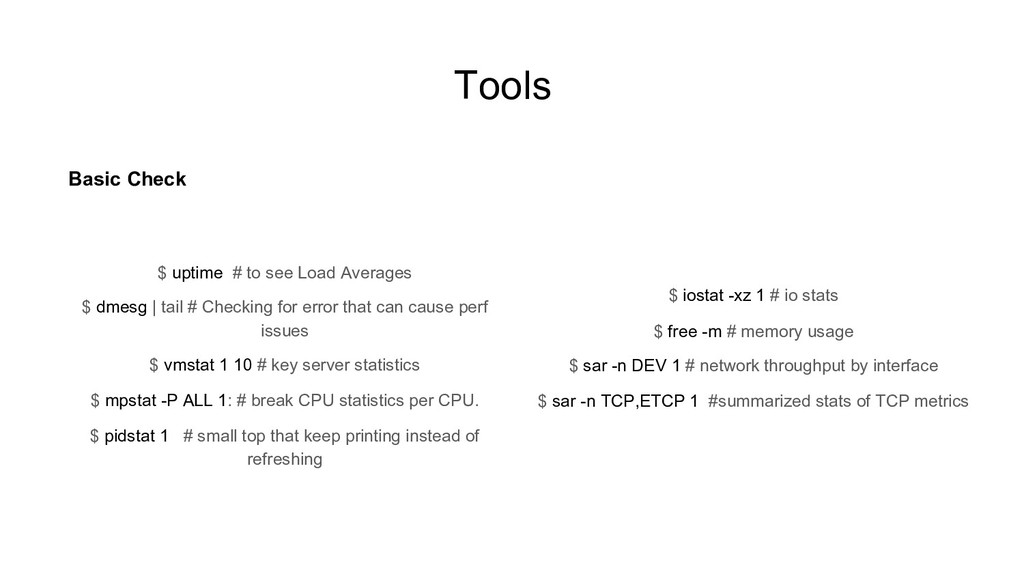
m # memory usage $ sar -n DEV 1 # network throughput by interface $ sar -n TCP,ETCP 1 #summarized stats of TCP metrics Basic Check $ uptime # to see Load Averages $ dmesg | tail # Checking for error that can cause perf issues $ vmstat 1 10 # key server statistics $ mpstat -P ALL 1: # break CPU statistics per CPU. $ pidstat 1 # small top that keep printing instead of refreshing
Tools SYSSTAT ● Collects and archive statistics ● I/O, CPU, Memory, VMemory, Processes, Network, etc ● Stored daily at /var/log/sysstat/saXX ● Available on almost every Linux distro
Thank you USE http://www.brendangregg.com/usemethod.html http://www.brendangregg.com/USEmethod/use-rosetta.html R Method http://carymillsap.blogspot.com/2009/11/why-we-made- method-r.html