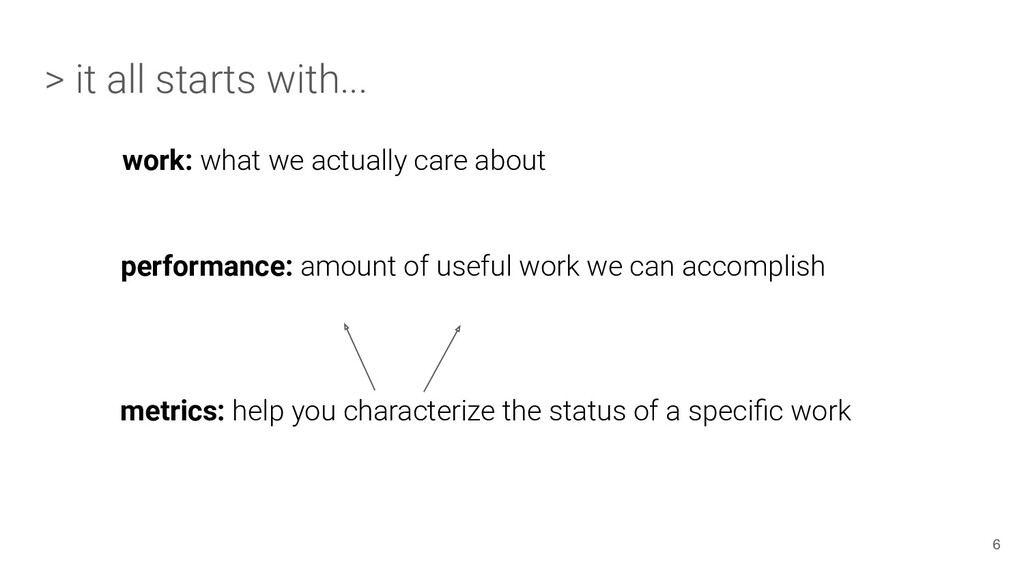
performance: Understanding application behaviour ( responsiveness ) metrics: Operations per unit of time, success metrics, error metrics, utilization, saturation, latency, and many more... 7
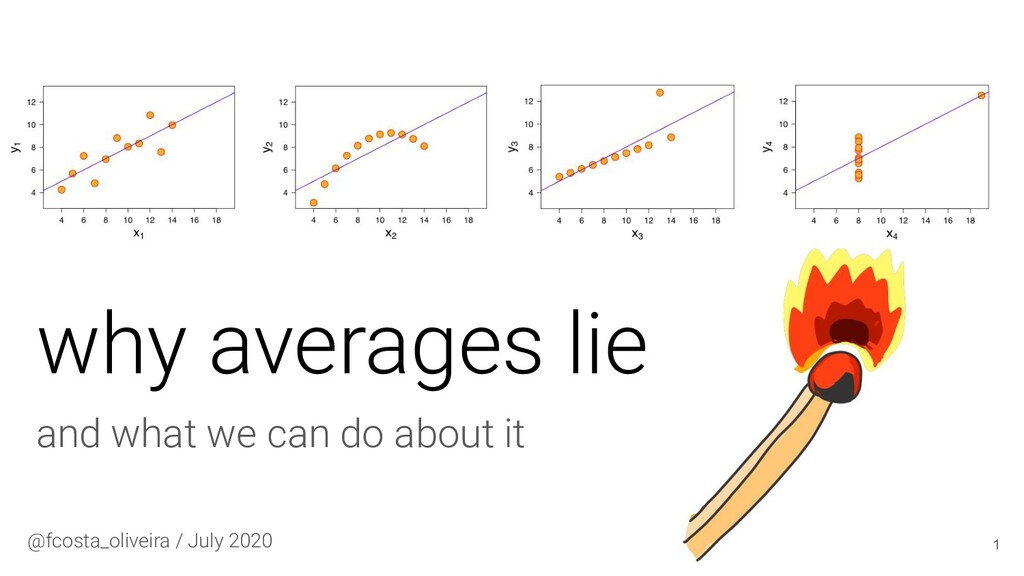
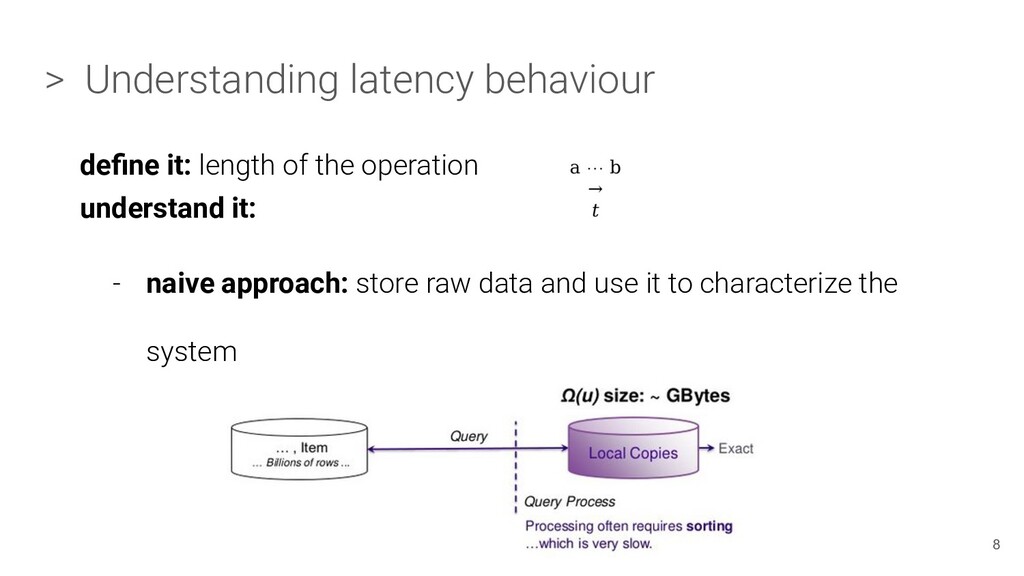
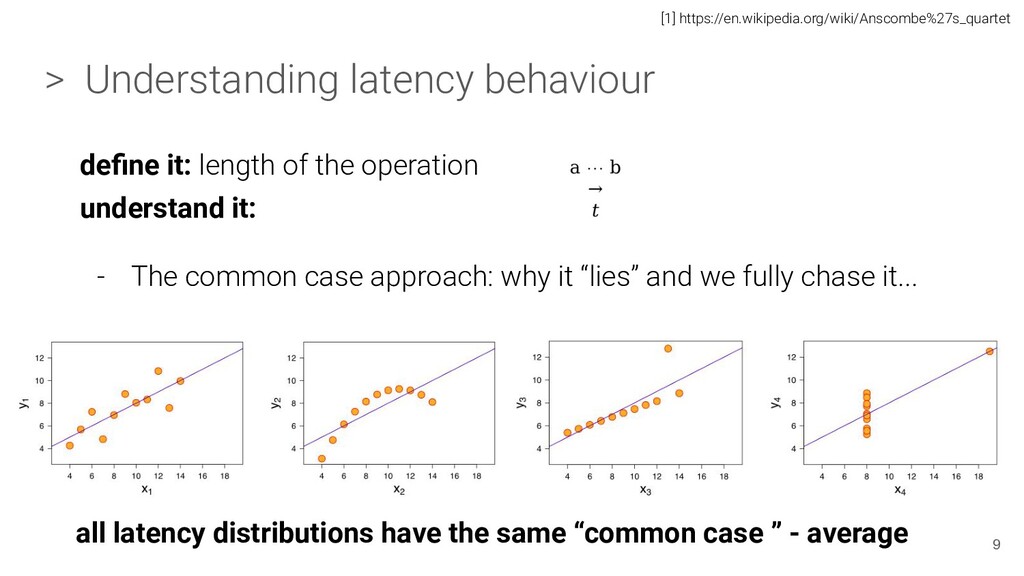
average > Understanding latency behaviour define it: length of the operation understand it: - The common case approach: why it “lies” and we fully chase it... the mean 9 [1] https://en.wikipedia.org/wiki/Anscombe%27s_quartet
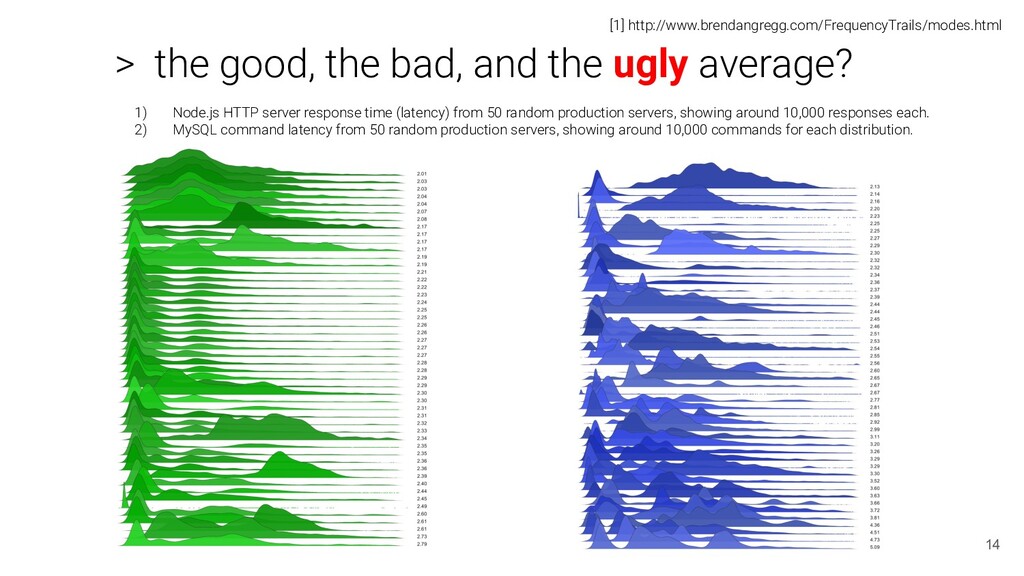
[1] http://www.brendangregg.com/FrequencyTrails/modes.html 1) Node.js HTTP server response time (latency) from 50 random production servers, showing around 10,000 responses each. 2) MySQL command latency from 50 random production servers, showing around 10,000 commands for each distribution.
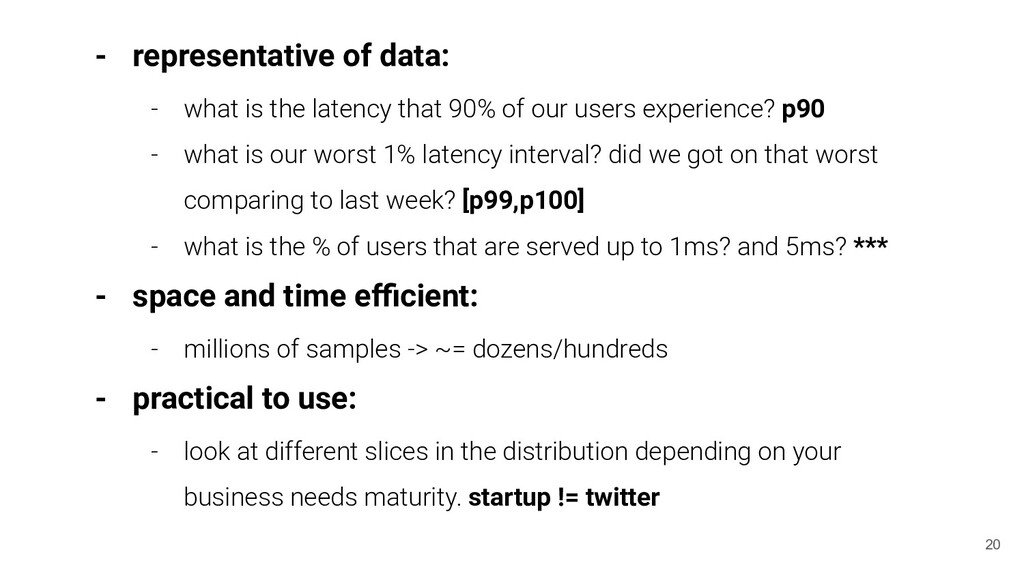
90% of our users experience? p90 - what is our worst 1% latency interval? did we got on that worst comparing to last week? [p99,p100] - what is the % of users that are served up to 1ms? and 5ms? *** - space and time efficient: - millions of samples -> ~= dozens/hundreds - practical to use: - look at different slices in the distribution depending on your business needs maturity. startup != twitter 20
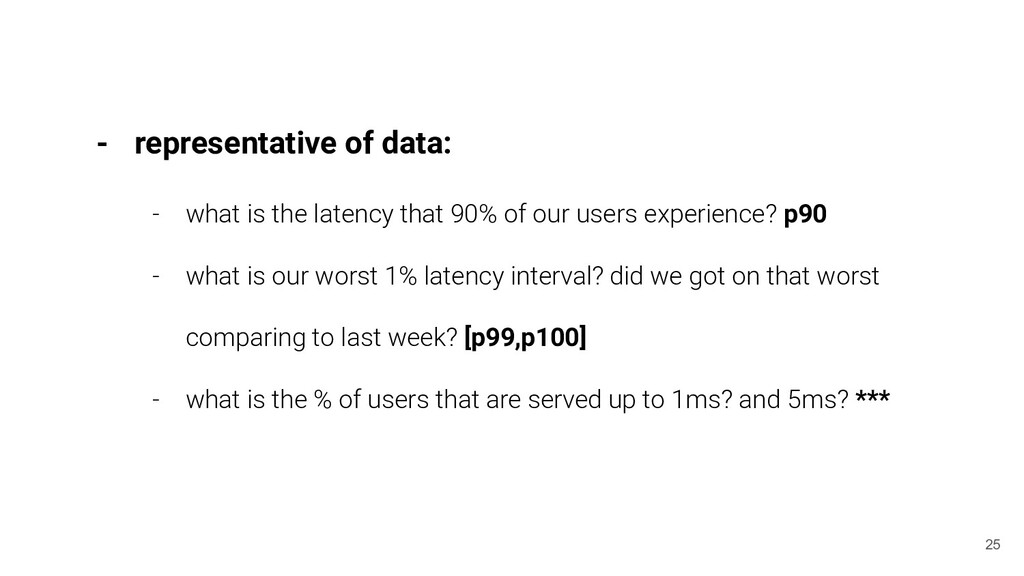
90% of our users experience? p90 - what is our worst 1% latency interval? did we got on that worst comparing to last week? [p99,p100] - what is the % of users that are served up to 1ms? and 5ms? *** 25
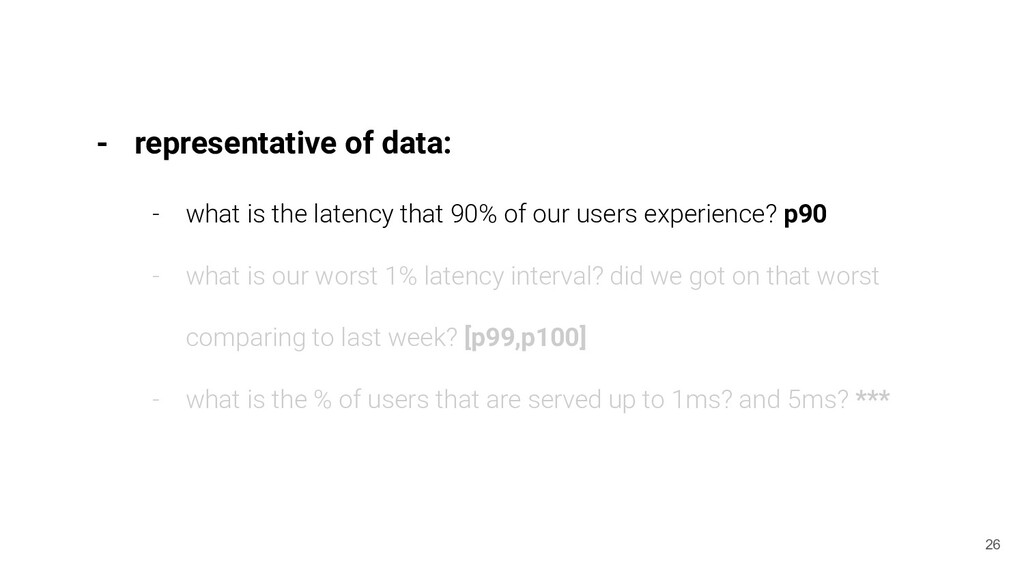
90% of our users experience? p90 - what is our worst 1% latency interval? did we got on that worst comparing to last week? [p99,p100] - what is the % of users that are served up to 1ms? and 5ms? *** 26
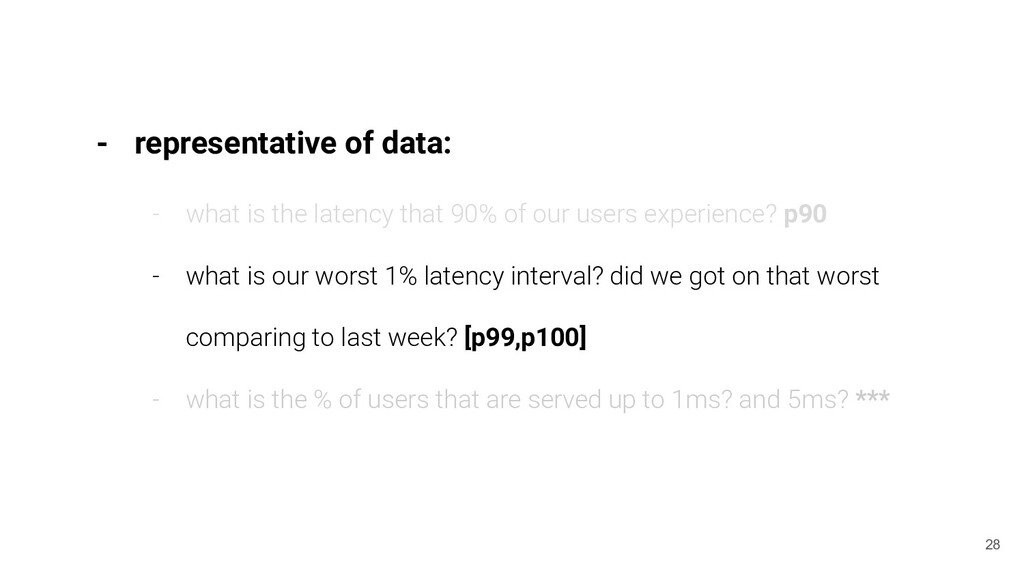
90% of our users experience? p90 - what is our worst 1% latency interval? did we got on that worst comparing to last week? [p99,p100] - what is the % of users that are served up to 1ms? and 5ms? *** 28
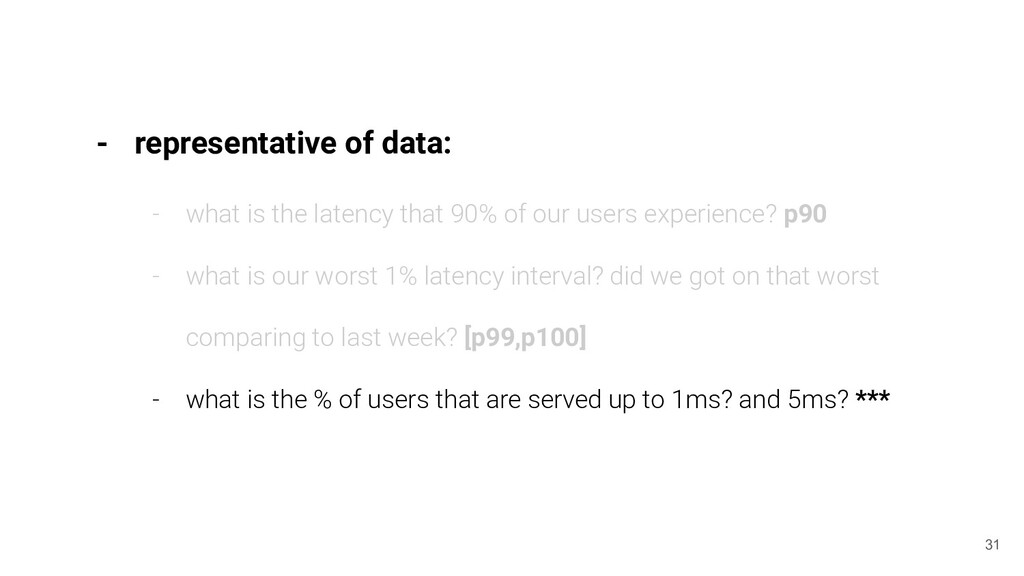
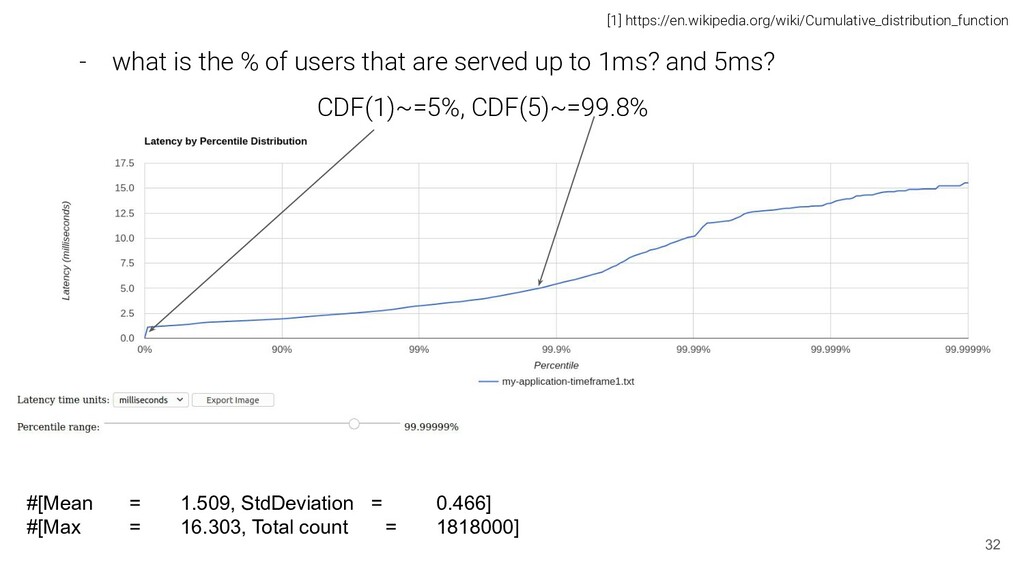
90% of our users experience? p90 - what is our worst 1% latency interval? did we got on that worst comparing to last week? [p99,p100] - what is the % of users that are served up to 1ms? and 5ms? *** 31
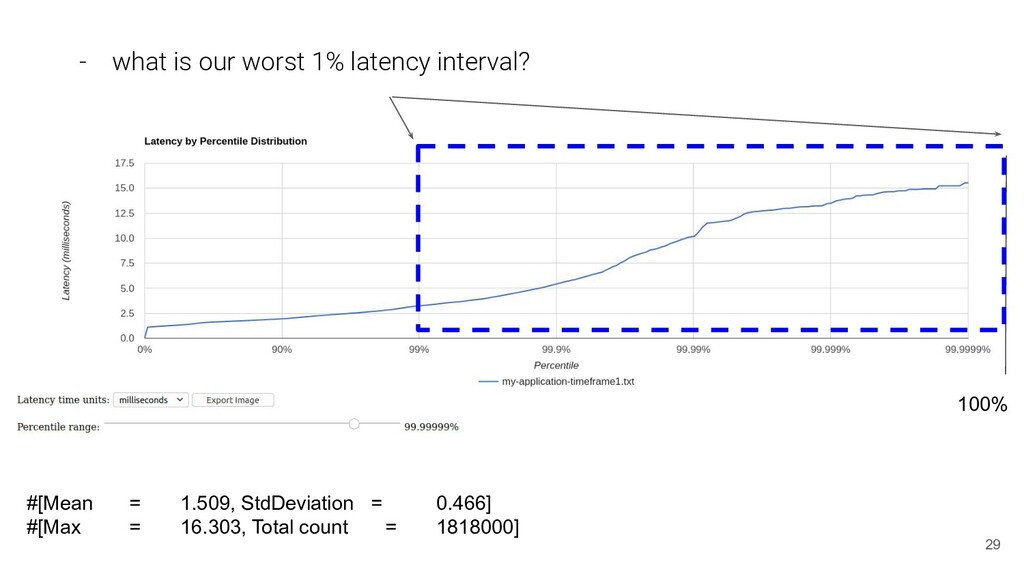
served up to 1ms? and 5ms? CDF(1)~=5%, CDF(5)~=99.8% [1] https://en.wikipedia.org/wiki/Cumulative_distribution_function #[Mean = 1.509, StdDeviation = 0.466] #[Max = 16.303, Total count = 1818000]
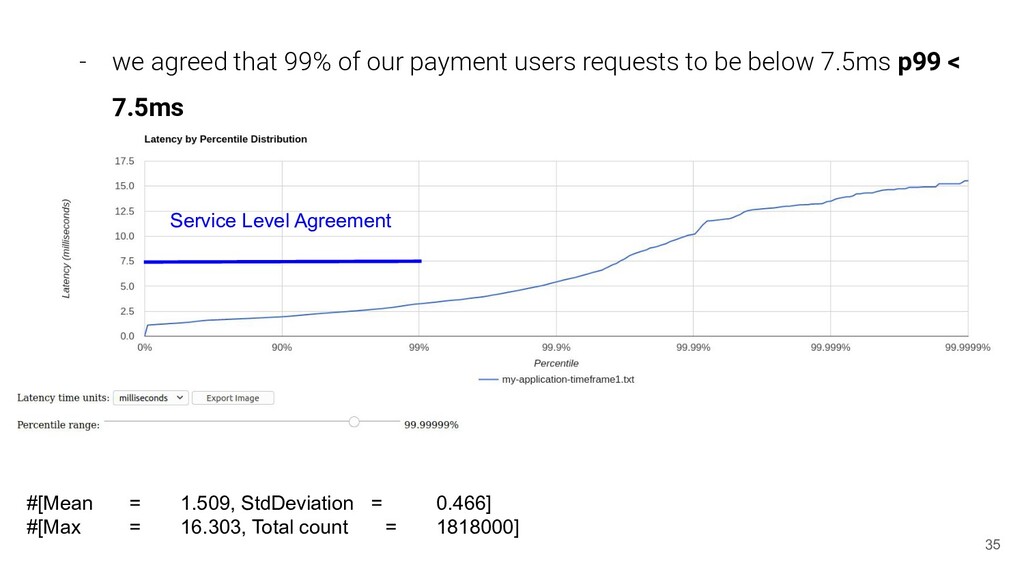
means ): - we agreed that 99% of our payment users requests to be below 7.5ms p99 < 7.5ms - we agreed that 99.999% of our payment users requests to be below 10ms p99.999 < 10ms #[Mean = 1.509, StdDeviation = 0.466] #[Max = 16.303, Total count = 1818000] On normal distributions 99.999% of values are within 4.5 standard deviations of the mean: 1.509 + 4*0.466 ~= 3,373 ms, so we chime In! DEAL! [1] image credit to Kyle Kingsbury
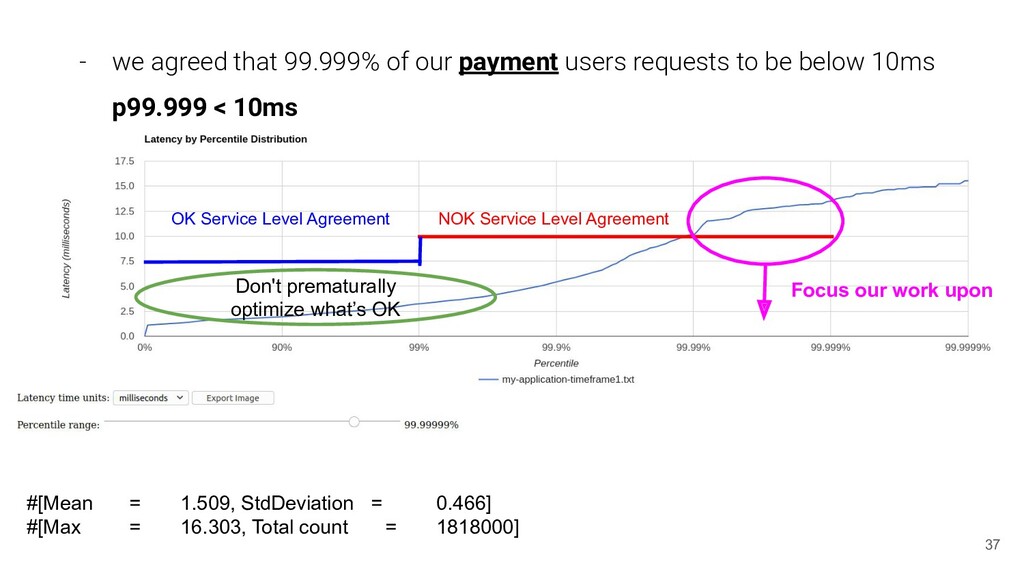
requests to be below 10ms p99.999 < 10ms #[Mean = 1.509, StdDeviation = 0.466] #[Max = 16.303, Total count = 1818000] OK Service Level Agreement NOK Service Level Agreement
requests to be below 10ms p99.999 < 10ms #[Mean = 1.509, StdDeviation = 0.466] #[Max = 16.303, Total count = 1818000] OK Service Level Agreement NOK Service Level Agreement Focus our work upon Don't prematurally optimize what’s OK
is the chance of experiencing P99? If it was 1 request: - (1 - 0.99) * 100 = 1% Amazon.com example: - 190 requests - 0.99^190 ~= 0.148 - (1 - 0.148) * 100 ~= 85.2% To get the probability of getting at least one success you use opposite event formula. - The probability of being bellow P99 is 99% on each attempt. ( success 1% ) - The probability of failure on each attempt is (1-99%). - The probability of n failures in a row is (1-)n and so the probability of at least one success is 1 – (1-0.01)n
behaviour and distribution... > no free lunch... > we need to give it context... metrics: Operations per unit of time, success metrics, error metrics, utilization, saturation, latency, and many more...
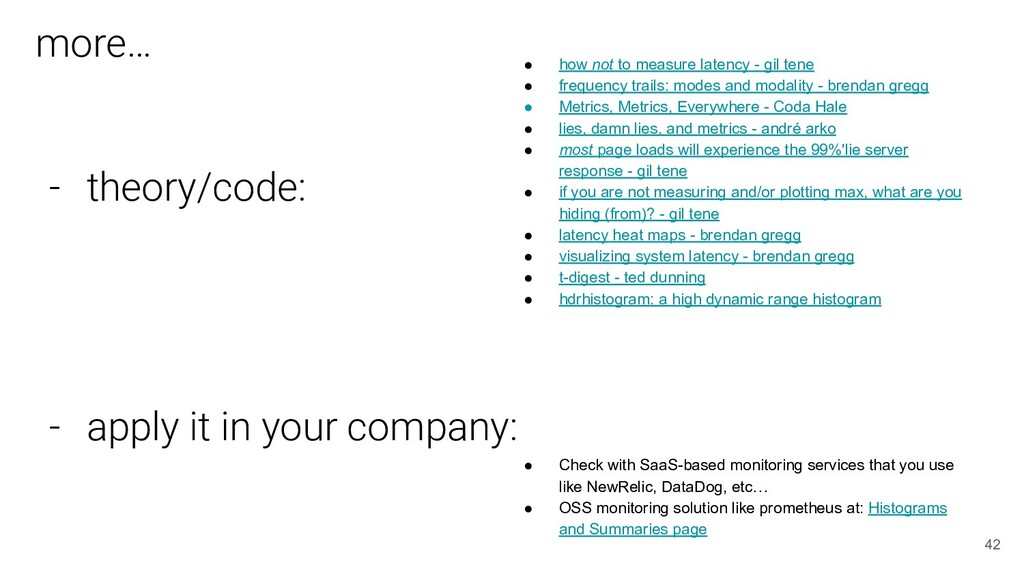
• how not to measure latency - gil tene • frequency trails: modes and modality - brendan gregg • Metrics, Metrics, Everywhere - Coda Hale • lies, damn lies, and metrics - andré arko • most page loads will experience the 99%'lie server response - gil tene • if you are not measuring and/or plotting max, what are you hiding (from)? - gil tene • latency heat maps - brendan gregg • visualizing system latency - brendan gregg • t-digest - ted dunning • hdrhistogram: a high dynamic range histogram • Check with SaaS-based monitoring services that you use like NewRelic, DataDog, etc… • OSS monitoring solution like prometheus at: Histograms and Summaries page
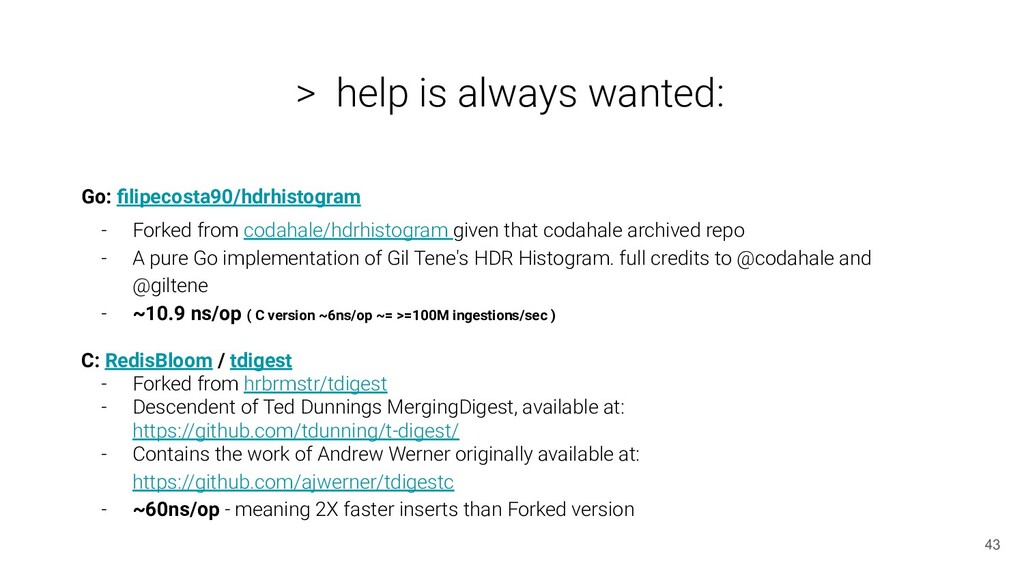
from codahale/hdrhistogram given that codahale archived repo - A pure Go implementation of Gil Tene's HDR Histogram. full credits to @codahale and @giltene - ~10.9 ns/op ( C version ~6ns/op ~= >=100M ingestions/sec ) C: RedisBloom / tdigest - Forked from hrbrmstr/tdigest - Descendent of Ted Dunnings MergingDigest, available at: https://github.com/tdunning/t-digest/ - Contains the work of Andrew Werner originally available at: https://github.com/ajwerner/tdigestc - ~60ns/op - meaning 2X faster inserts than Forked version
![19 > percentiles to the rescue… [1] https://en.wikipedia.org/wiki/Percentile value below](https://files.speakerdeck.com/presentations/28b13b10a0c64699a4c25137c17aac30/slide_18.jpg)
![24 [1] https://hdrhistogram.github.io/HdrHistogram/plotFiles.html](https://files.speakerdeck.com/presentations/28b13b10a0c64699a4c25137c17aac30/slide_23.jpg)
![39 [1] Gil Tene: https://bravenewgeek.com/everything-you-know-about-la tency-is-wrong/ [2] https://en.wikipedia.org/wiki/Bernoulli_trial > what](https://files.speakerdeck.com/presentations/28b13b10a0c64699a4c25137c17aac30/slide_38.jpg)