Upgrade to Pro — share decks privately, control downloads, hide ads and more …

Анатолий Кулаков «The Metrix has you...»

DotNetRu
November 23, 2017

Анатолий Кулаков «The Metrix has you...»

Для многих разработчиков процесс релиза их продукта похож на выбрасывание слепого котёнка в пасти диких псов. После этого главная задача авторов — отбиваться от случайно долетевших до них багов. На самом деле, приложение не заканчивает свой жизненный путь в зубах пользователей, а только начинает его. И ему нужна помощь разработчиков не меньше, чем во время становления и тестирования.

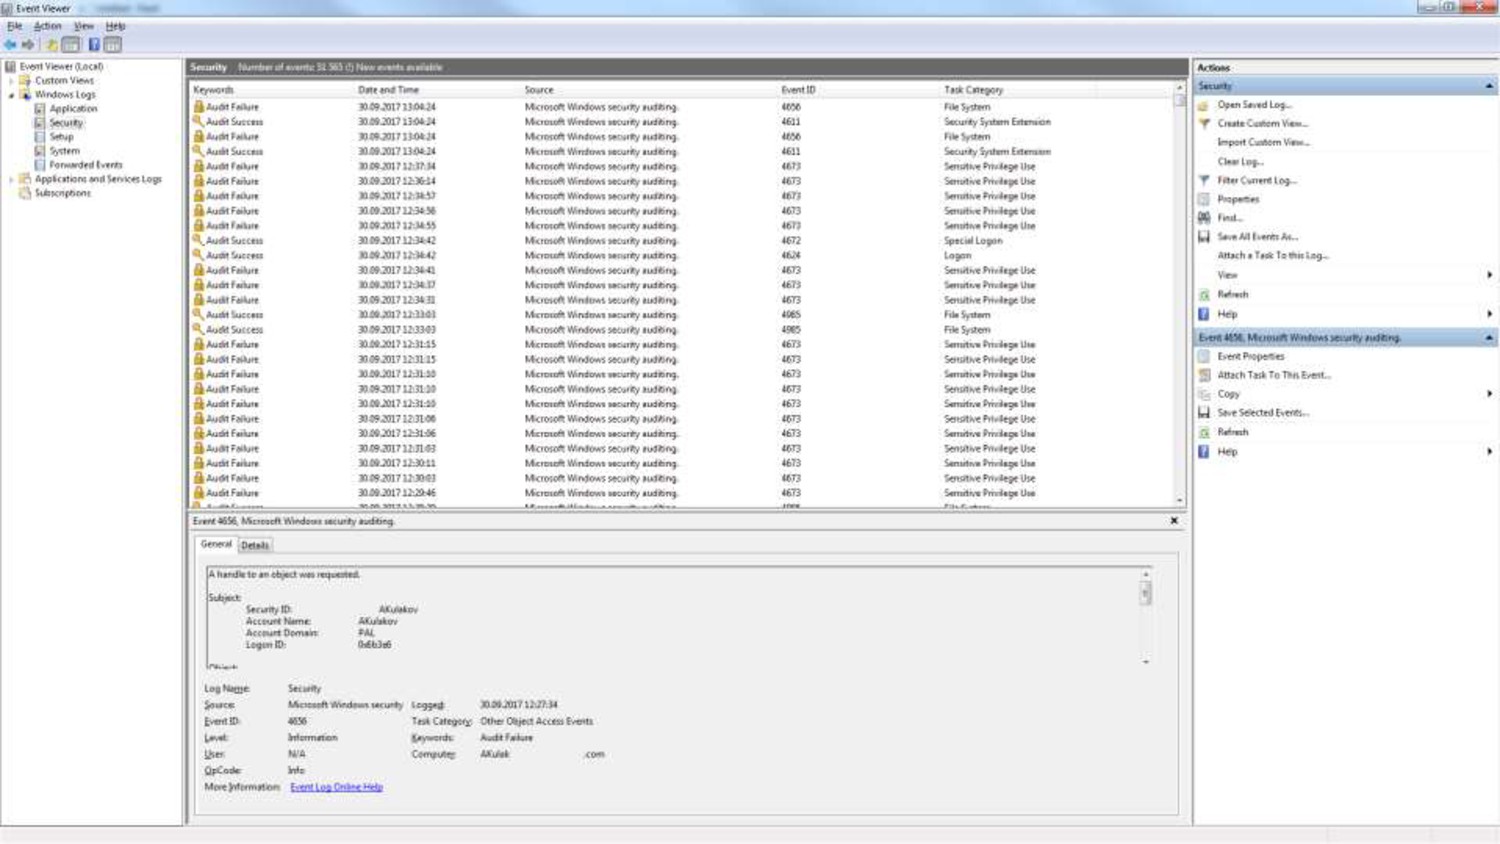
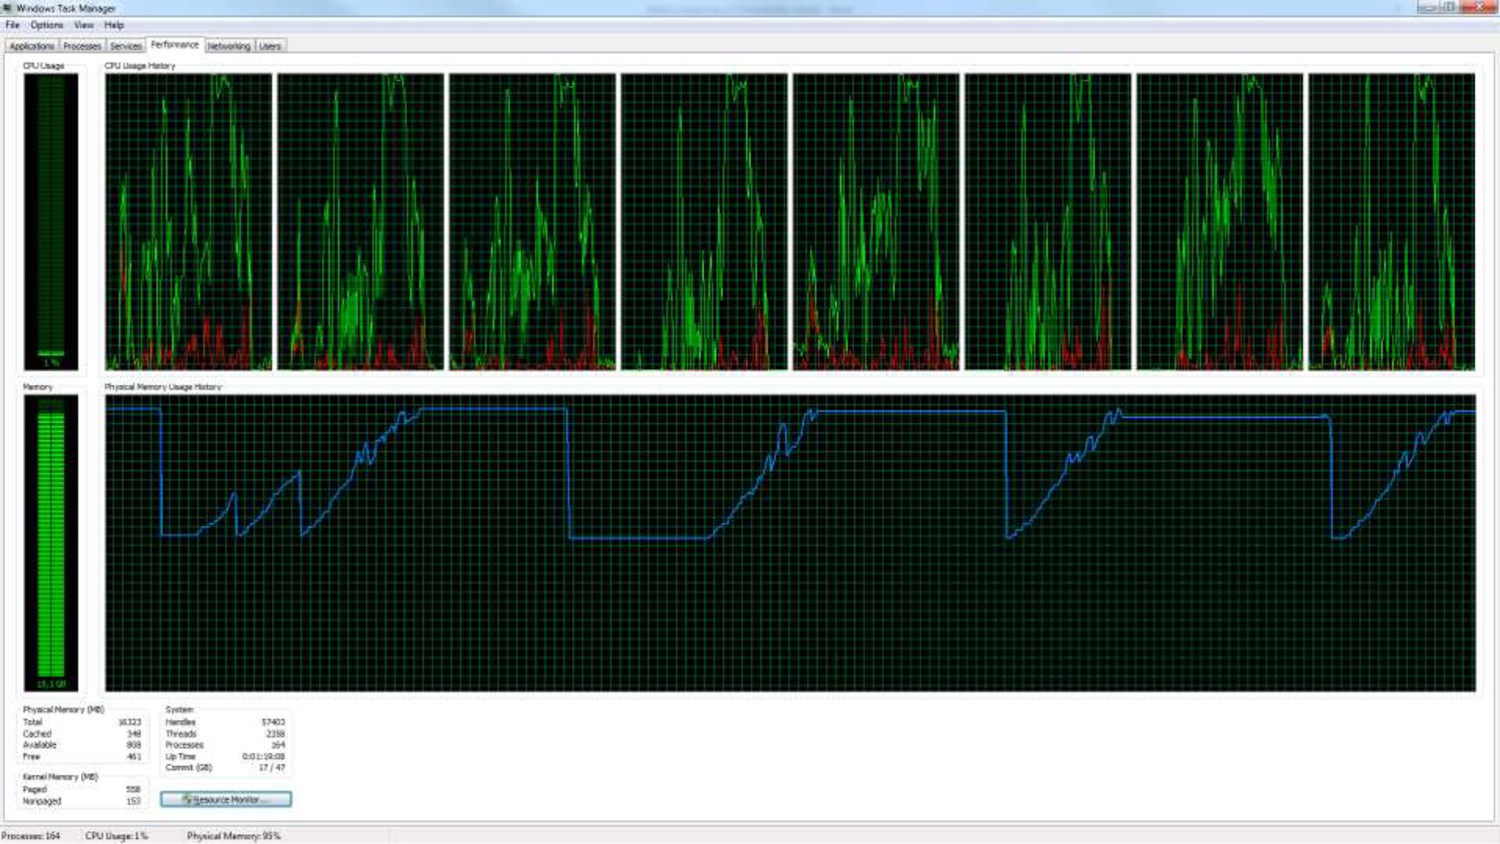
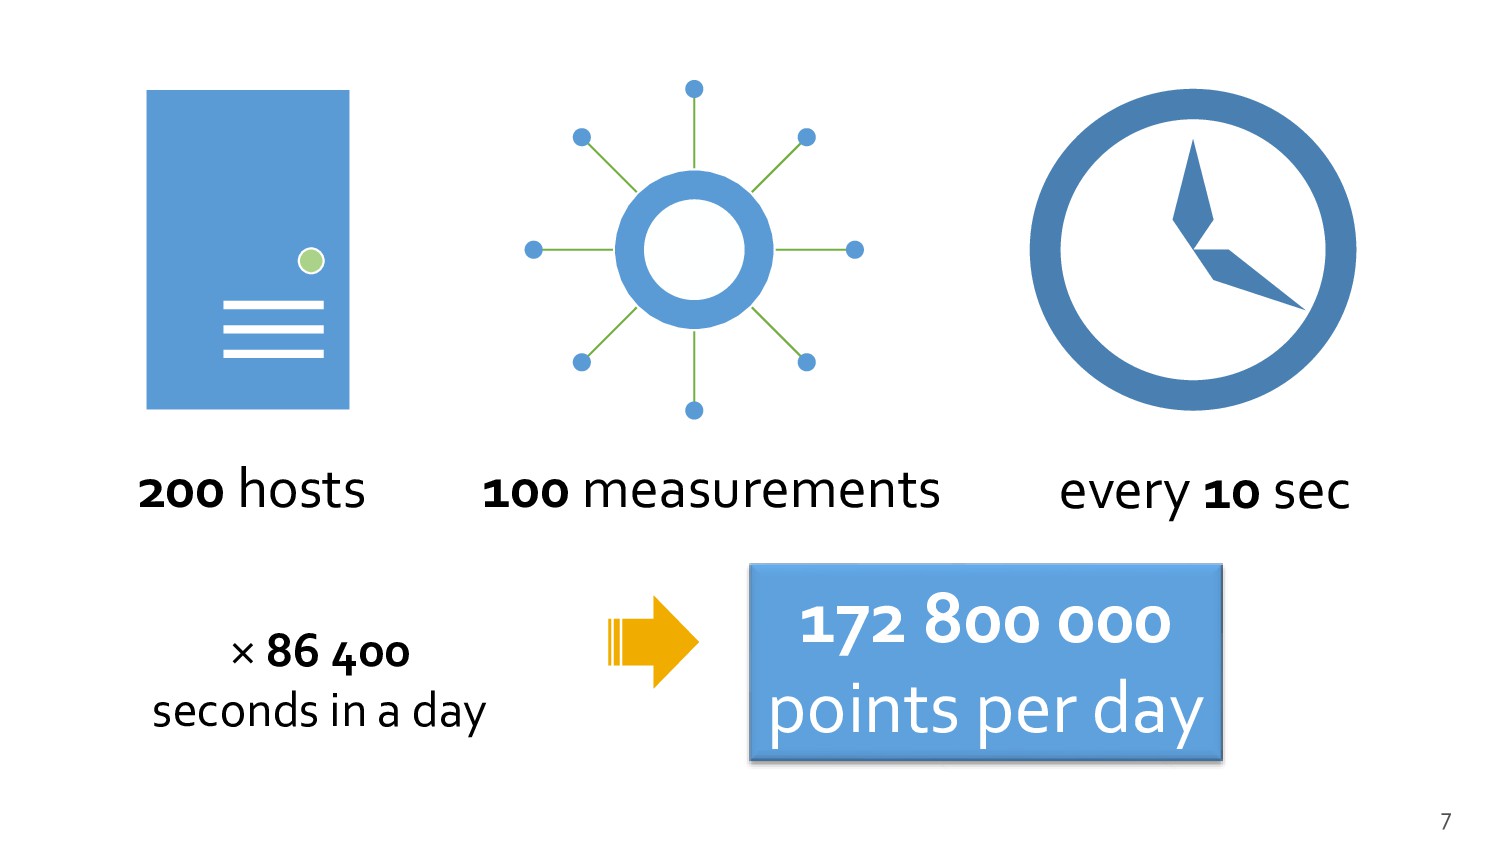
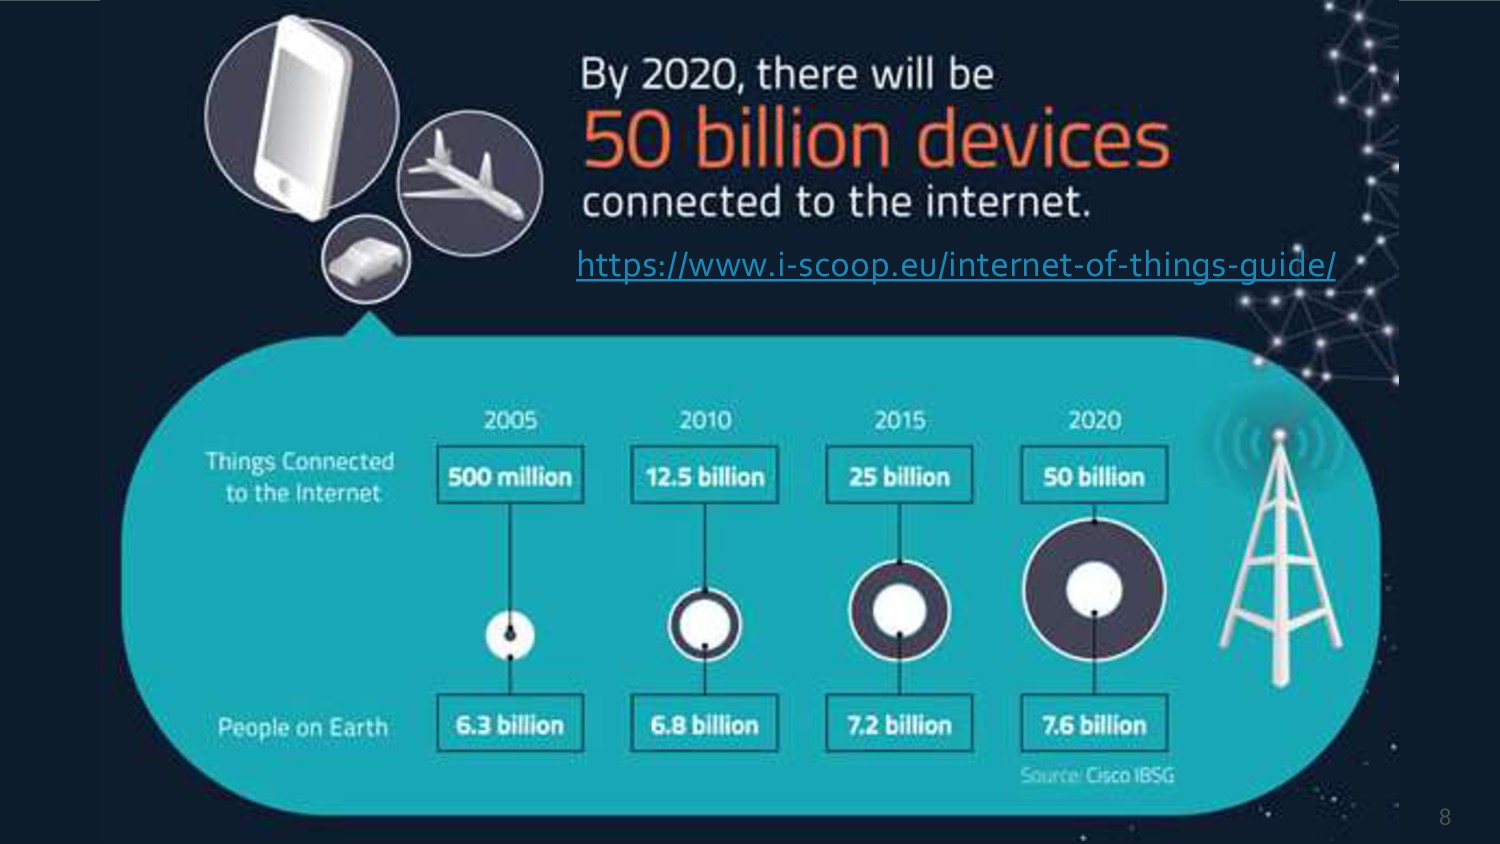
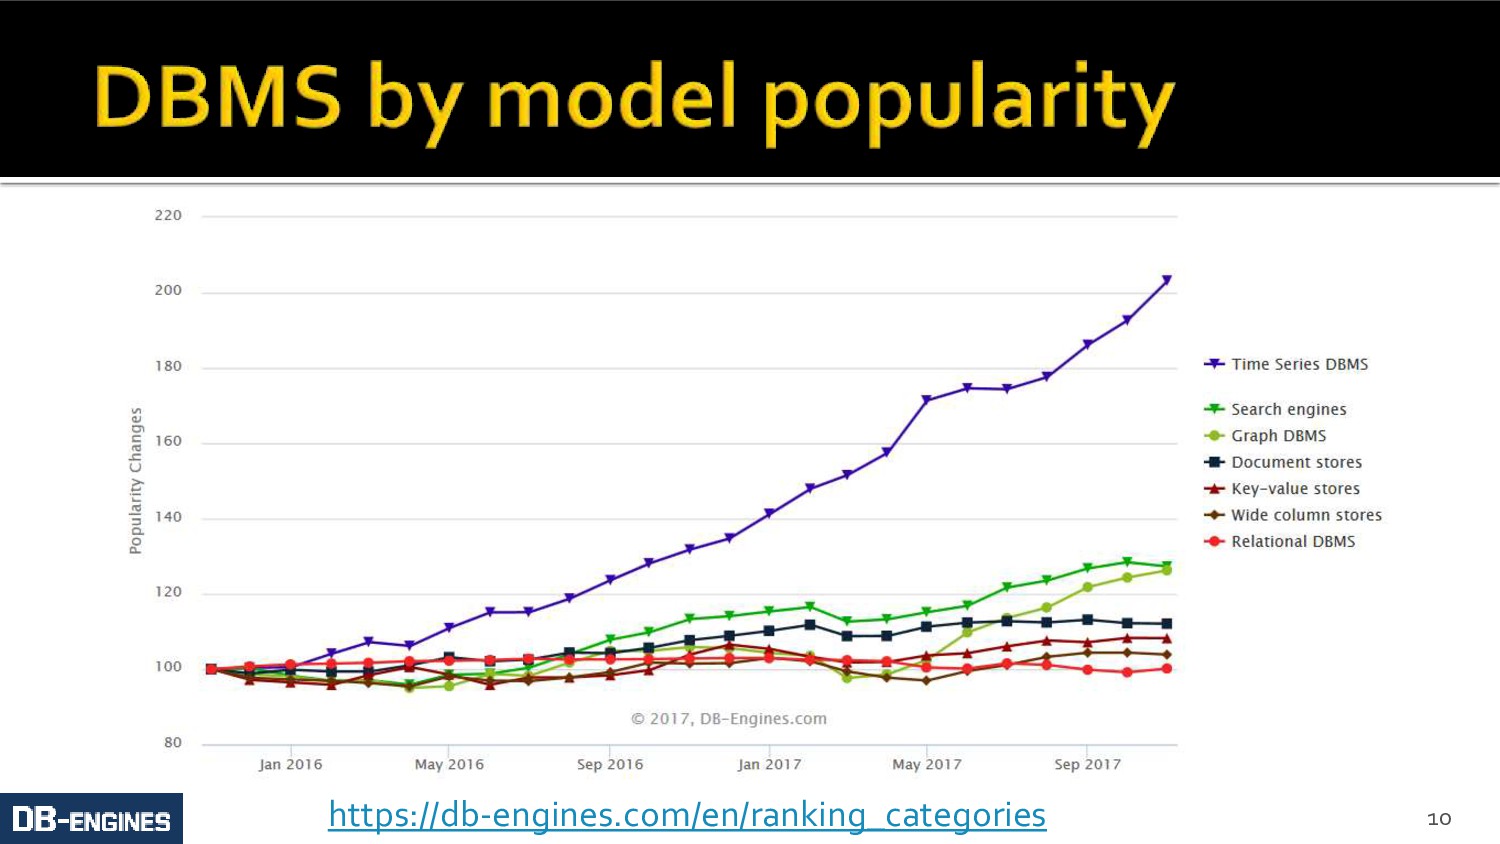
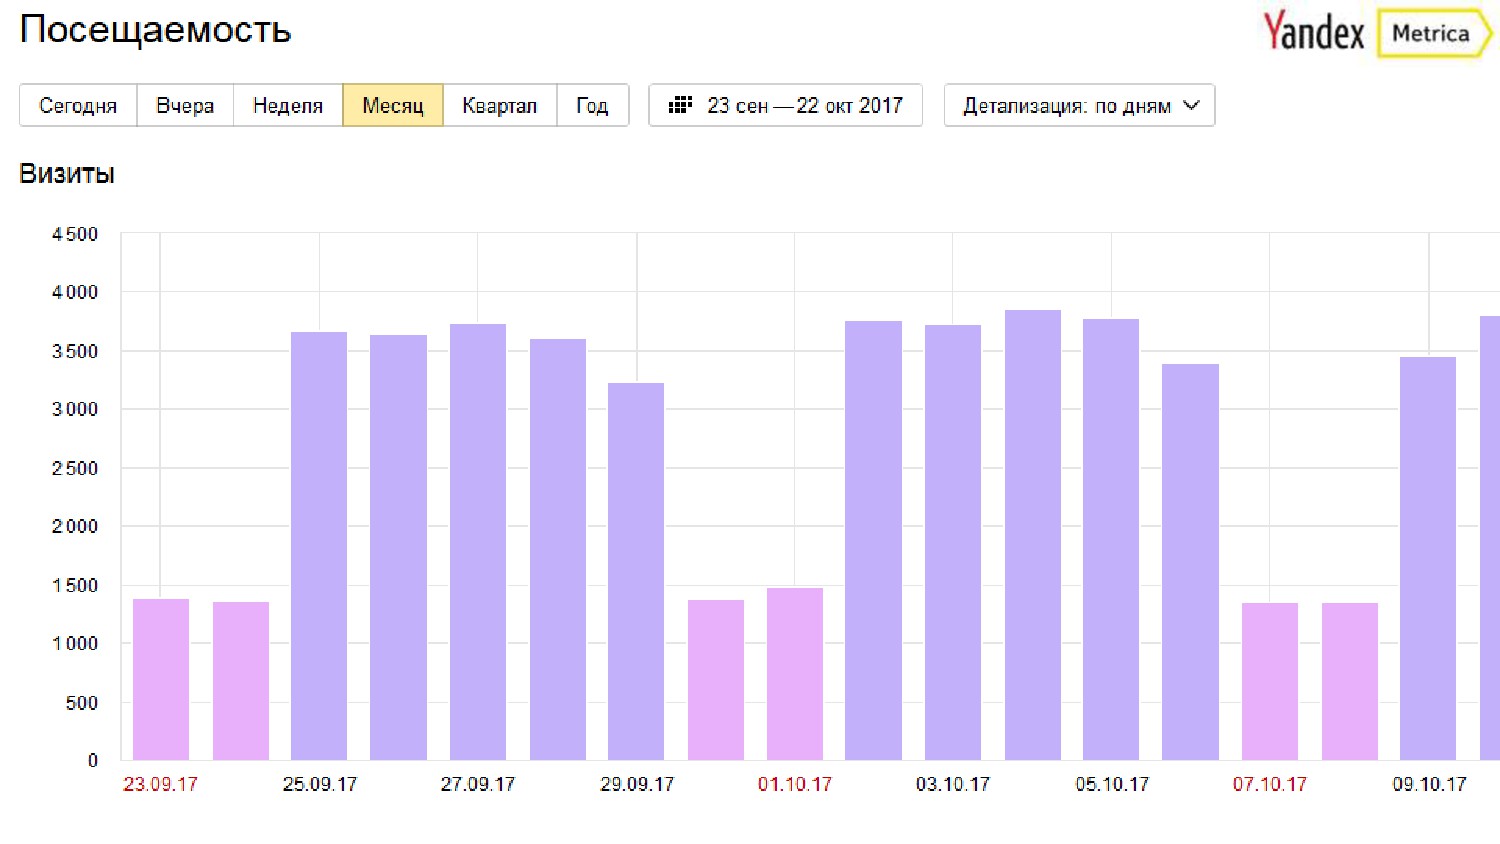
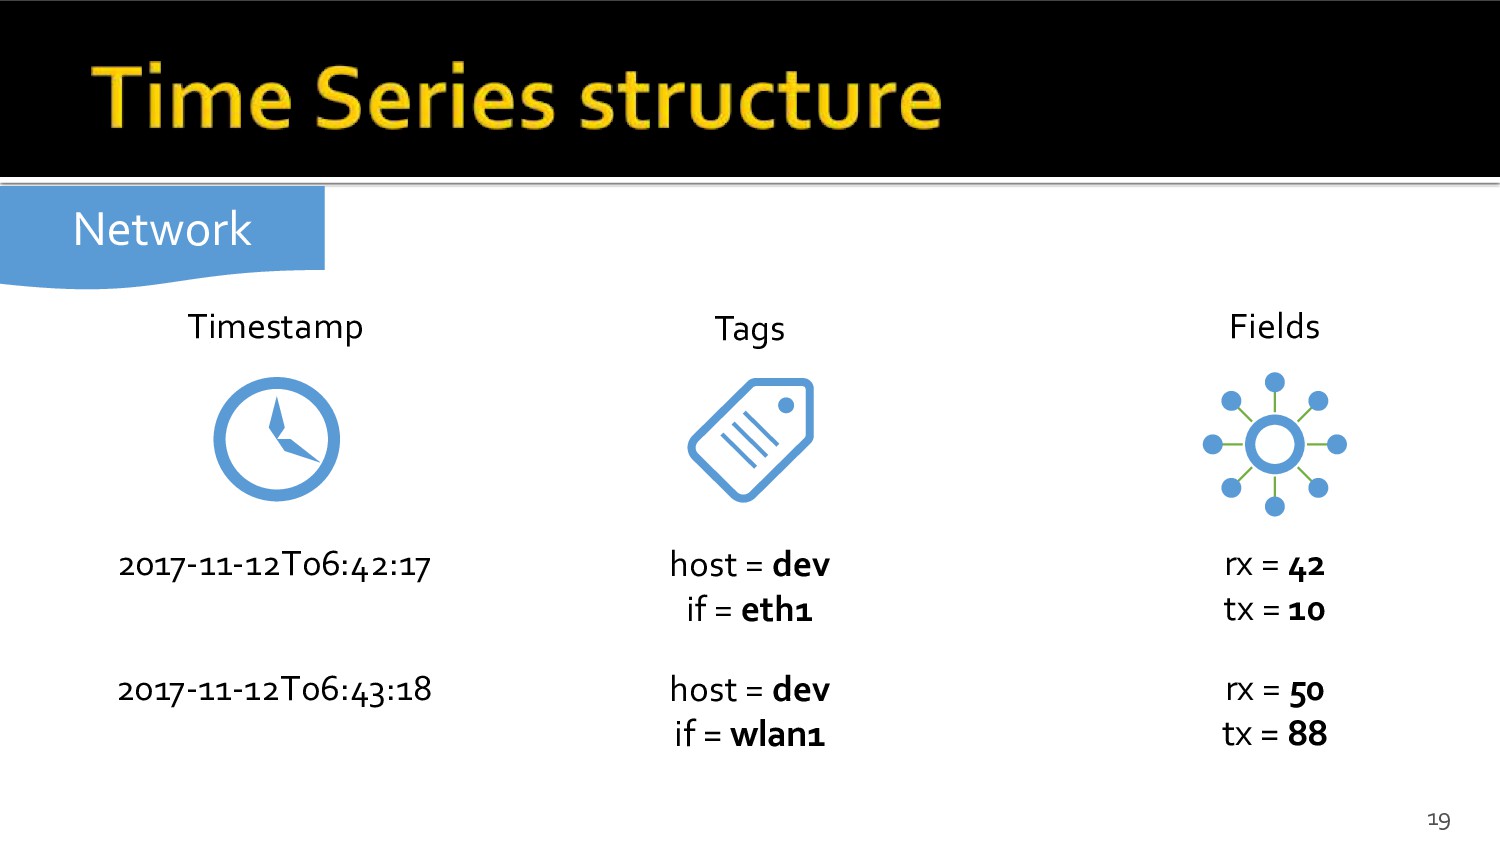
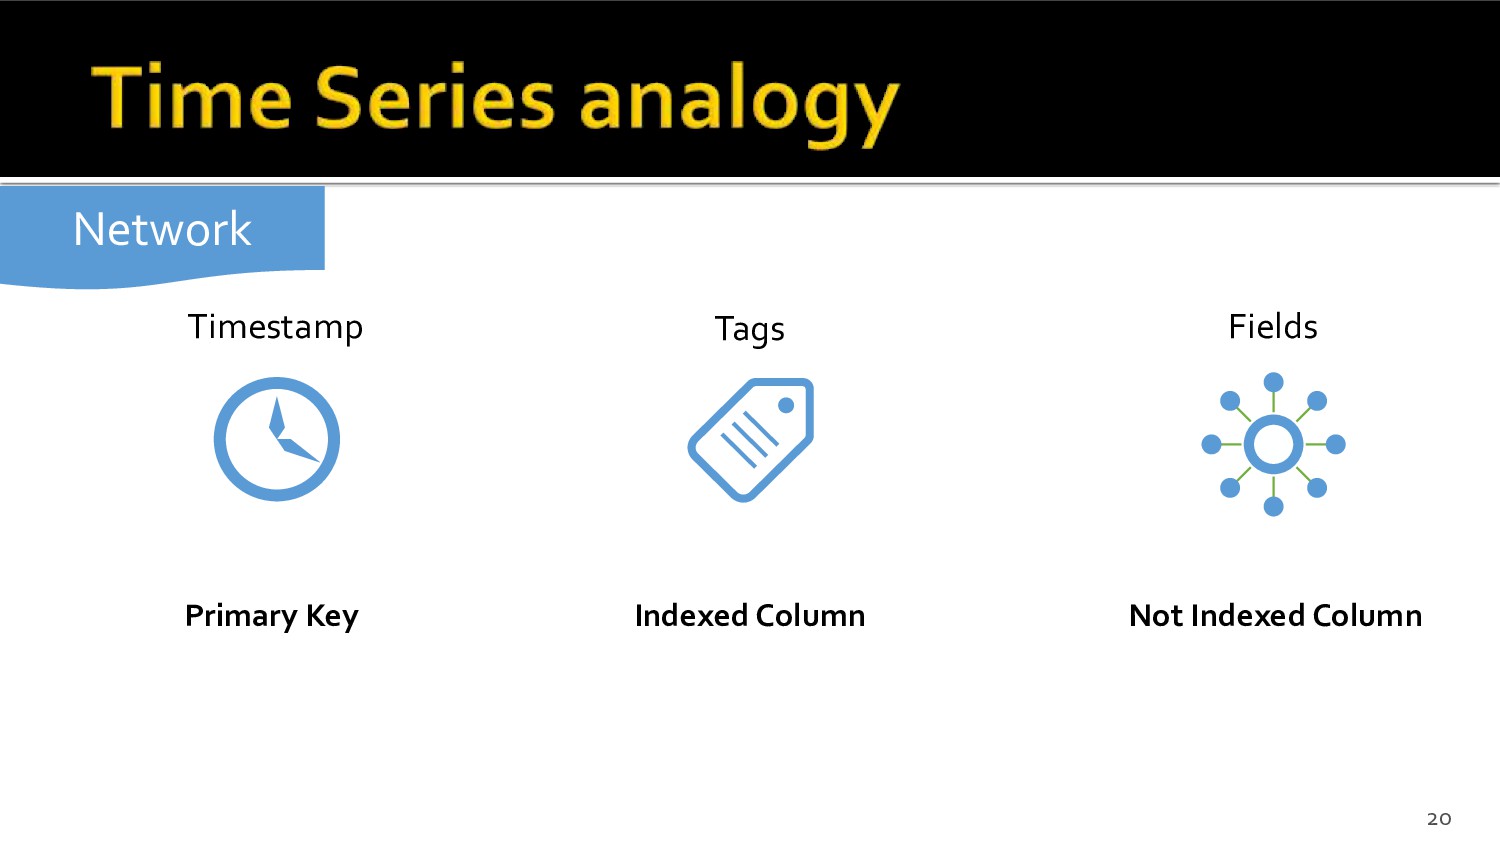
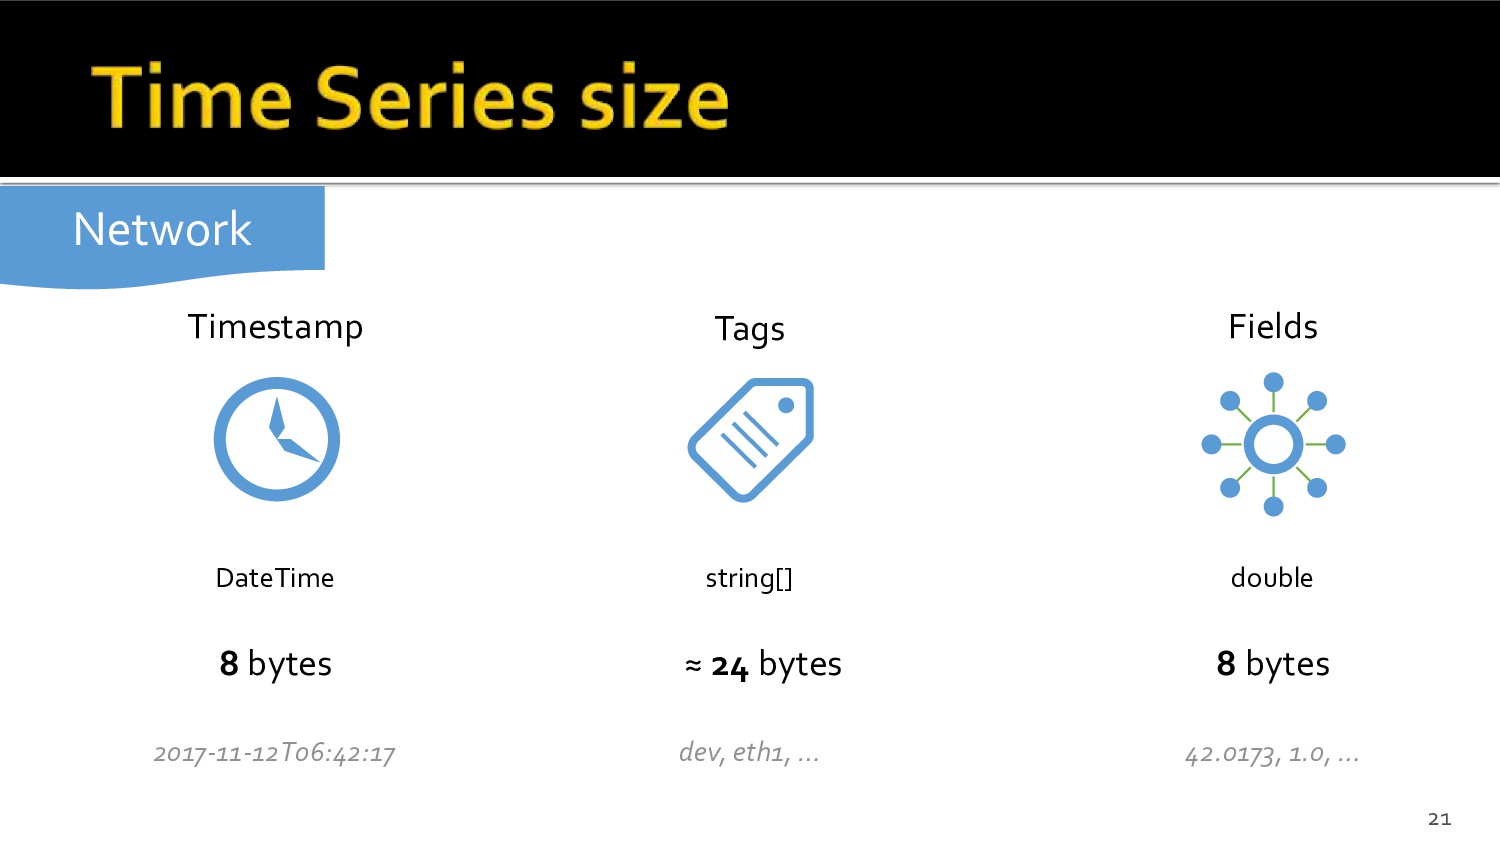
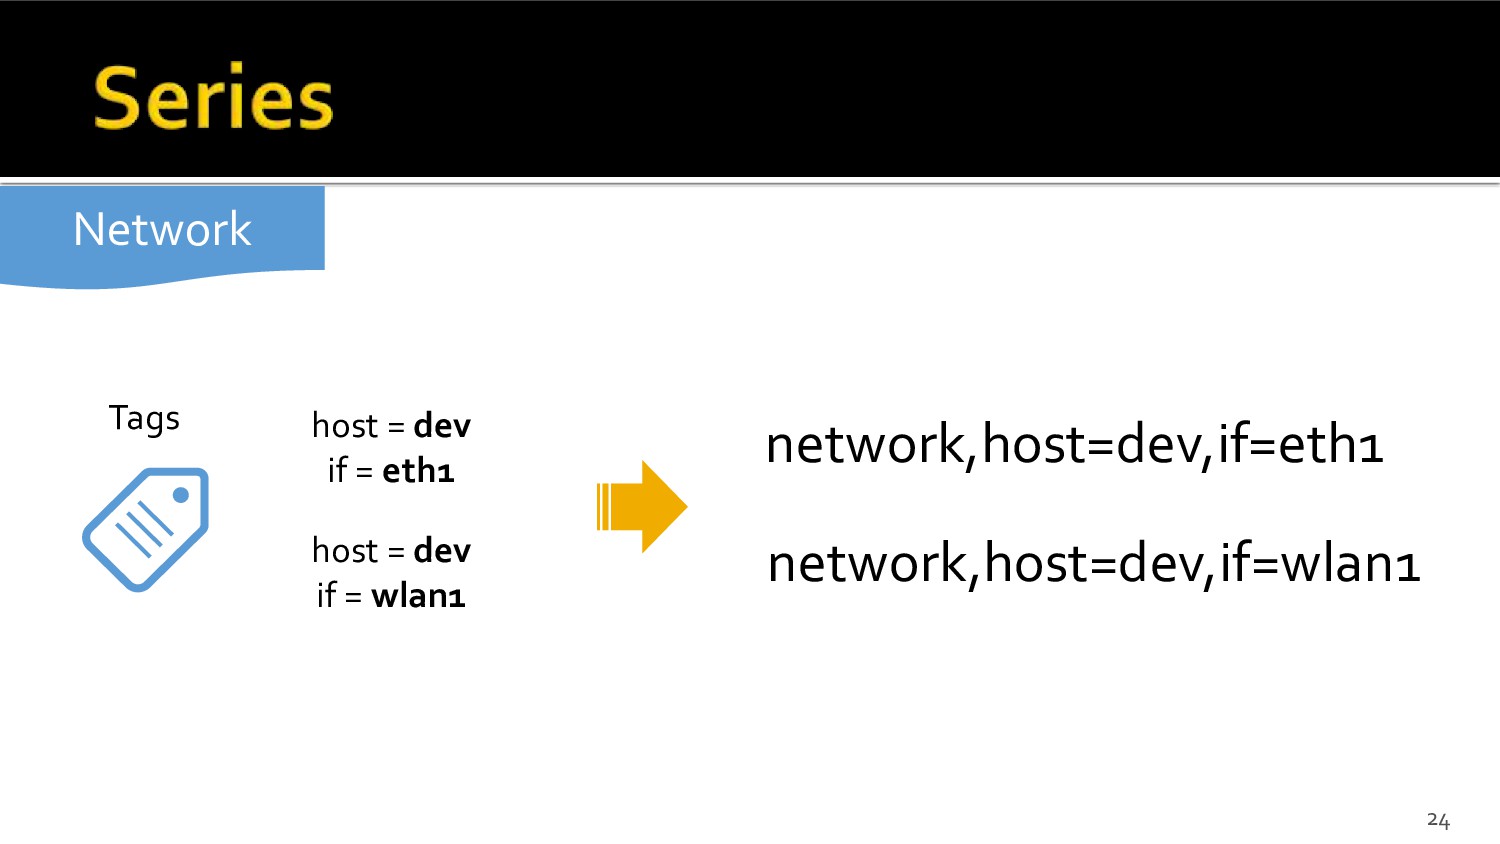
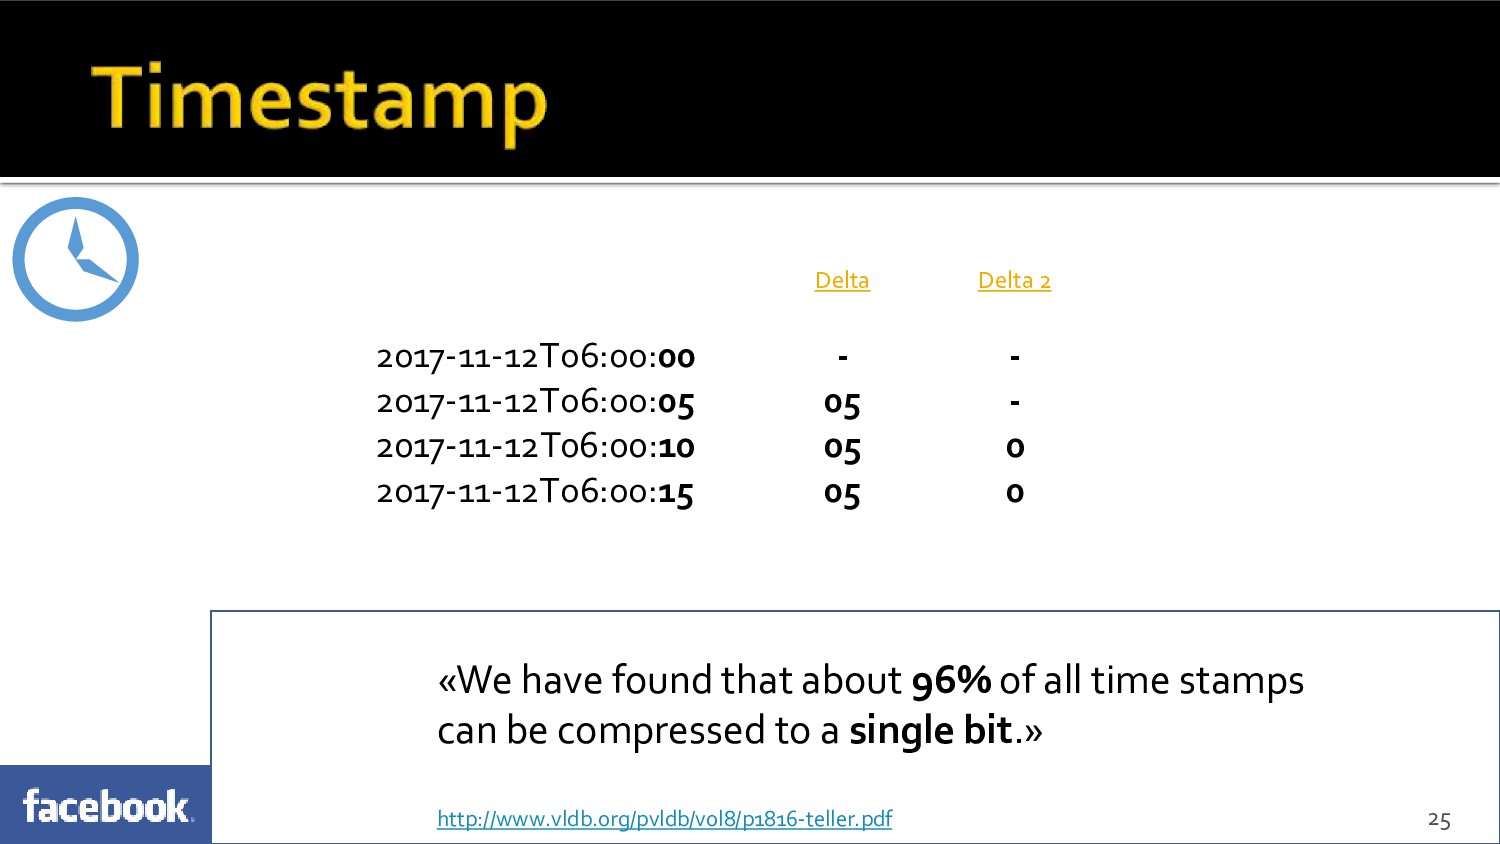
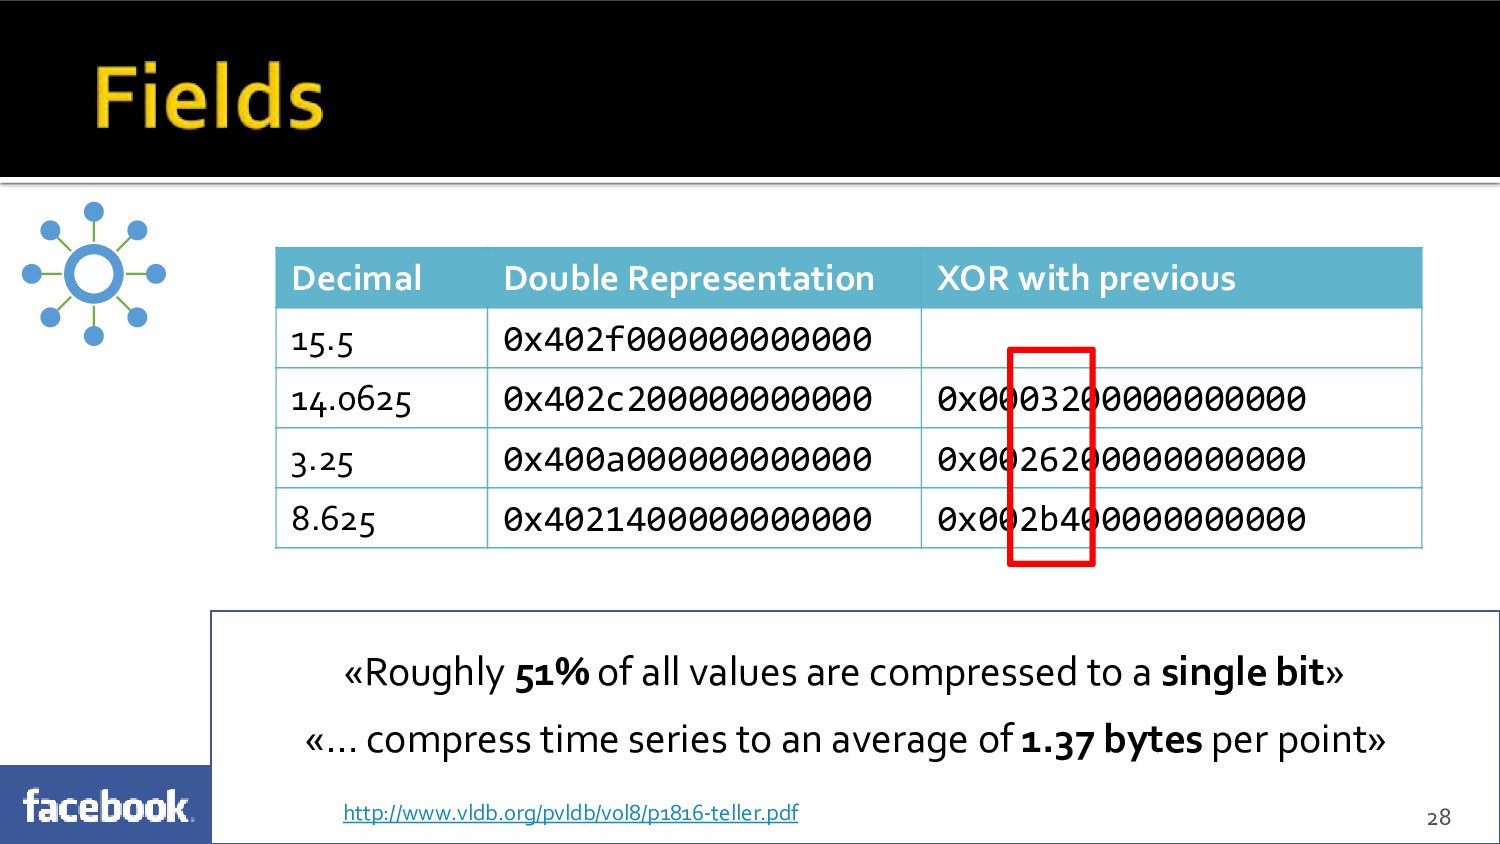
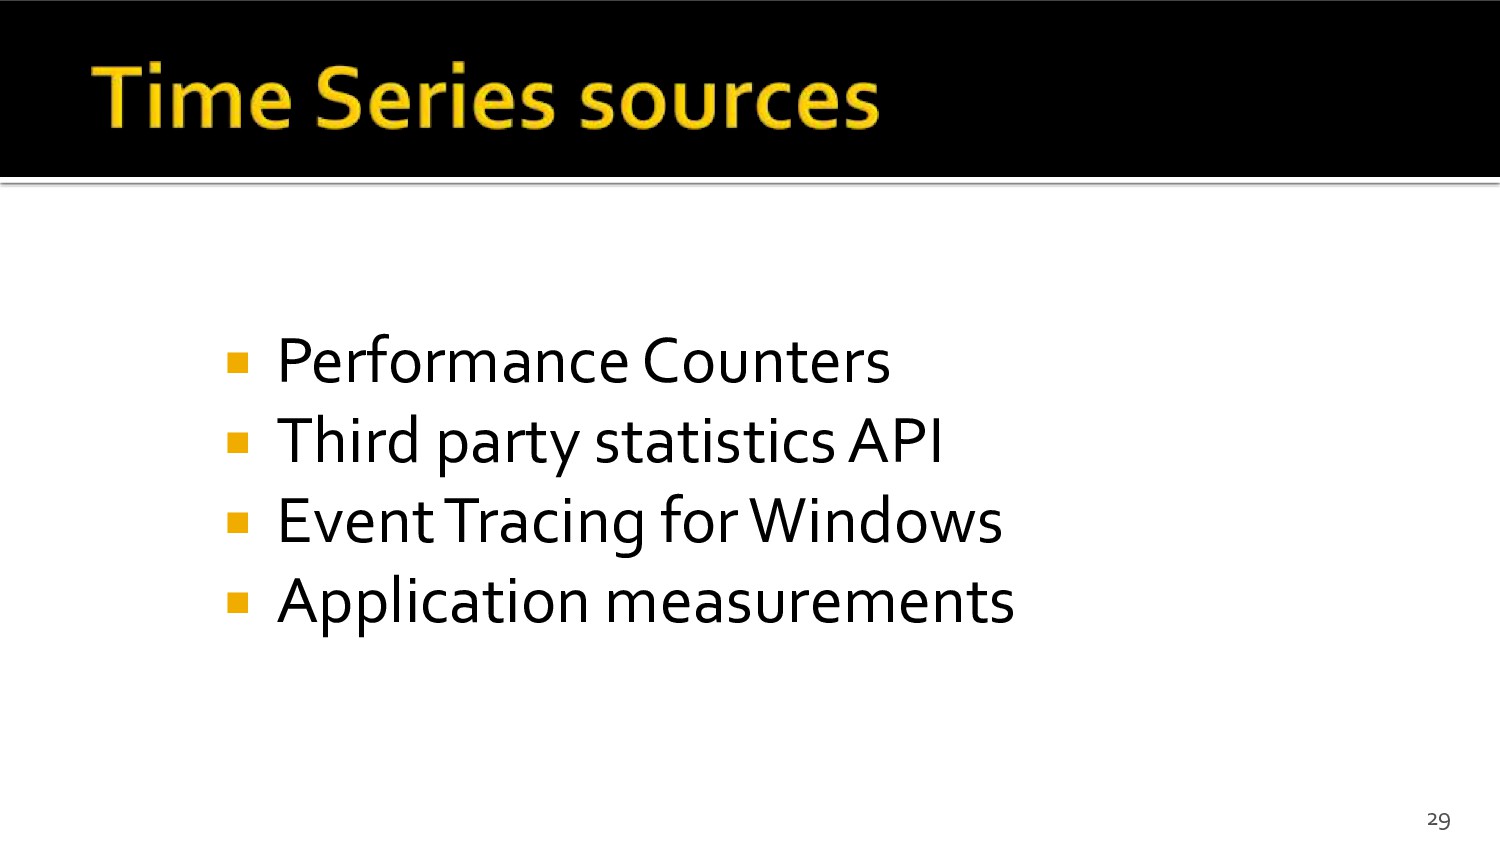
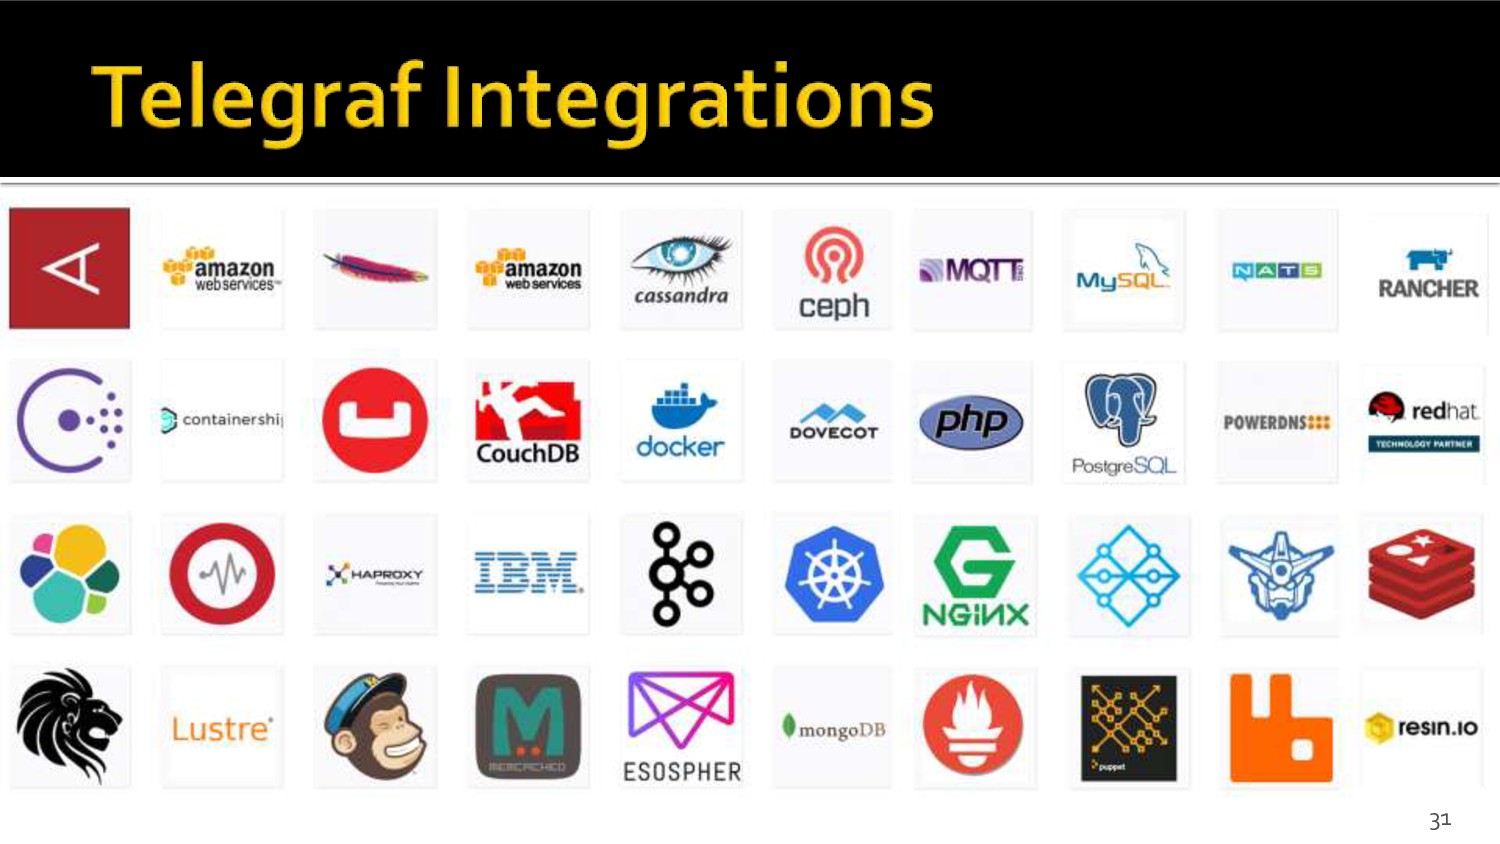
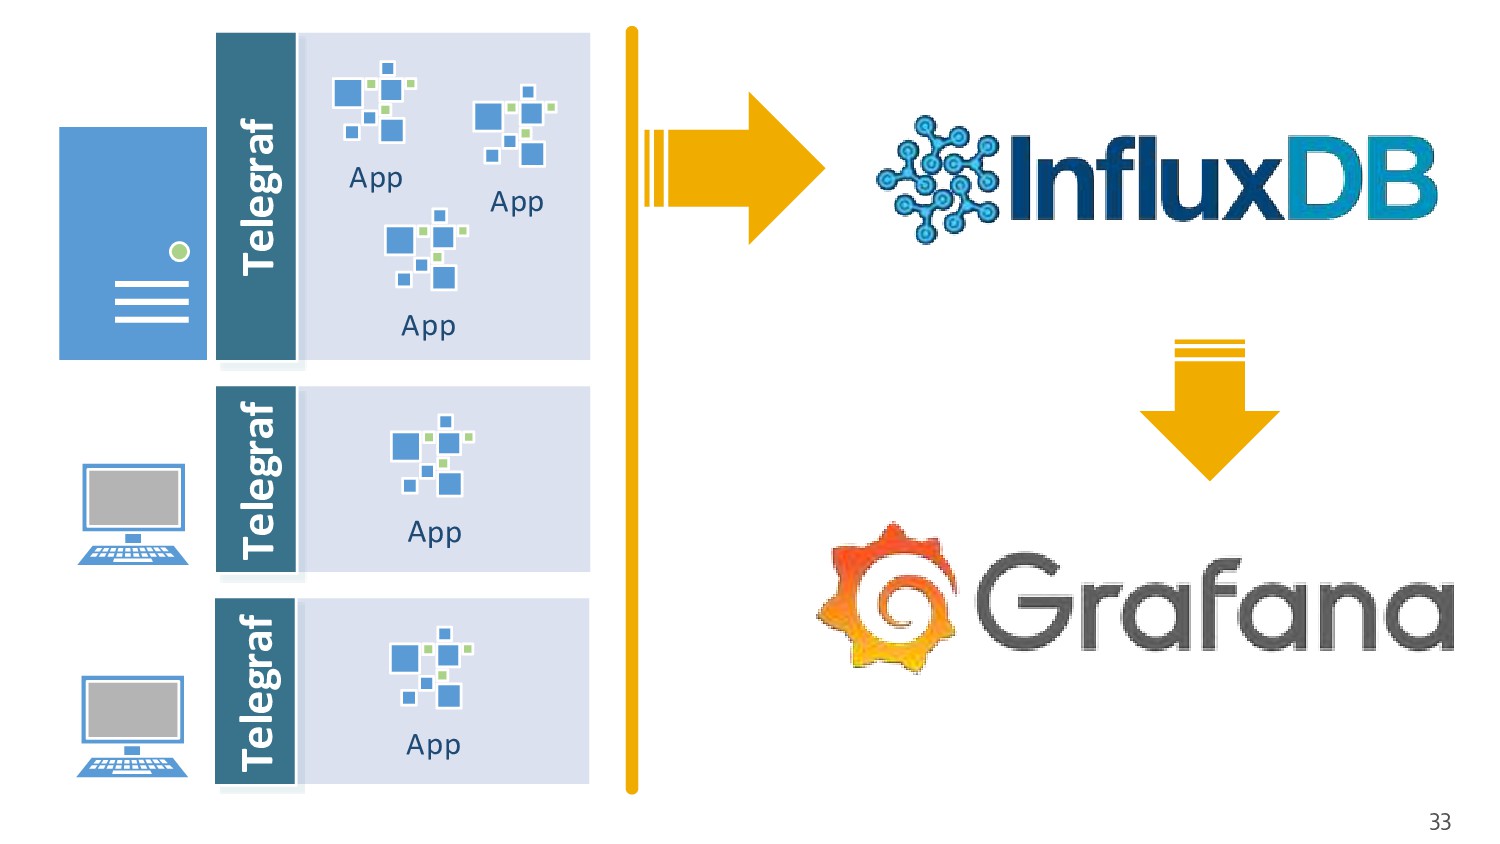
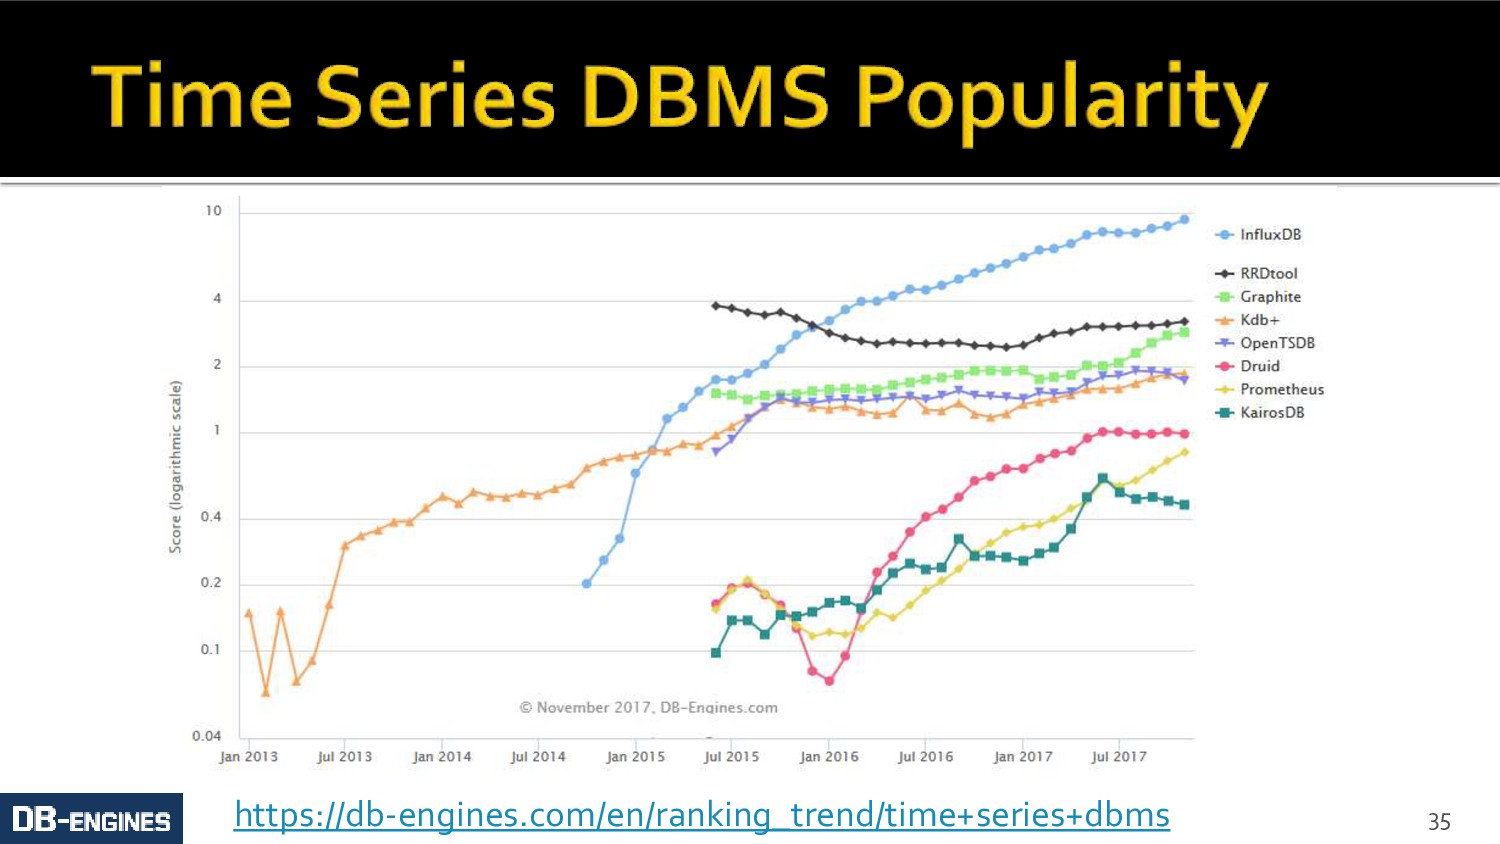
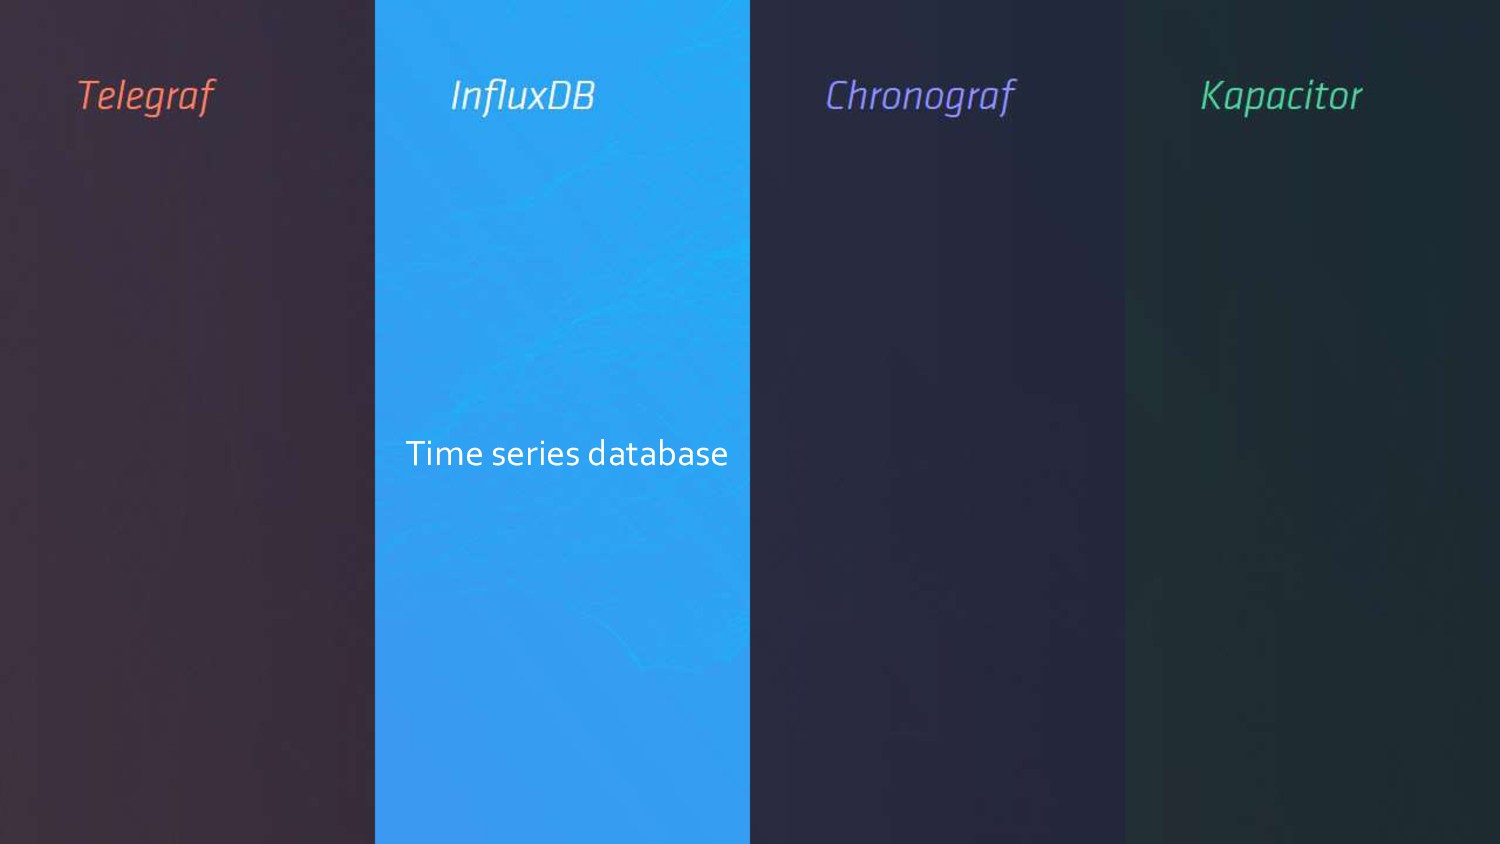
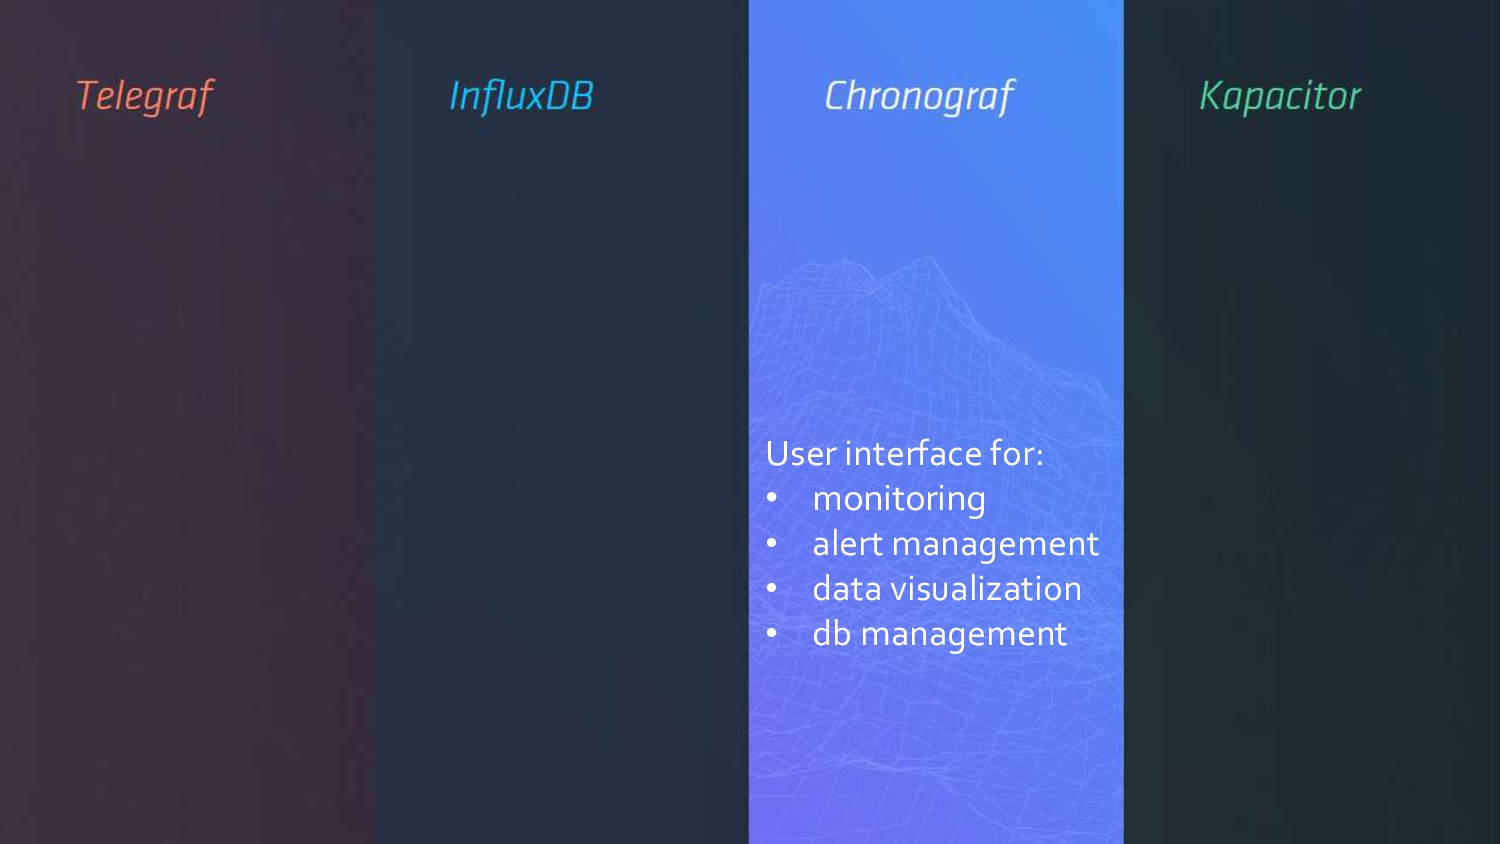
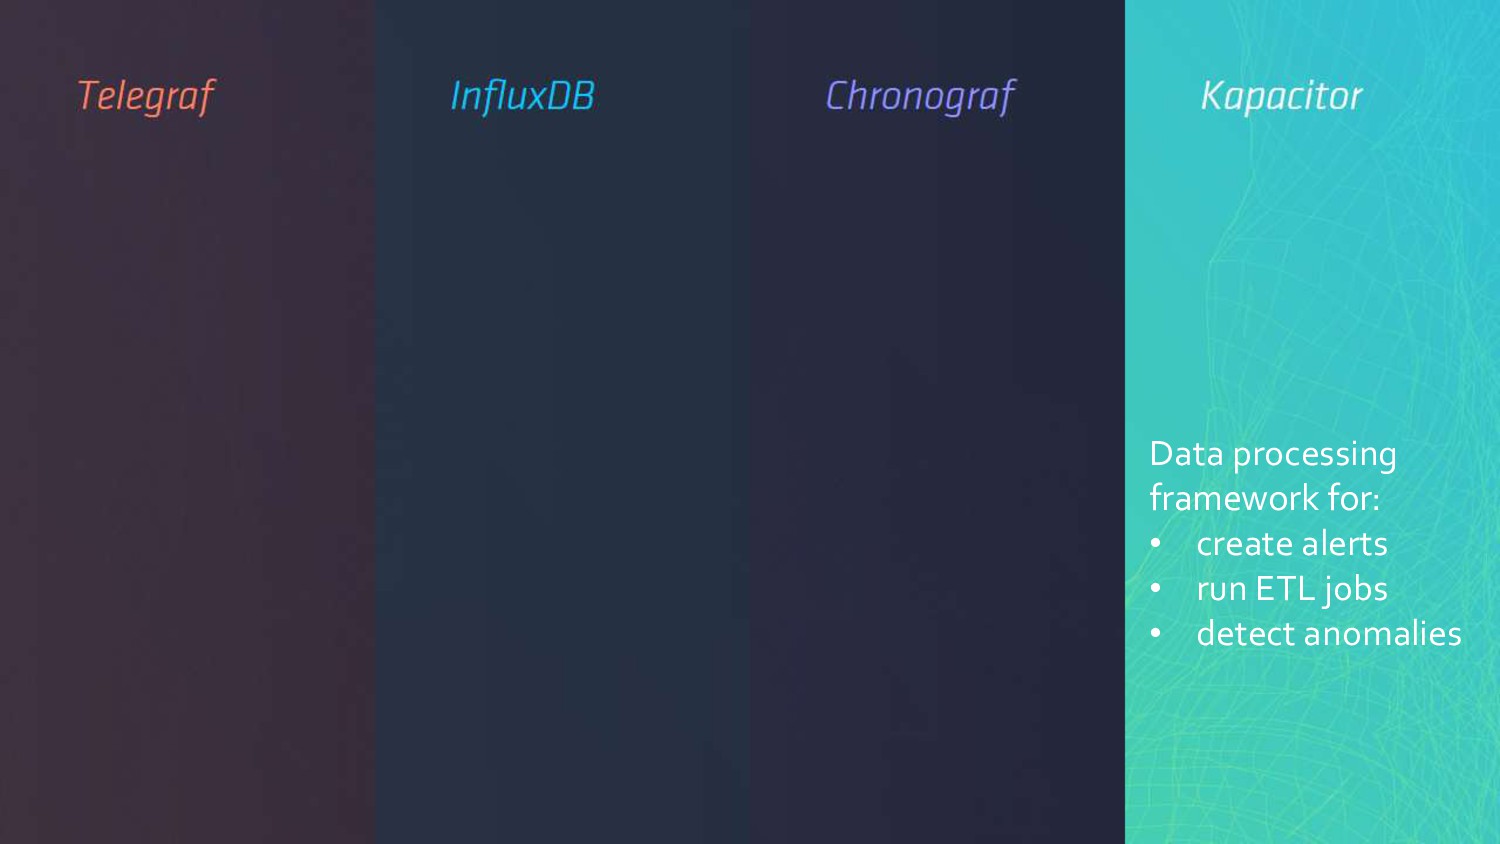
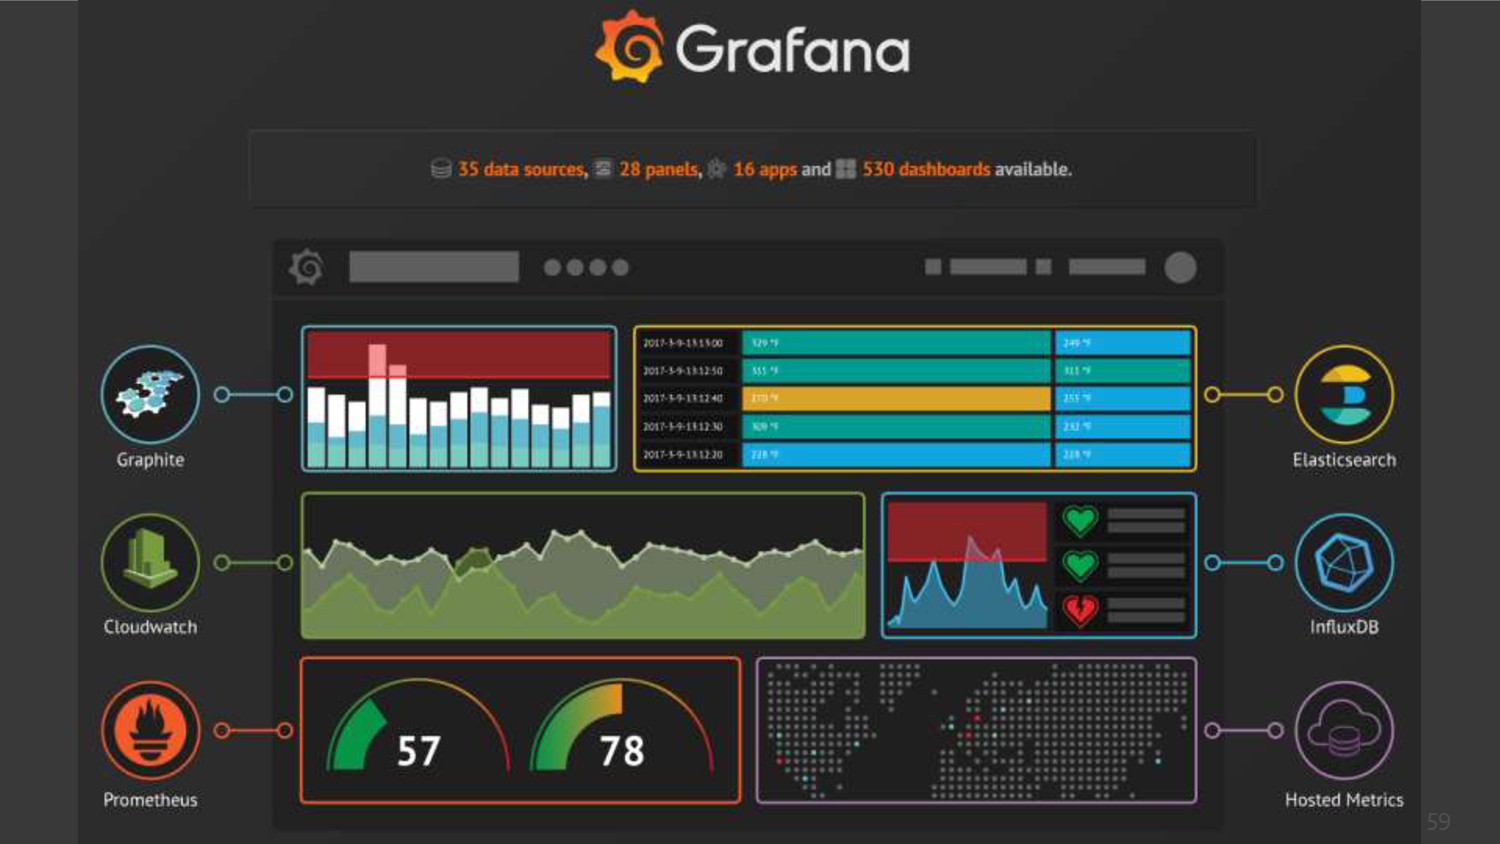
В этом докладе мы рассмотрим, каким образом можно наблюдать за работой продукта и его боевым окружением, научимся собирать жизненно необходимые метрики и представлять их в удобоваримом виде. Узнаем, что такое Time Series и как они могут помочь нашим и сторонним приложениям в процессе диагностики. Подробно познакомимся с лидерами рынка инструментов для мониторинга, специализированным хранилищем InfluxDB и системой визуализации данных Grafana.

DotNetRu

November 23, 2017
Tweet

More Decks by DotNetRu

Other Decks in Programming

Transcript

  1. 1

  2. 2

  3.  Troubleshooting & Remediation -Where did the problem occur? 

    Performance & Cost - How my changes impact overall performance?  Learning & Improvement - Can I detect or prevent this problem in the future?  Trends - Do I need to scale?  Customer Experience - Are my customers getting a good experience? 3
  4. 5

  5. 6

  6. 7 100 measurements 200 hosts every 10 sec × 86

    400 seconds in a day 172 800 000 points per day
  7. 11

  8. 12

  9. 13

  10. 14

  11. 15

  12. 16

  13. 17

  14. 18

  15. 19 Timestamp 2017-11-12T06:42:17 2017-11-12T06:43:18 Fields rx = 42 tx =

    10 rx = 50 tx = 88 Tags host = dev if = eth1 host = dev if = wlan1 Network
  16. 21 Timestamp Tags Fields 2017-11-12T06:42:17 42.0173, 1.0, … dev, eth1,

    … Network DateTime string[] double 8 bytes ≈ 24 bytes 8 bytes
  17. 22

  18. 23

  19. 24 Network Tags host = dev if = eth1 host

    = dev if = wlan1 network,host=dev,if=eth1 network,host=dev,if=wlan1
  20. 25 2017-11-12T06:00:00 2017-11-12T06:00:05 2017-11-12T06:00:10 2017-11-12T06:00:15 - 05 05 05 Delta

    - - 0 0 Delta 2 «We have found that about 96% of all time stamps can be compressed to a single bit.» http://www.vldb.org/pvldb/vol8/p1816-teller.pdf
  21. 28 Decimal Double Representation XOR with previous 15.5 0x402f000000000000 14.0625

    0x402c200000000000 0x0003200000000000 3.25 0x400a000000000000 0x0026200000000000 8.625 0x4021400000000000 0x002b400000000000 «Roughly 51% of all values are compressed to a single bit» http://www.vldb.org/pvldb/vol8/p1816-teller.pdf «… compress time series to an average of 1.37 bytes per point»
  22.  Performance Counters  Third party statistics API  Event

    Tracing for Windows  Application measurements 29
  23. 30

  24. 31

  25. 32

  26. 34

  27.  Billions of individual data points  High write throughput

     High read throughput  Large deletes (data expiration)  Mostly an insert/append workload, very few updates 36
  28. 37

  29. 38 SELECT median(rx), mean(tx) FROM network WHERE time > now()

    - 15m AND host = 'dev' GROUP BY time(10s)
  30. 41 Load Field writes per second Queries per second Unique

    series Low < 5 thousand < 5 < 100 thousand Moderate < 250 thousand < 25 < 1 million High > 250 thousand > 25 > 1 million Infeasible > 750 thousand > 100 > 10 million CPU: 4-6 cores RAM: 8-32 GB IOPS: 500-1000 https://docs.influxdata.com/influxdb/v1.3/guides/hardware_sizing/
  31. 42

  32. Write Performance InfluxDB outperformed: • MongoDB by 27x • Cassandra

    by 5x • Elasticsearch by 8x • OpenTSDB by 5x 43 InfluxDB MongoDB Cassandra Elasticsearch OpenTSDB https://www.influxdata.com/_resources/
  33. Compression InfluxDB outperformed: • MongoDB by 84x • Cassandra by

    9x • Elasticsearch by 16x • OpenTSDB by 16x 44 InfluxDB MongoDB Cassandra Elasticsearch OpenTSDB https://www.influxdata.com/_resources/
  34. Query Performance InfluxDB outperformed: • MongoDB similarly • Cassandra by

    168x • Elasticsearch by 10x • OpenTSDB by 4x 45 InfluxDB MongoDB Cassandra Elasticsearch OpenTSDB https://www.influxdata.com/_resources/
  35. 46

  36. 47

  37.  Install Telegraf and Dashboard  Install AppMetrics and Dashboard

     Use it  Remove unnecessary metrics  Add new application-specific metrics 48
  38. 50

  39. 52

  40. 53

  41. 59

  42. 61 Query and Write performance Compression RealtimeAnalysis Statistics and Aggregation

    Retention Policy Continuous Queries Downsampling High Loads High Throughput
  43. 62 Query and Write performance Compression RealtimeAnalysis Statistics and Aggregation

    Retention Policy Continuous Queries Downsampling High Loads High Throughput
  44. 71

  45. 72

  46.  Gorilla Paper  Akumuli  Run-length encoding  Varints,

    ZigZag  Dynamic time warping  Sketch-based change detection 73
  47.  InfluxData Docs (docs.influxdata.com)  Grafana Docs (docs.grafana.org)  App

    Metrics (app-metrics.io)  Non-Sucking Service Manager (nssm.cc) 74