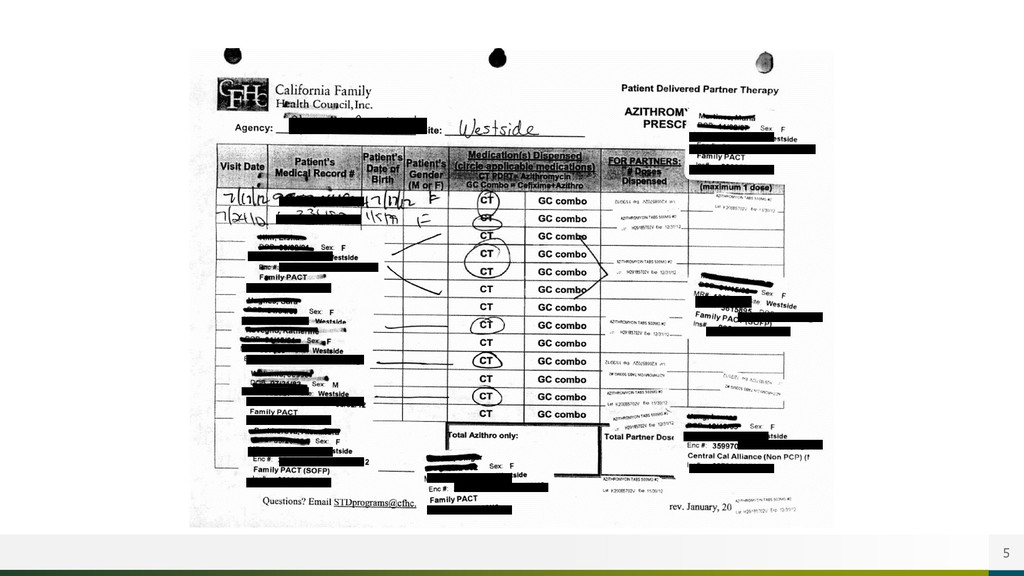
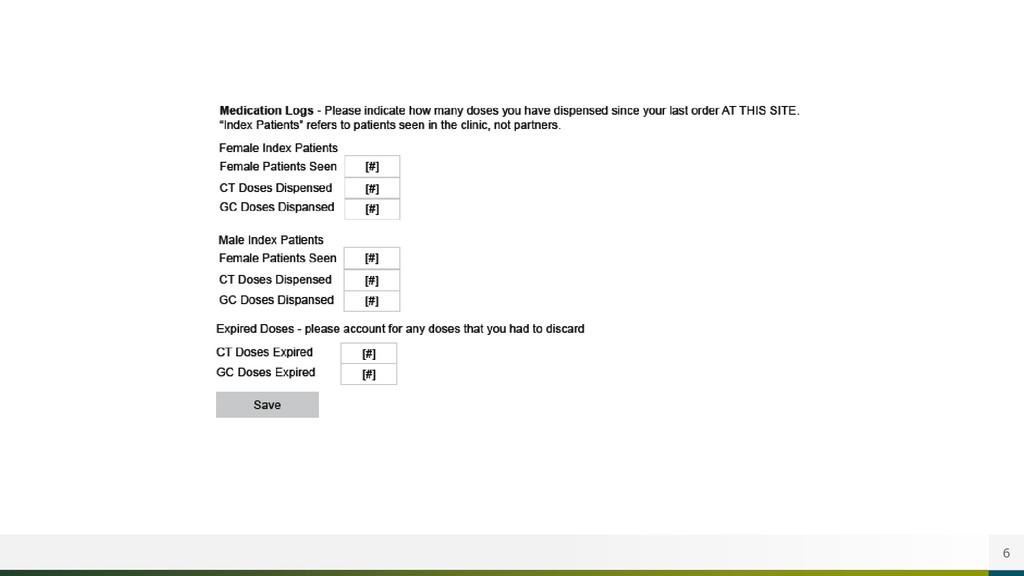
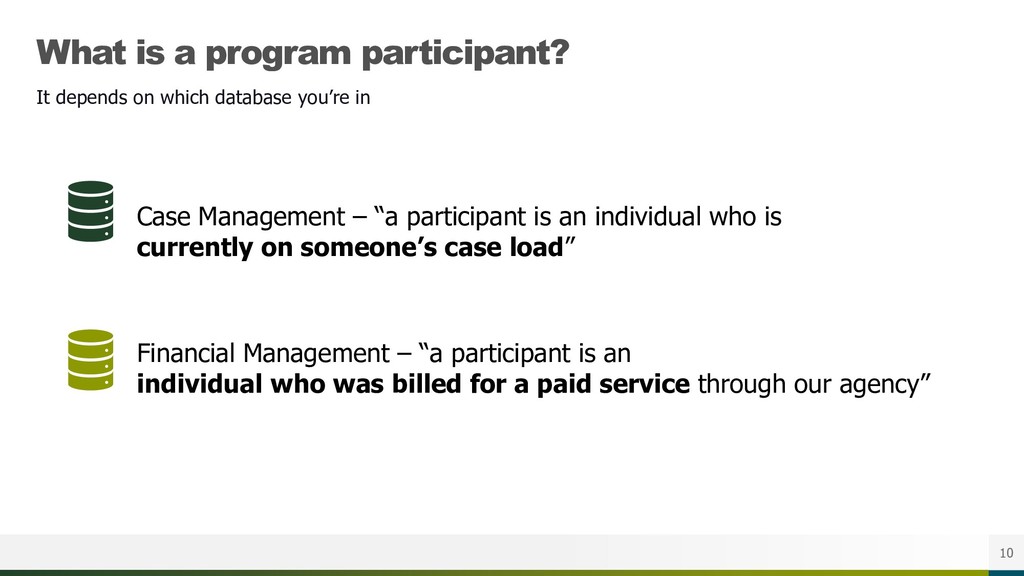
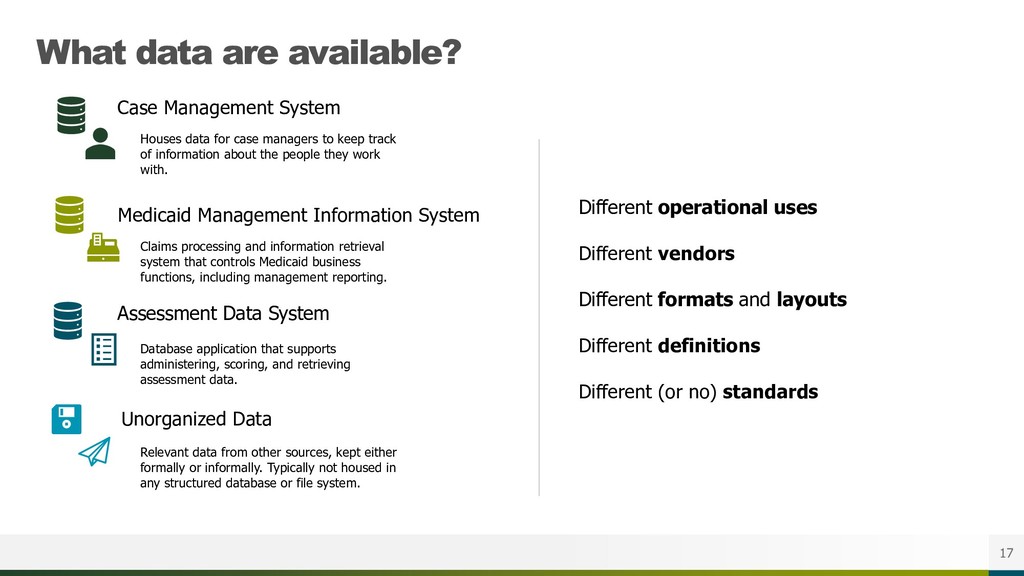
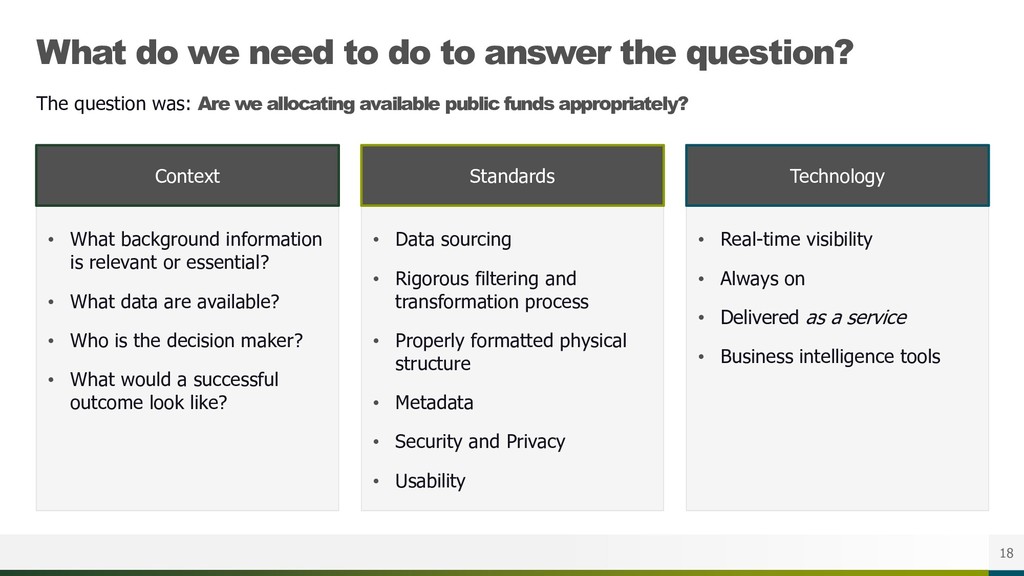
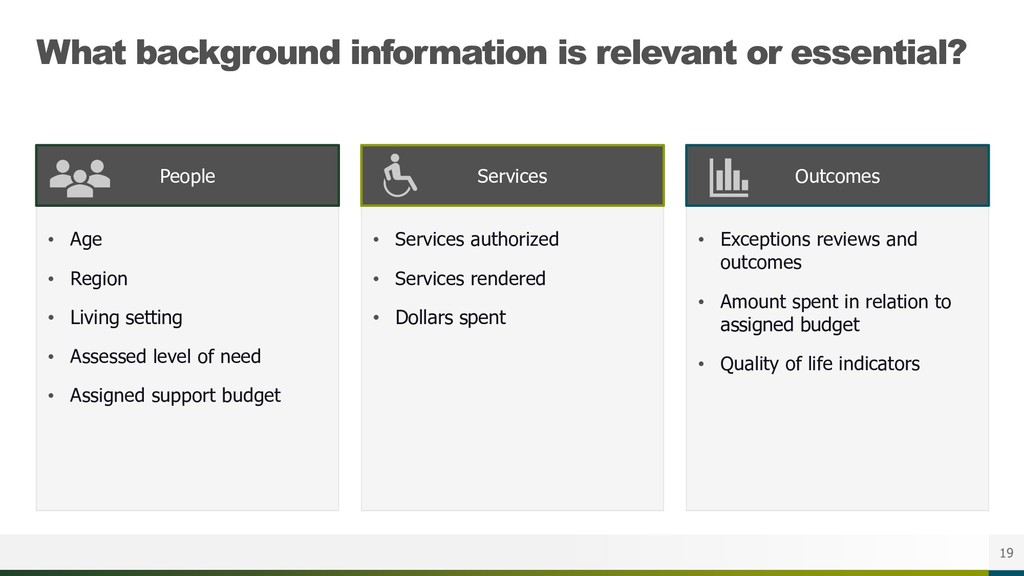
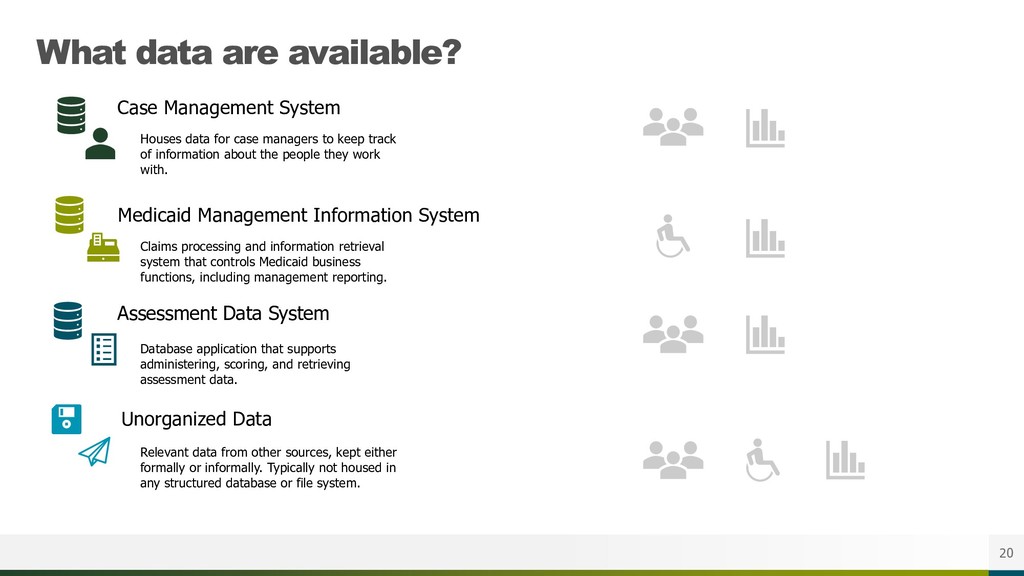
In today’s age, data is ubiquitous – public health systems certainly express this fact, with datasets such as support assessment information, Medicaid expenditure data, and data from case management systems all providing important information about individuals in service systems.
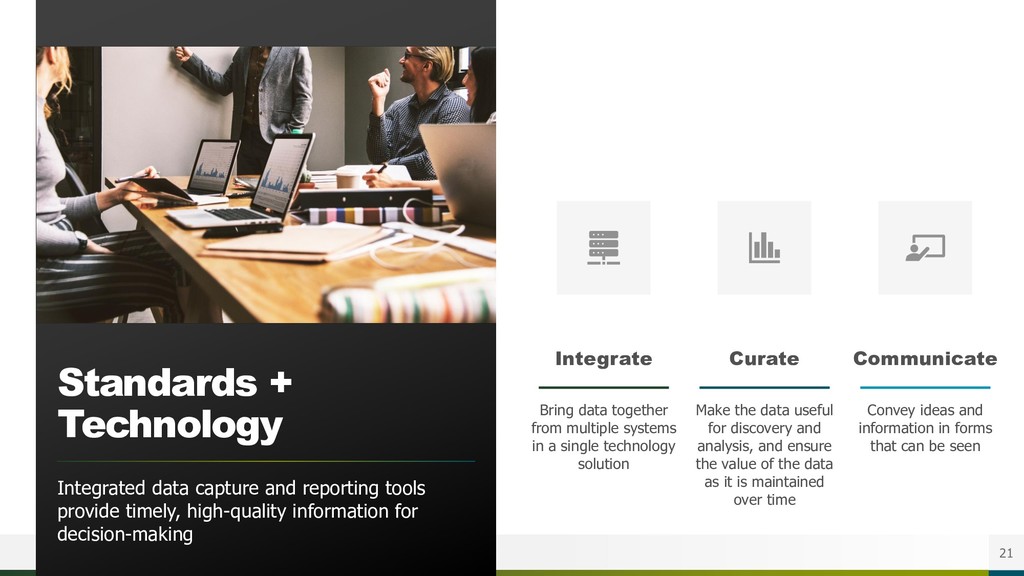
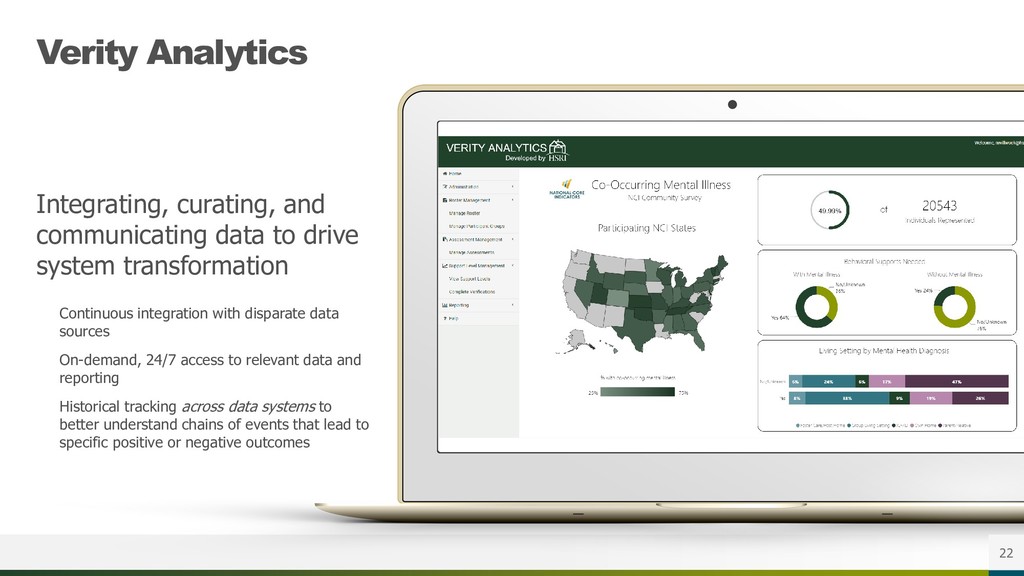
However, these data often reside in information silos that make meaningful interaction and knowledge translation between them difficult. Data integration is the combination of technical and business processes used to combine data from different sources into meaningful and valuable information. Data integration digitizes workflow, improves collaboration, saves time, reduces errors, and, ultimately, delivers more valuable data that can be analyzed and acted on.
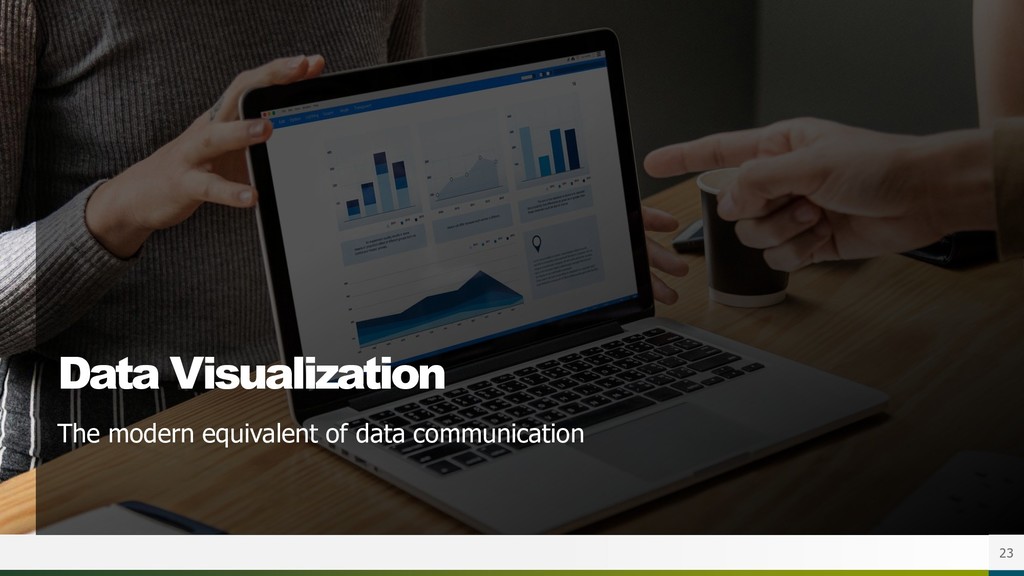
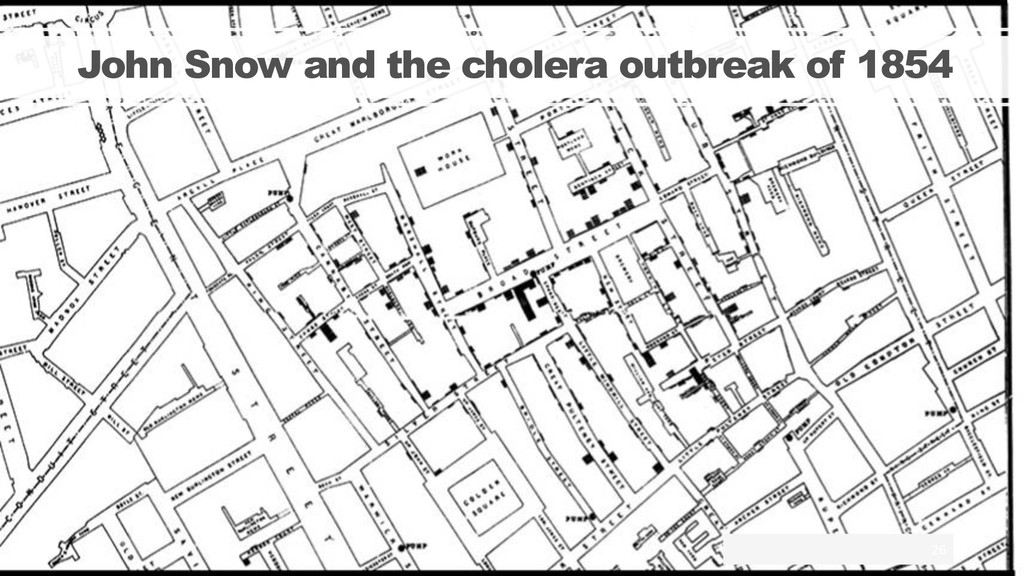
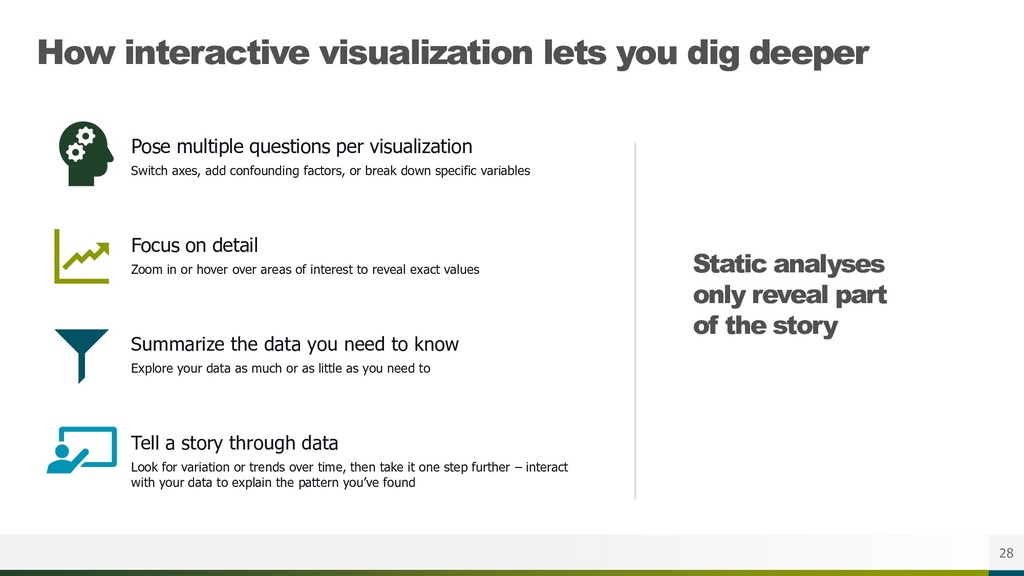
Additionally, visualization tools can organize and display this information in meaningful ways that allow policymakers to make sense of the data and make data-driven decisions. Users of these visual interfaces can scan, recognize, understand, and recall visually-structured representations more rapidly than they can process non-structured representations. The science of visualization draws on many fields, including perceptual psychology, statistics, graphic design, and advances in rapid processing and dynamic displays to design user interfaces that permit powerful interactive visual analysis.
For this presentation, Megan Villwock, Business Systems Analyst with Cambridge-based Human Services Research Institute (HSRI) will demonstrate how data integration and visualization methods have been used in several jurisdictions to help policymakers understand their intellectual and developmental disability (IDD) service systems and make data-driven policy decisions as part of a systems redesign process. Among the data sources used will be Supports Intensity Scale assessment data, Medicaid Waiver expenditure data, demographics derived from case management systems, and historical metadata.
Taken together and measured over time, these integrated data can provide policymakers with a relevant, timely, and comprehensive view of their systems to foster responsive policy decisions that best serve people.