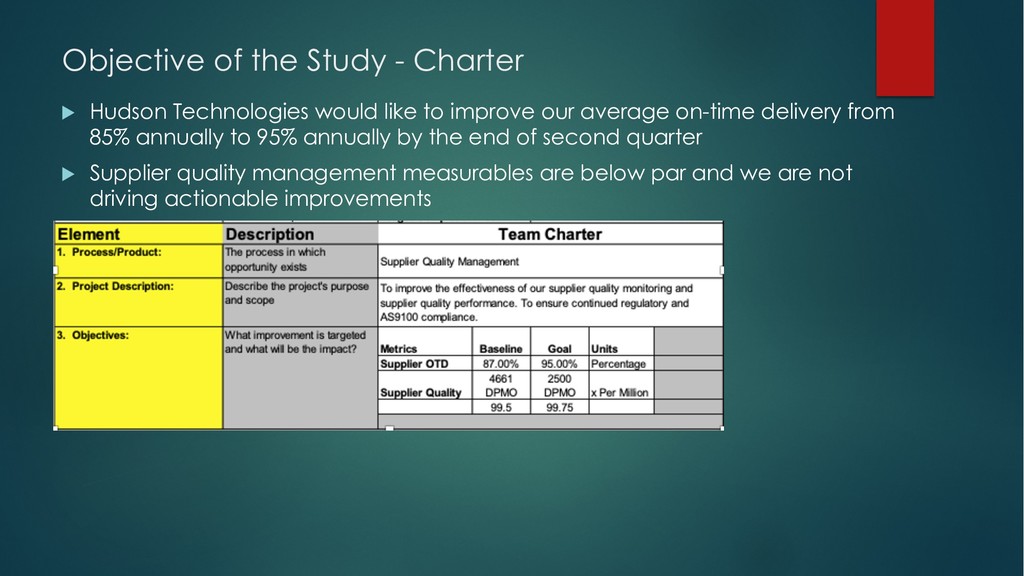
like to improve our average on-time delivery from 85% annually to 95% annually by the end of second quarter u Supplier quality management measurables are below par and we are not driving actionable improvements
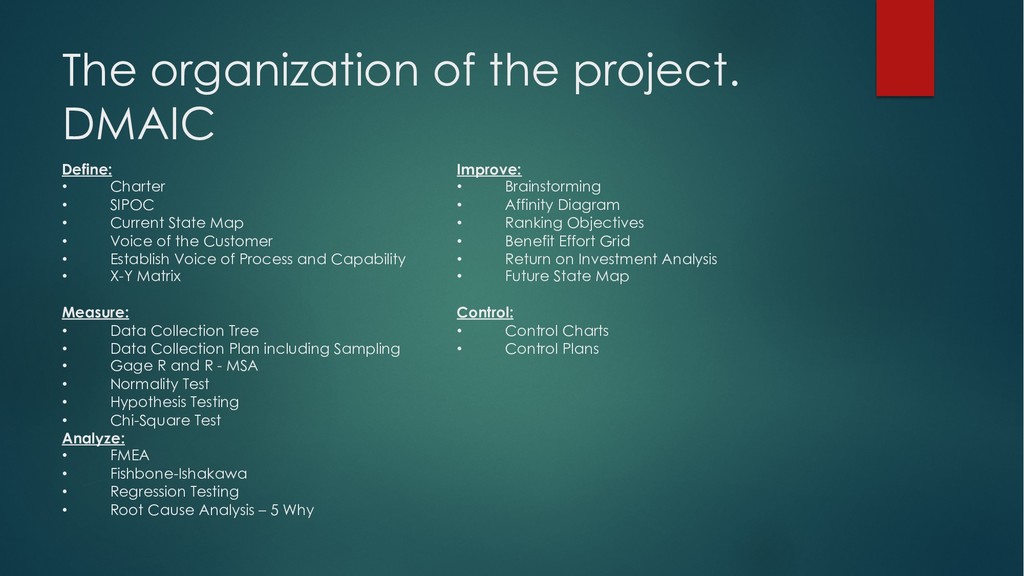
SIPOC • Current State Map • Voice of the Customer • Establish Voice of Process and Capability • X-Y Matrix Measure: • Data Collection Tree • Data Collection Plan including Sampling • Gage R and R - MSA • Normality Test • Hypothesis Testing • Chi-Square Test Analyze: • FMEA • Fishbone-Ishakawa • Regression Testing • Root Cause Analysis – 5 Why Improve: • Brainstorming • Affinity Diagram • Ranking Objectives • Benefit Effort Grid • Return on Investment Analysis • Future State Map Control: • Control Charts • Control Plans
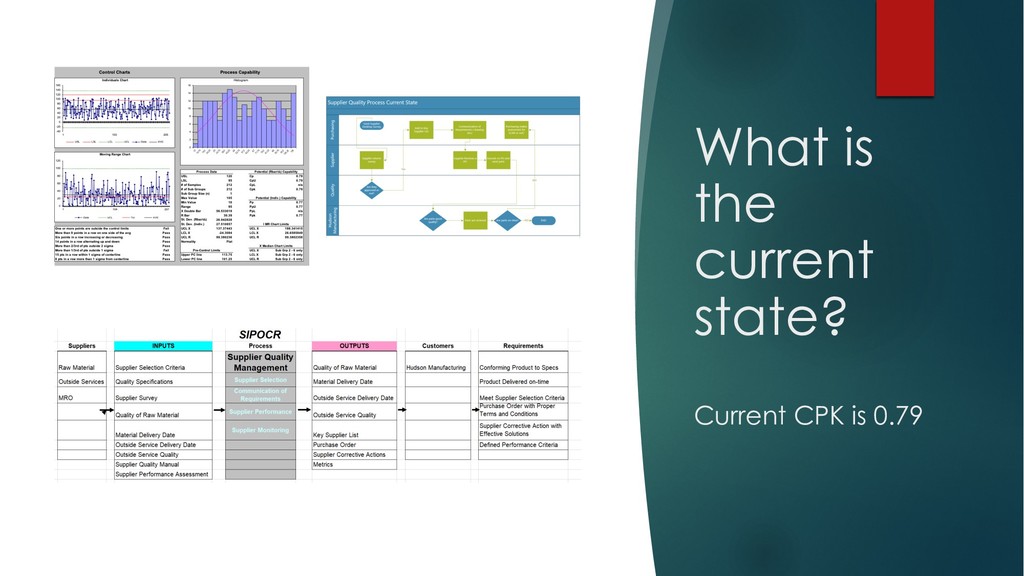
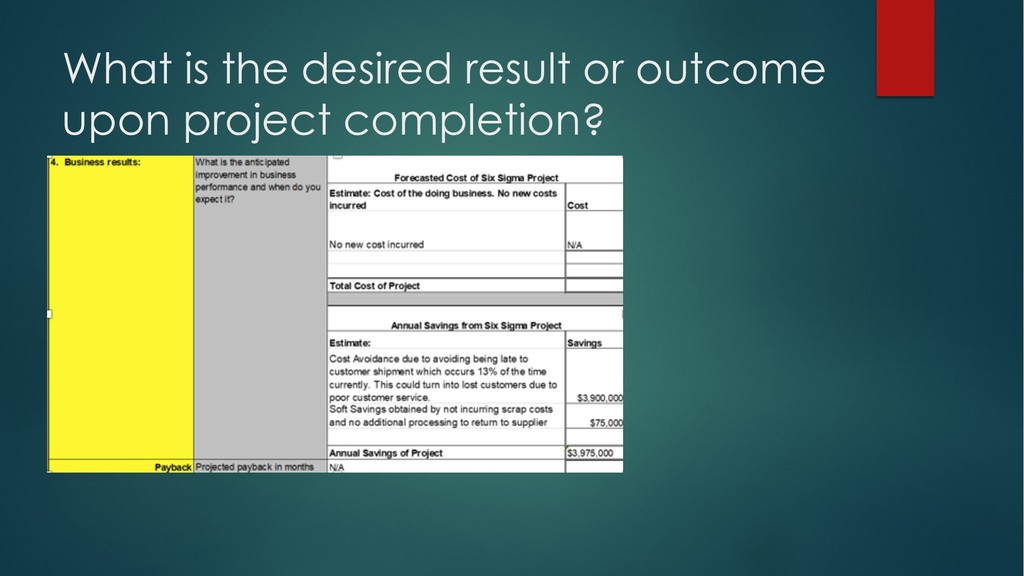
on a current state OTD of 87%. This is predicted as a cost avoidance. u The SIPOC helped the team realized how big of a factor supplier OTD is to our overall process success. u The cause and effect matrix identified where the largest factors exist to impact our metrics which are OTD and supplier quality. This narrowed the scope of this project to a more manageable undertaking.
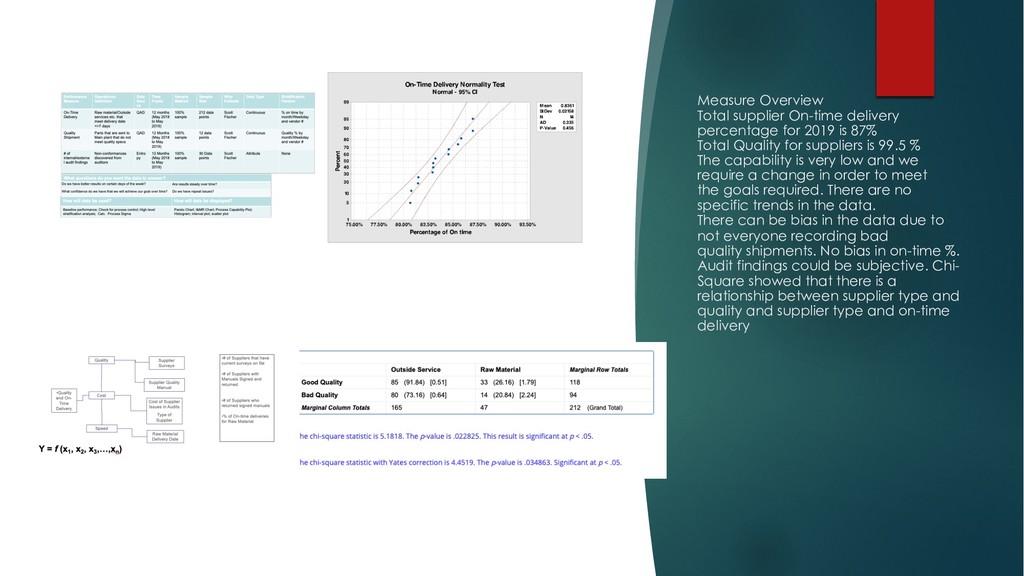
87% Total Quality for suppliers is 99.5 % The capability is very low and we require a change in order to meet the goals required. There are no specific trends in the data. There can be bias in the data due to not everyone recording bad quality shipments. No bias in on-time %. Audit findings could be subjective. Chi- Square showed that there is a relationship between supplier type and quality and supplier type and on-time delivery
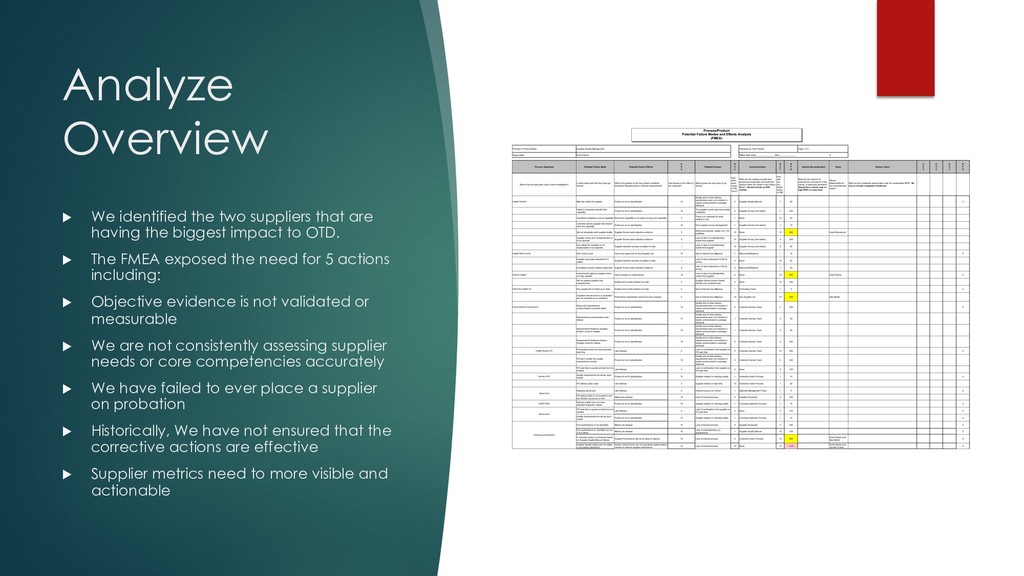
having the biggest impact to OTD. u The FMEA exposed the need for 5 actions including: u Objective evidence is not validated or measurable u We are not consistently assessing supplier needs or core competencies accurately u We have failed to ever place a supplier on probation u Historically, We have not ensured that the corrective actions are effective u Supplier metrics need to more visible and actionable
future state process u Key Supplier List is now maintained as part of approval u Outside services are now audited On site and Raw material from Desktop Survey u Suppliers are now put on probation if missing goal 3 times u Supplier Quality Metrics are now part of a Weekly Gemba Walk with Root Cause Analysis done on big misses u Corrective Actions are issued based on the sample plan u New Metrics are established in the Supplier Quality Manual u OTD >=95% u Supplier Quality = DPMO 2500
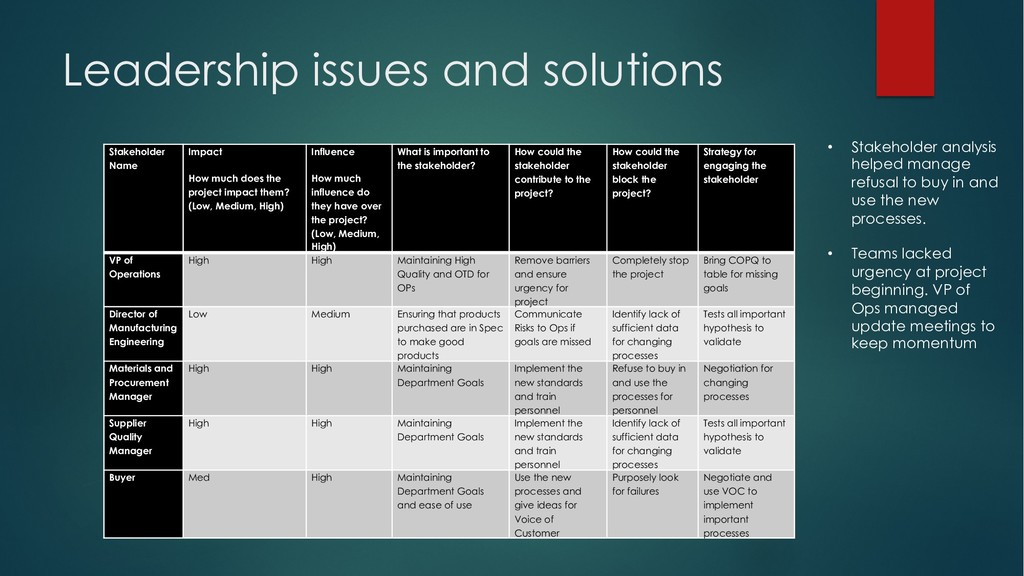
the project impact them? (Low, Medium, High) Influence How much influence do they have over the project? (Low, Medium, High) What is important to the stakeholder? How could the stakeholder contribute to the project? How could the stakeholder block the project? Strategy for engaging the stakeholder VP of Operations High High Maintaining High Quality and OTD for OPs Remove barriers and ensure urgency for project Completely stop the project Bring COPQ to table for missing goals Director of Manufacturing Engineering Low Medium Ensuring that products purchased are in Spec to make good products Communicate Risks to Ops if goals are missed Identify lack of sufficient data for changing processes Tests all important hypothesis to validate Materials and Procurement Manager High High Maintaining Department Goals Implement the new standards and train personnel Refuse to buy in and use the processes for personnel Negotiation for changing processes Supplier Quality Manager High High Maintaining Department Goals Implement the new standards and train personnel Identify lack of sufficient data for changing processes Tests all important hypothesis to validate Buyer Med High Maintaining Department Goals and ease of use Use the new processes and give ideas for Voice of Customer Purposely look for failures Negotiate and use VOC to implement important processes • Stakeholder analysis helped manage refusal to buy in and use the new processes. • Teams lacked urgency at project beginning. VP of Ops managed update meetings to keep momentum
at 94%. u Supplier selection now allows us to assess risk as requested in AS9100 by understanding supplier core competencies and capabilities u Supplier probational process is eliminating weak suppliers and single source suppliers are being mitigated through strategic sourcing process u Supplier corrective action process and metrics are enforcing deep root cause analysis and developing supplier capabilities and resources needed to achieve 95% OTD