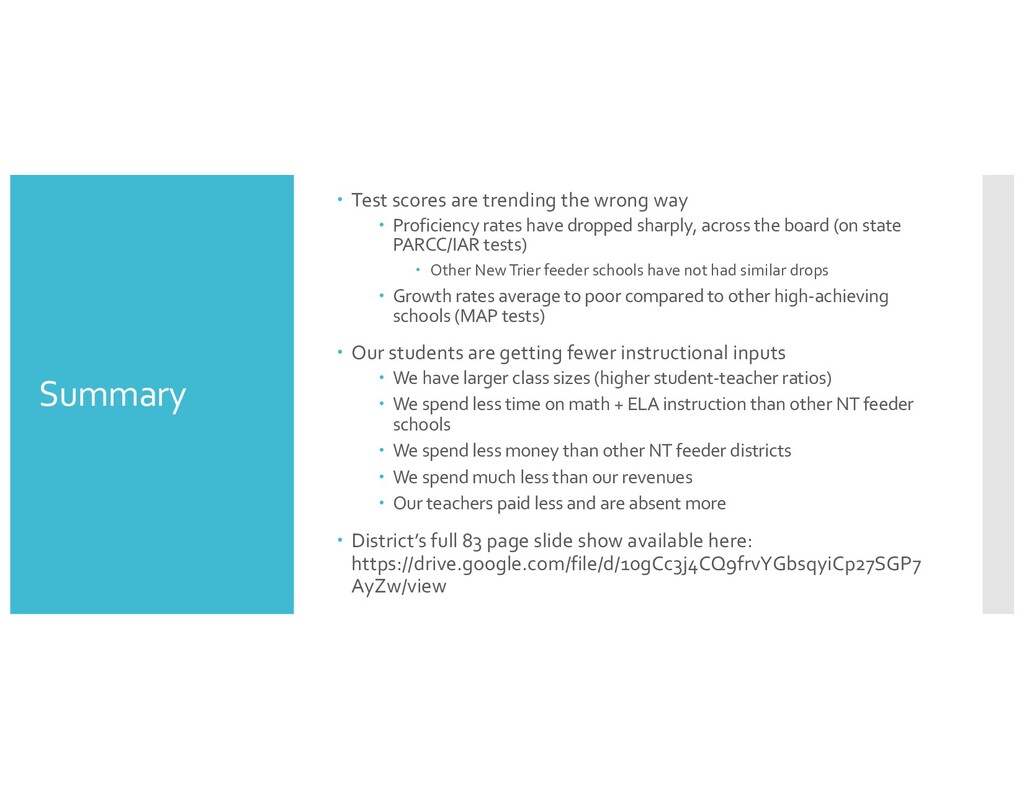
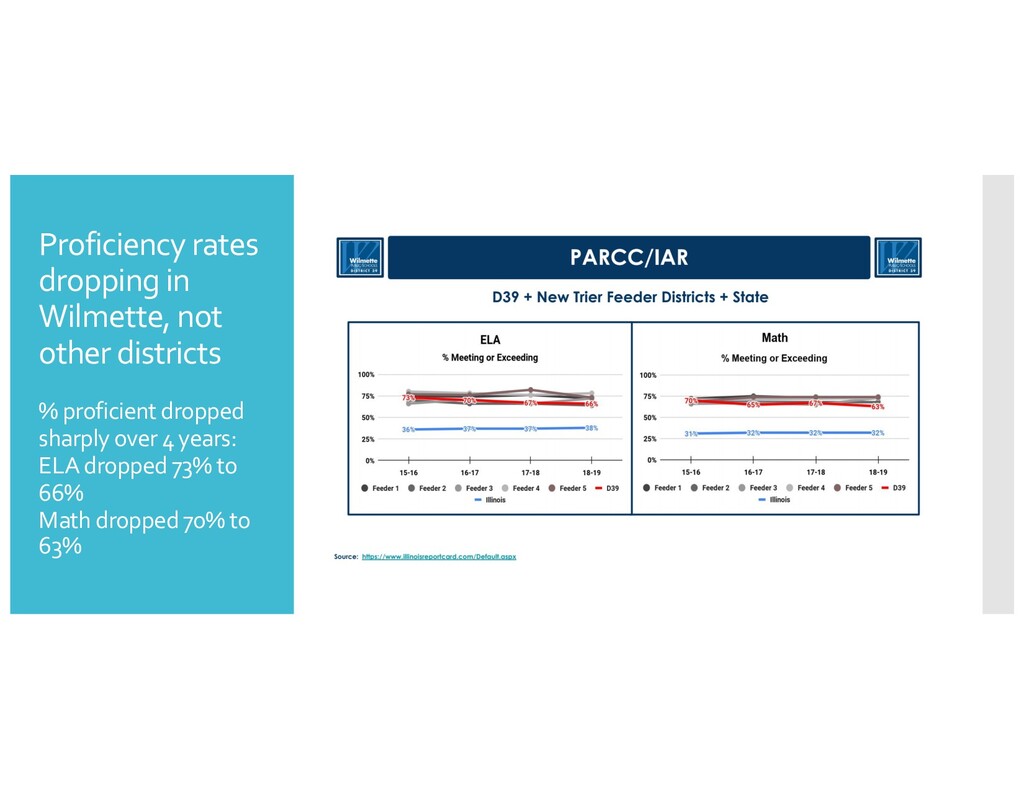
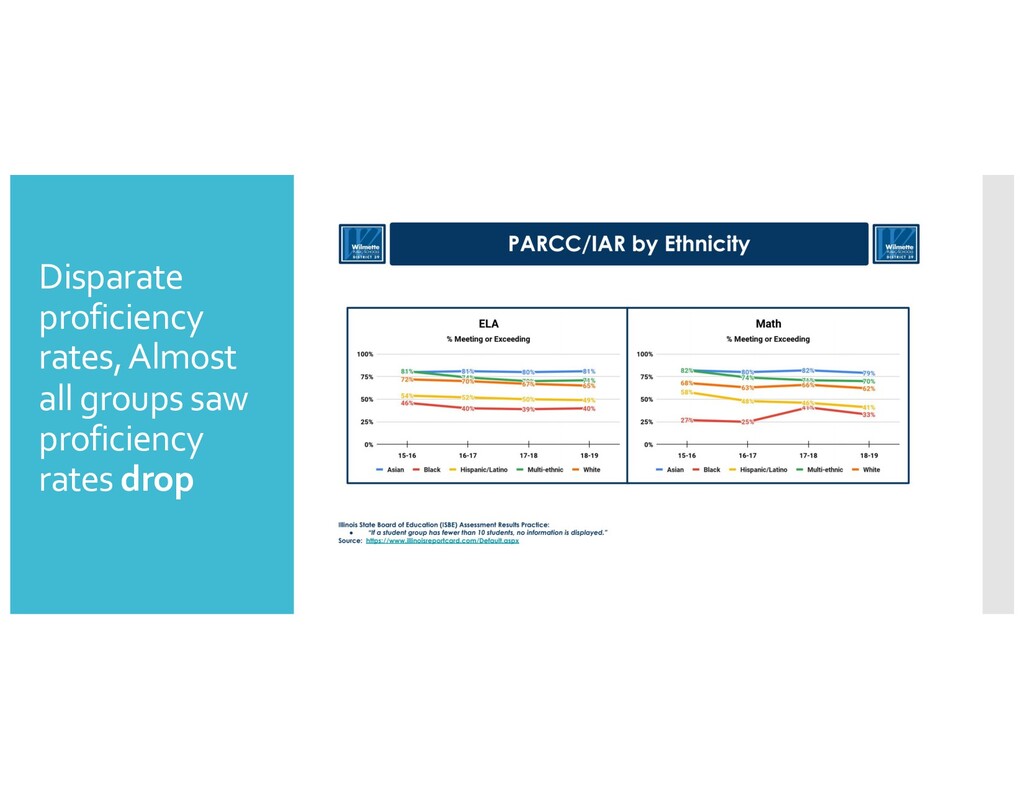
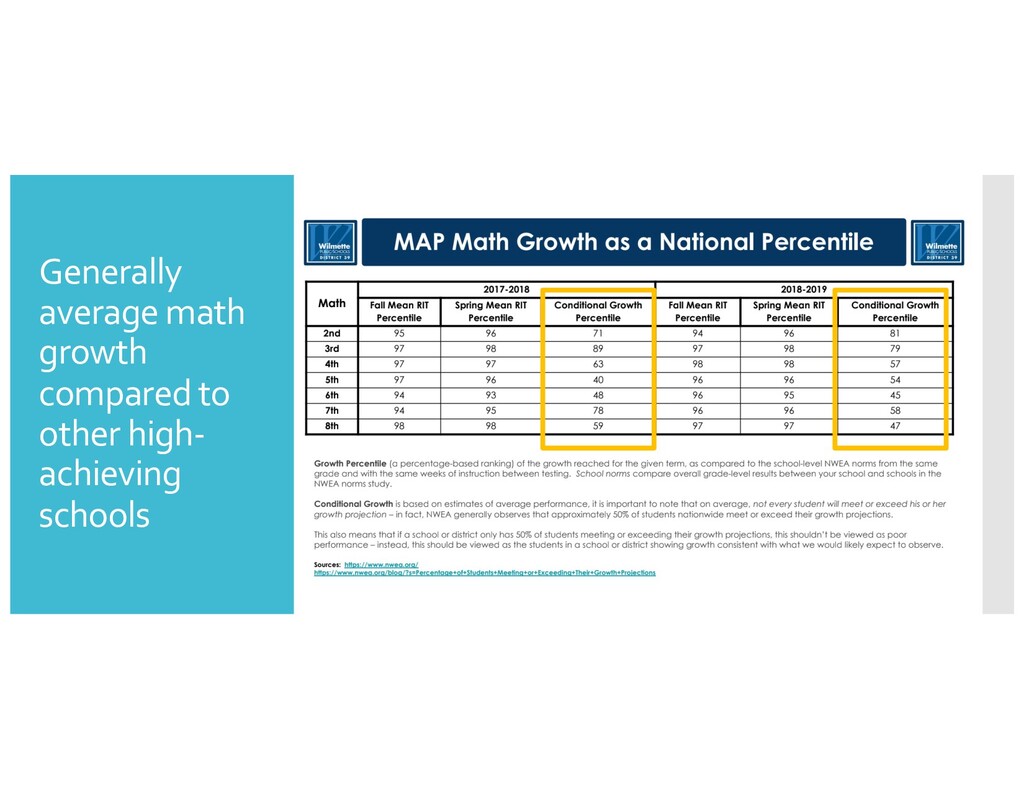
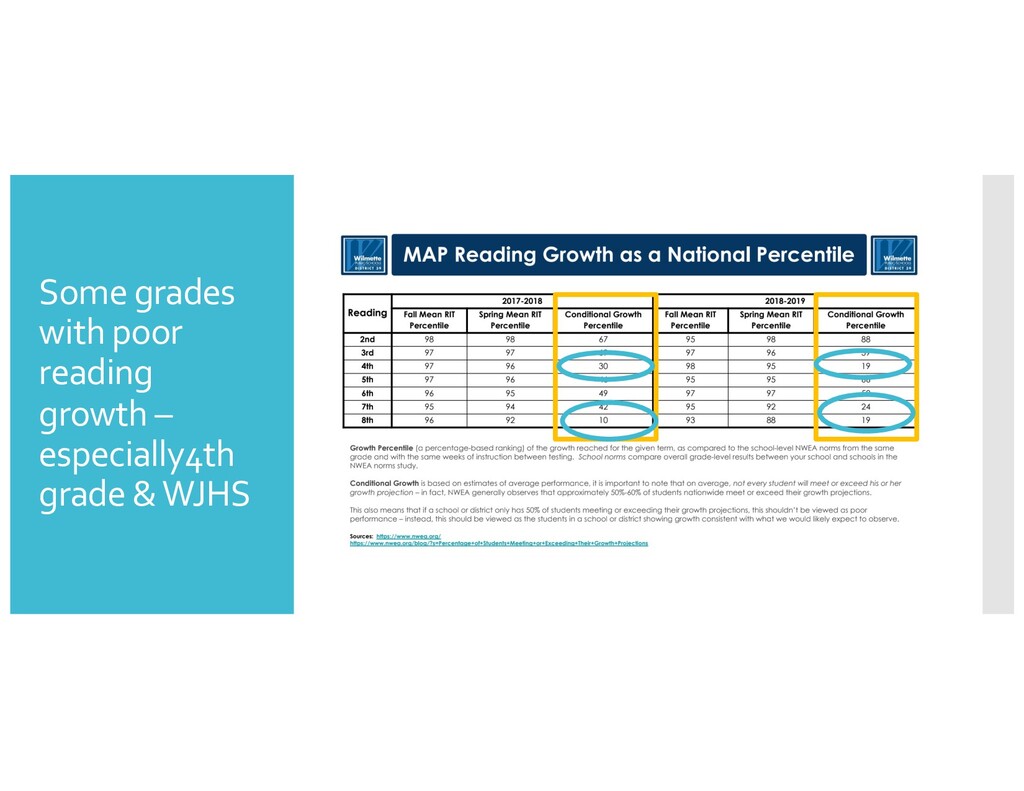
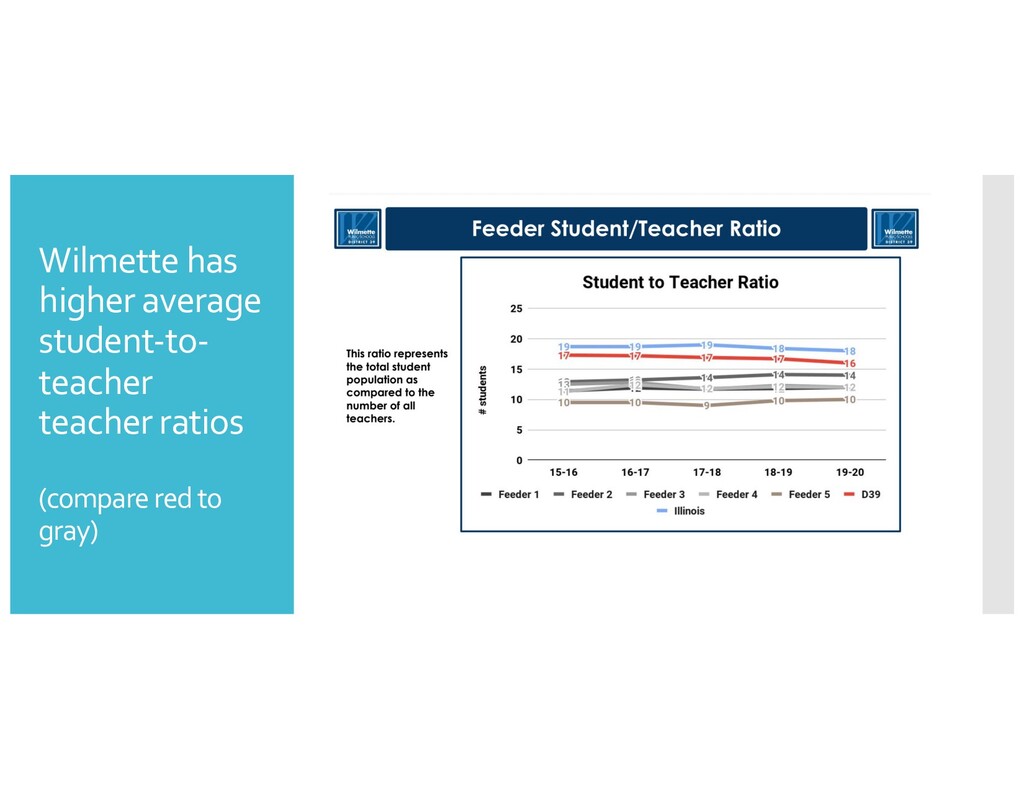
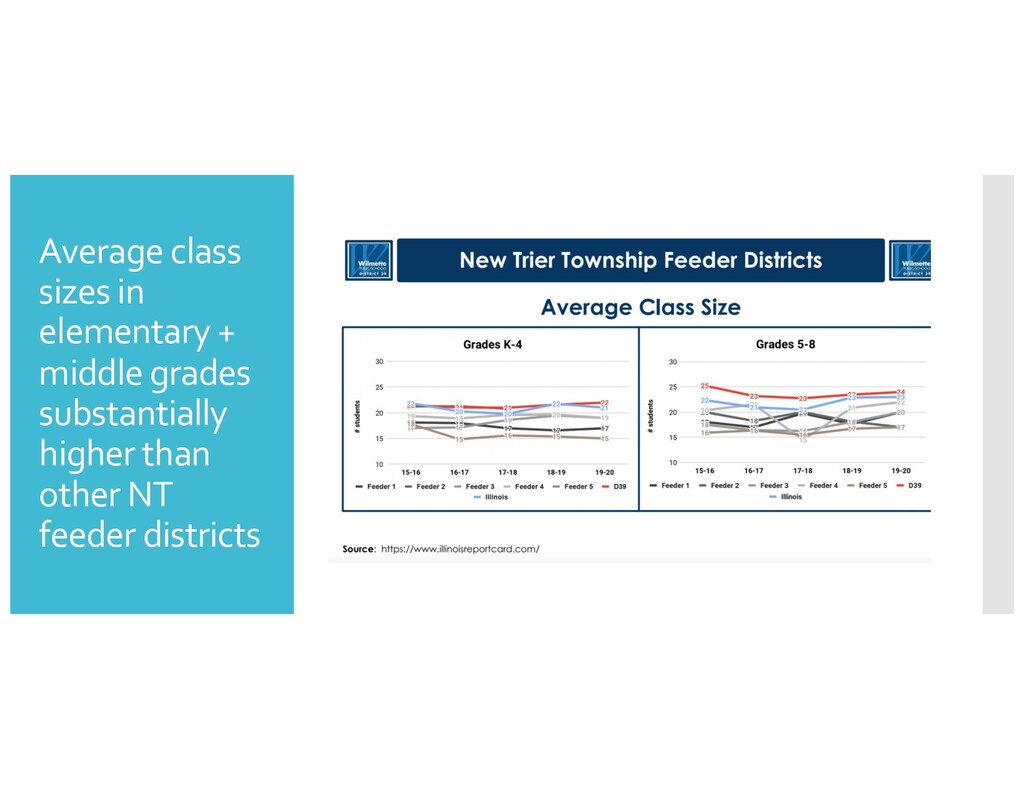
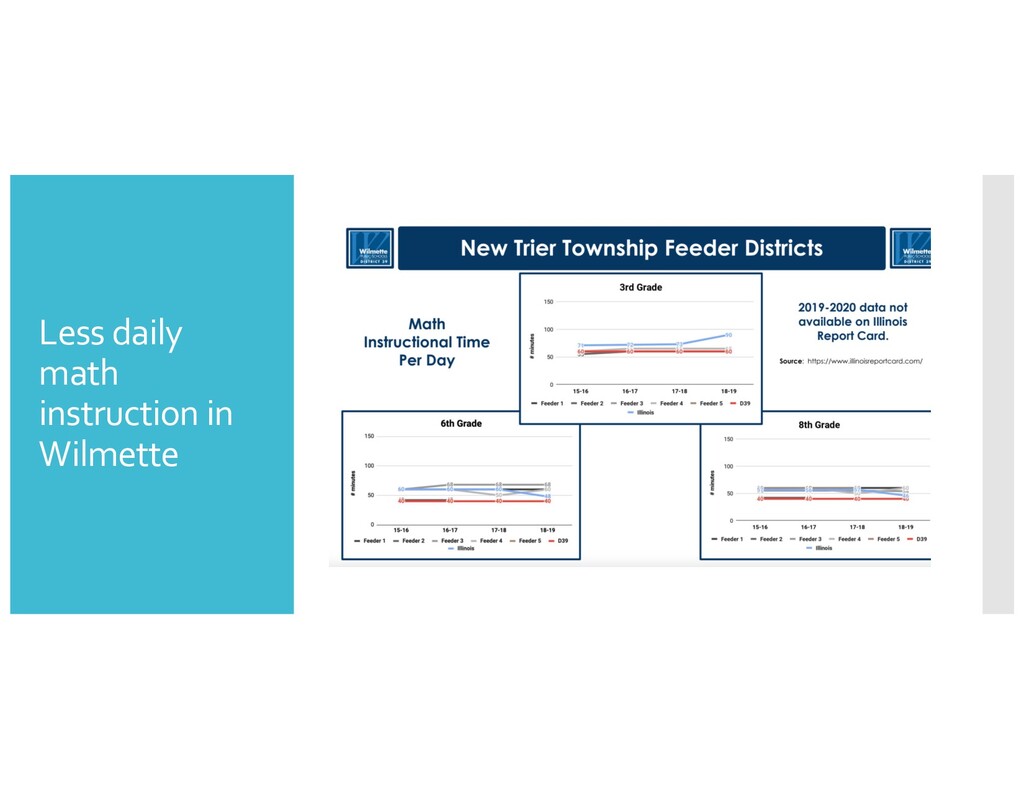
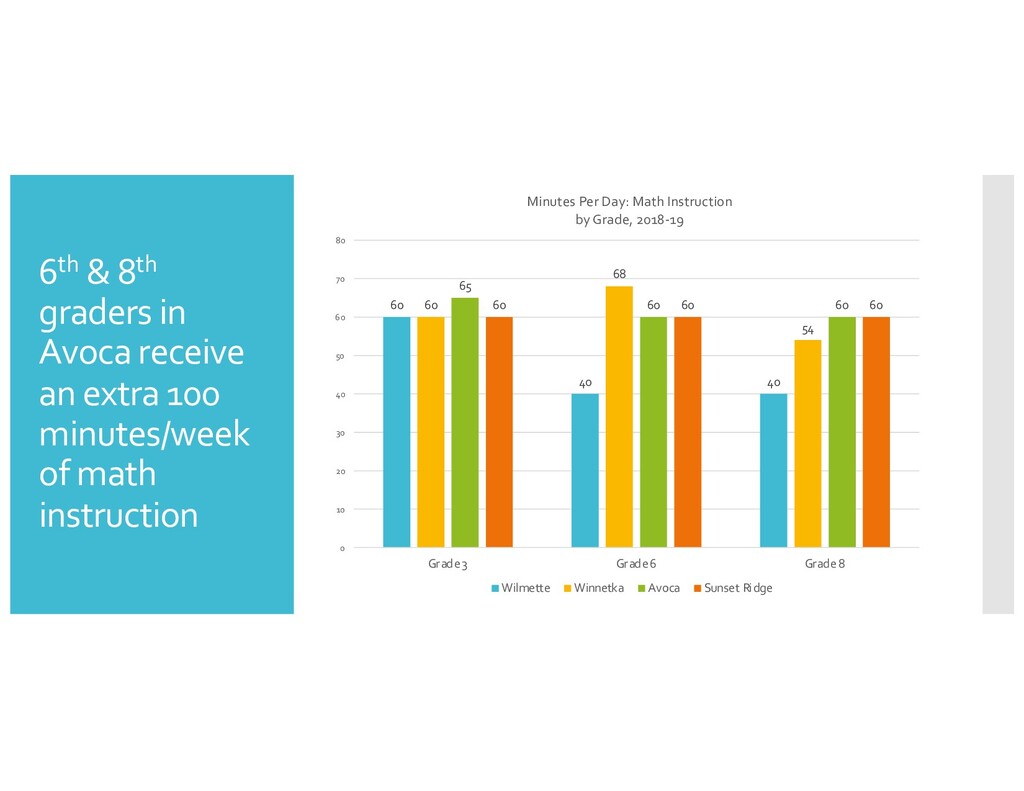
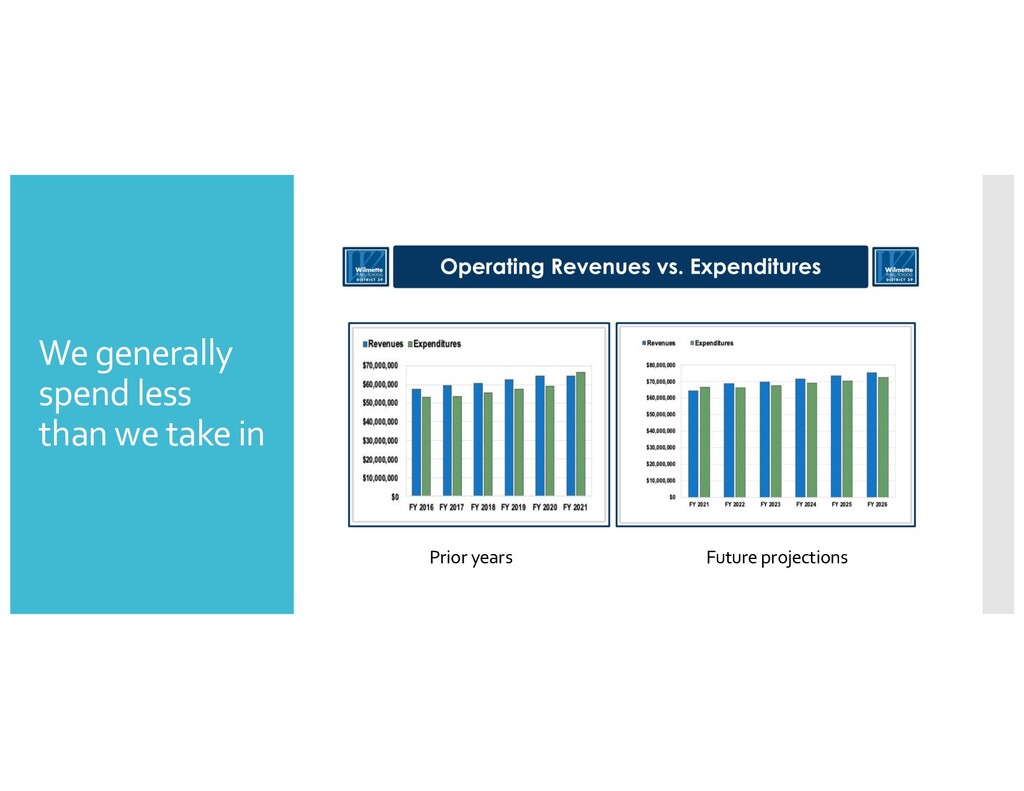
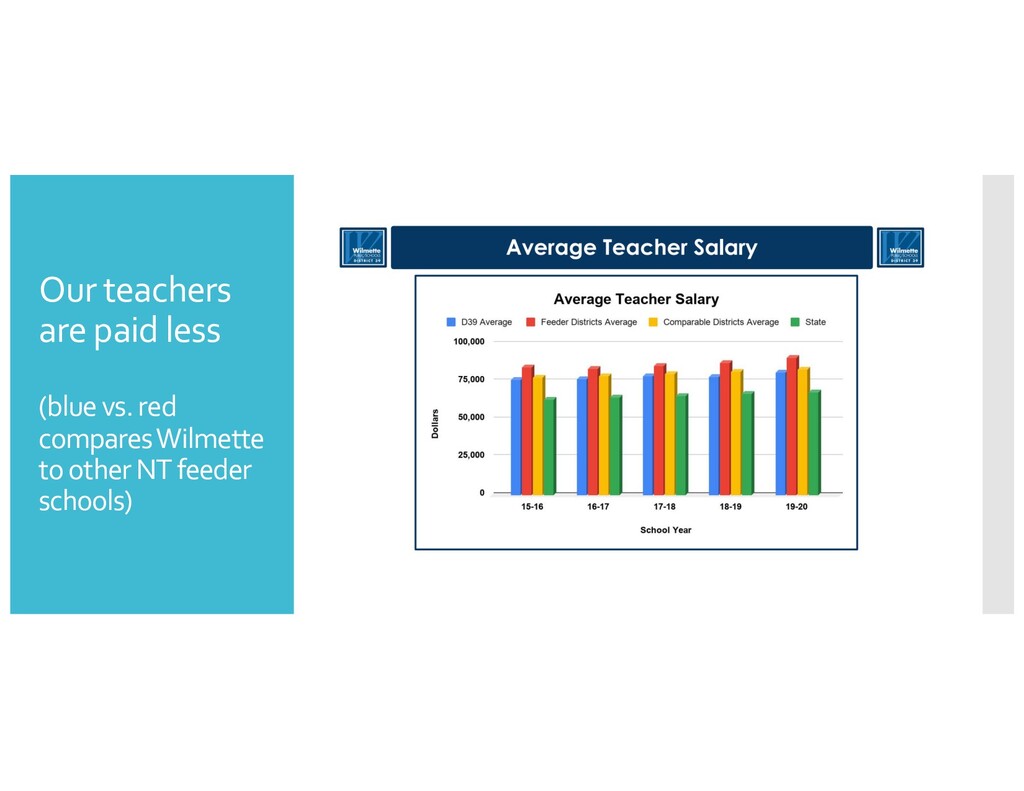
Proficiency rates have dropped sharply, across the board (on state PARCC/IAR tests) Other New Trier feeder schools have not had similar drops Growth rates average to poor compared to other high-achieving schools (MAP tests) Our students are getting fewer instructional inputs We have larger class sizes (higher student-teacher ratios) We spend less time on math + ELA instruction than other NT feeder schools We spend less money than other NT feeder districts We spend much less than our revenues Our teachers paid less and are absent more District’s full 83 page slide show available here: https://drive.google.com/file/d/10gCc3j4CQ9frvYGbsqyiCp27SGP7 AyZw/view
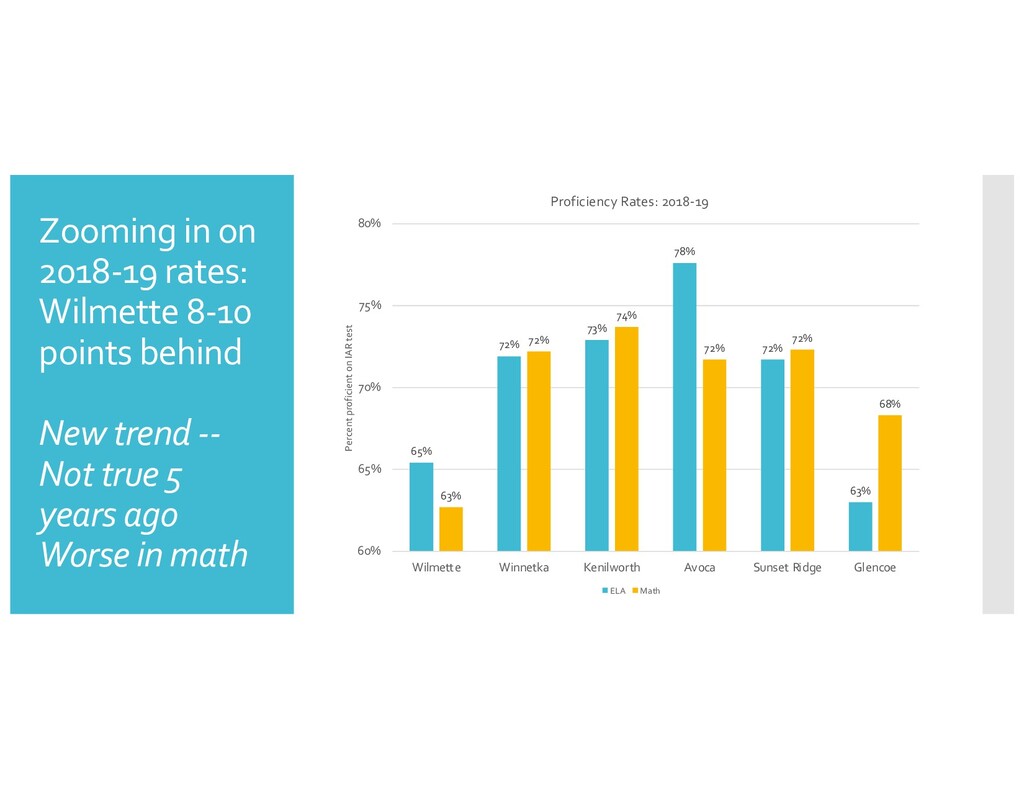
trend -- Not true 5 years ago Worse in math 65% 72% 73% 78% 72% 63% 63% 72% 74% 72% 72% 68% 60% 65% 70% 75% 80% Wilmette Winnetka Kenilworth Avoca Sunset Ridge Glencoe Percent proficient on IAR test Proficiency Rates: 2018-19 ELA Math
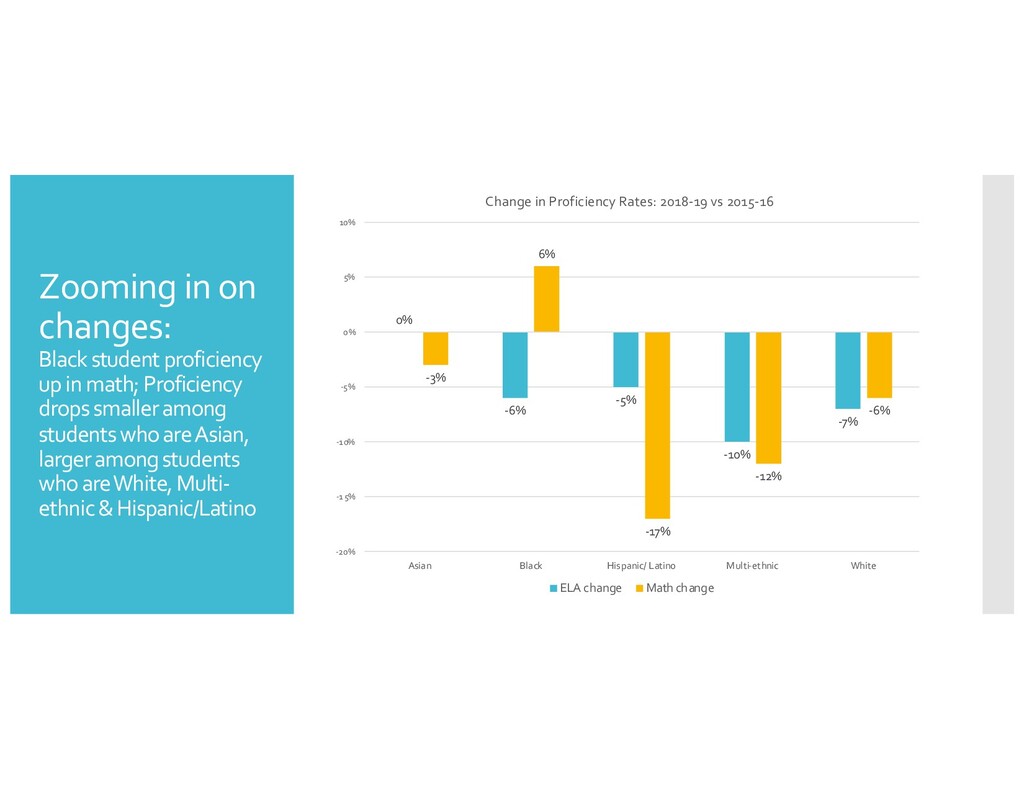
Proficiency drops smaller among students who are Asian, larger among students who are White, Multi- ethnic & Hispanic/Latino 0% -6% -5% -10% -7% -3% 6% -17% -12% -6% -20% -15% -10% -5% 0% 5% 10% Asian Black Hispanic/ Latino Multi-ethnic White Change in Proficiency Rates: 2018-19 vs 2015-16 ELA change Math change
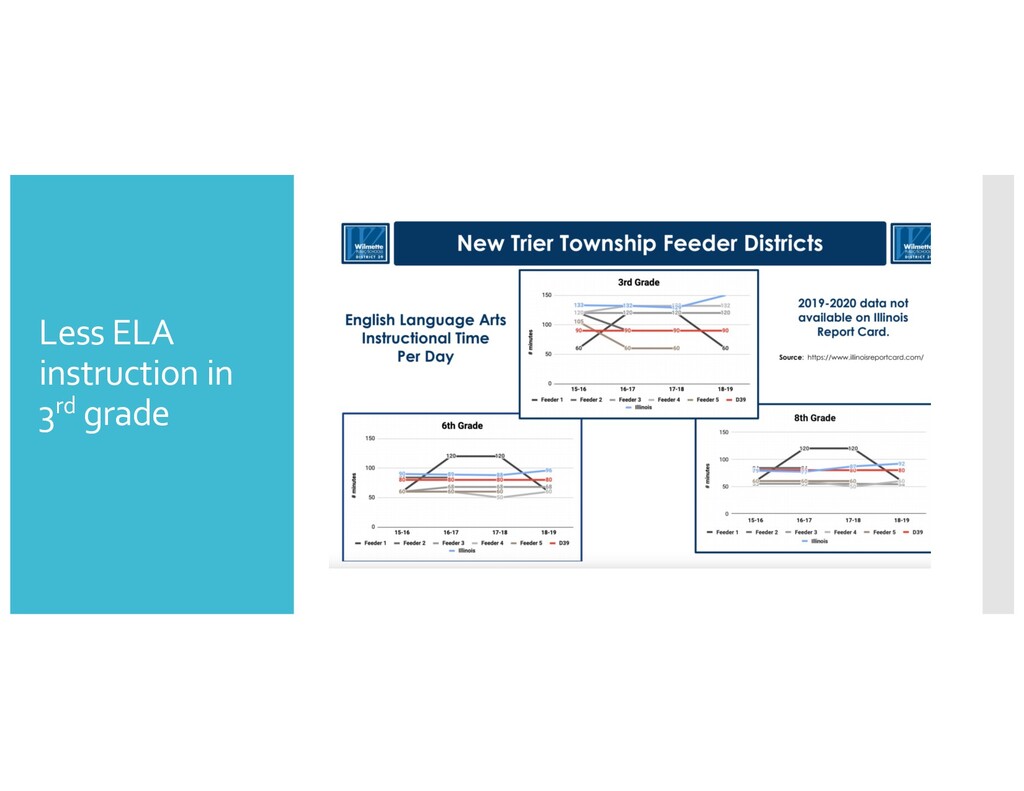
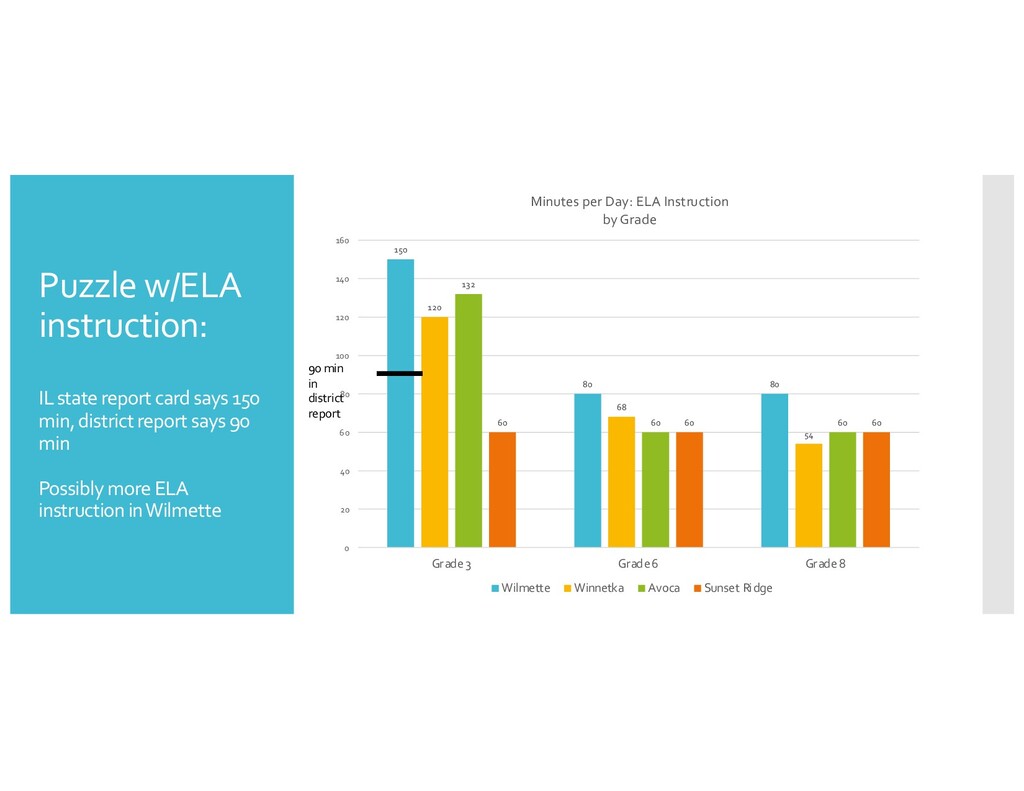
district report says 90 min Possibly more ELA instruction in Wilmette 150 80 80 120 68 54 132 60 60 60 60 60 0 20 40 60 80 100 120 140 160 Grade 3 Grade 6 Grade 8 Minutes per Day: ELA Instruction by Grade Wilmette Winnetka Avoca Sunset Ridge 90 min in district report
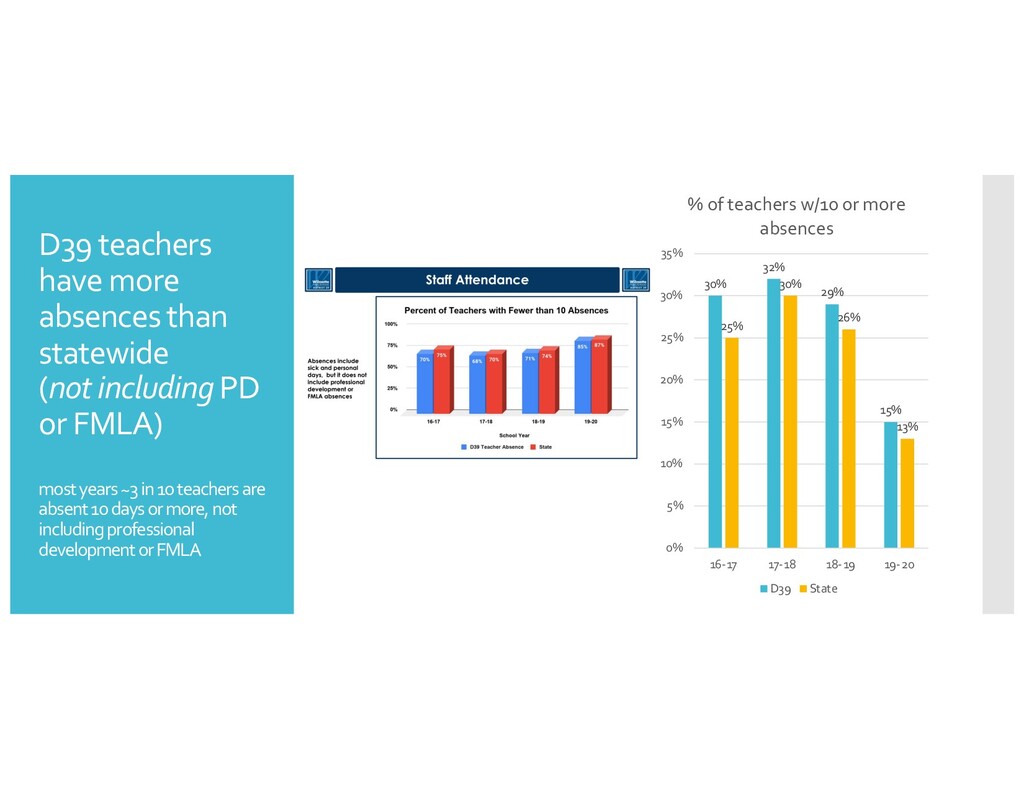
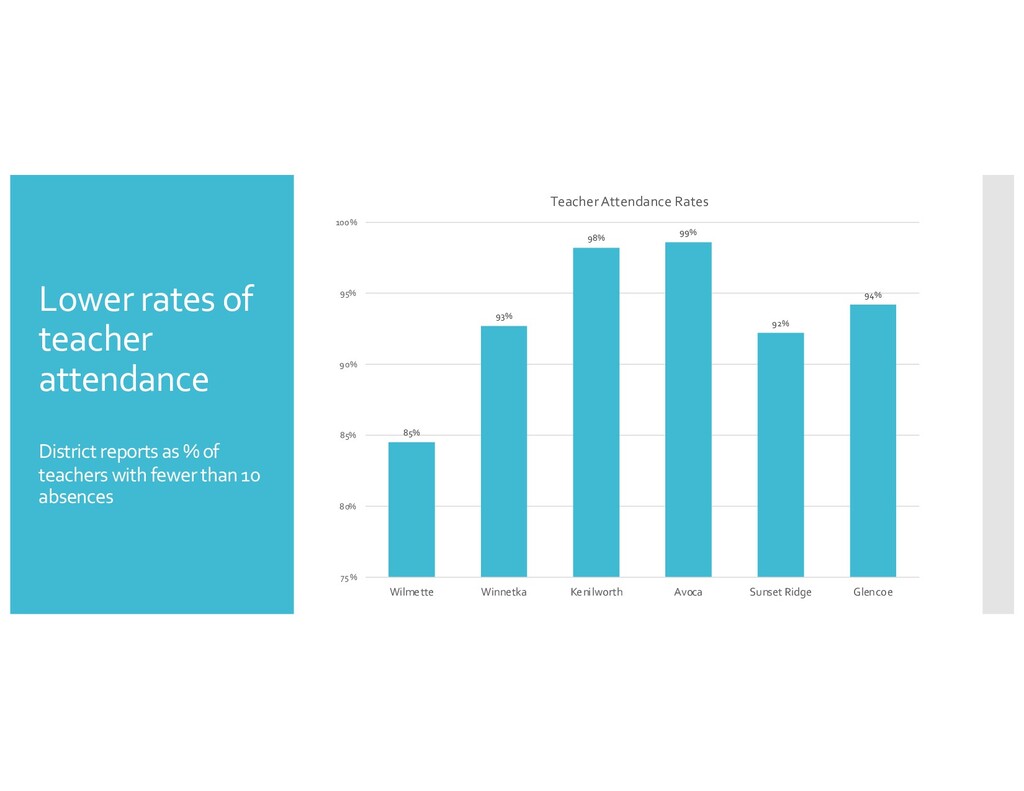
or FMLA) most years ~3 in 10 teachers are absent 10 days or more, not including professional development or FMLA 30% 32% 29% 15% 25% 30% 26% 13% 0% 5% 10% 15% 20% 25% 30% 35% 16-17 17-18 18-19 19-20 % of teachers w/10 or more absences D39 State