Upgrade to Pro — share decks privately, control downloads, hide ads and more …

Concerns about Wilmette Schools (February 2020)

Concerns about Wilmette Schools (February 2020)

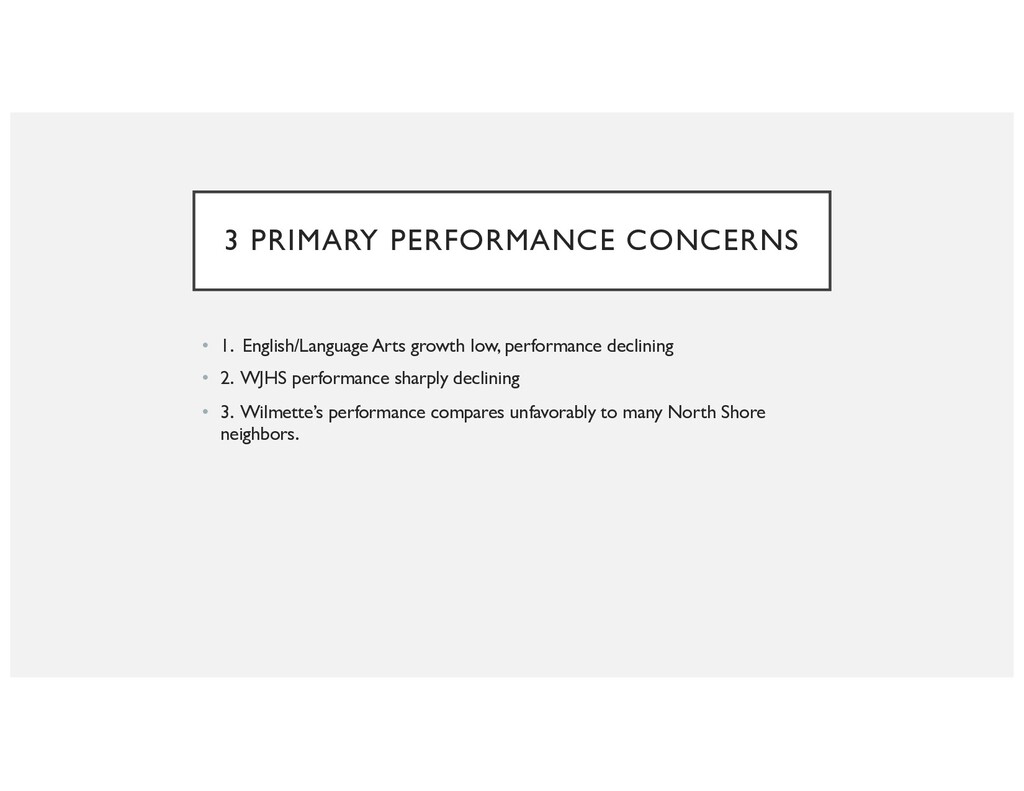
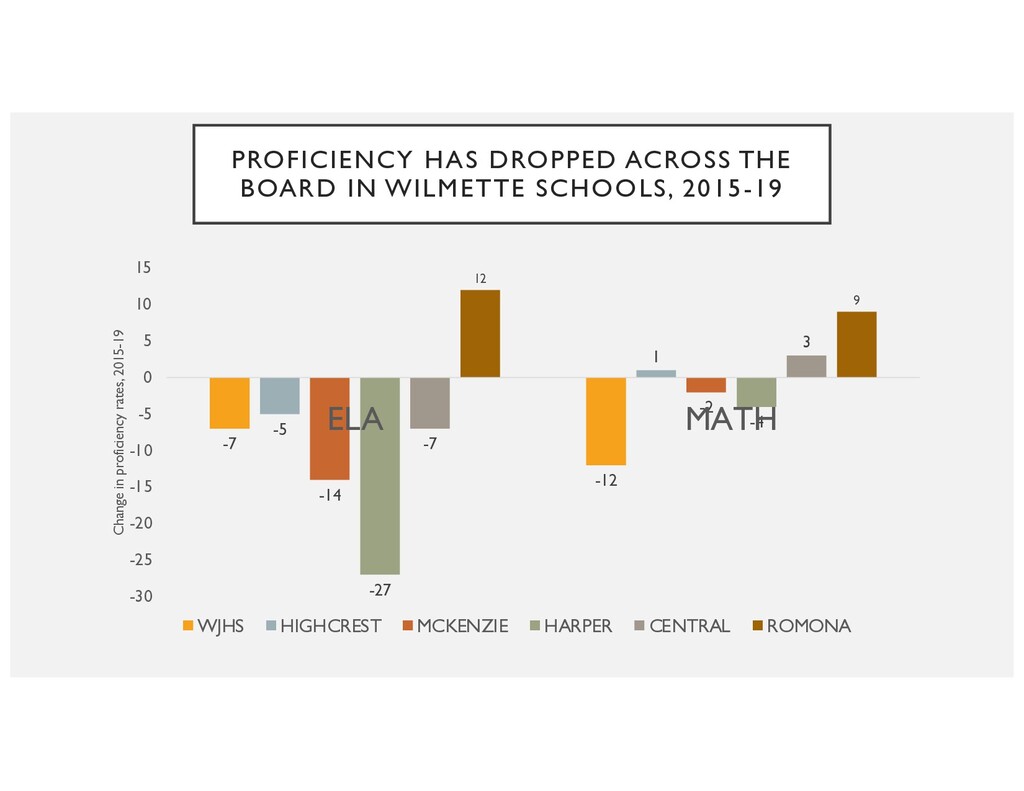
Prior to COVID-19, there were 3 primary performance concerns in Wilmette Public Schools.
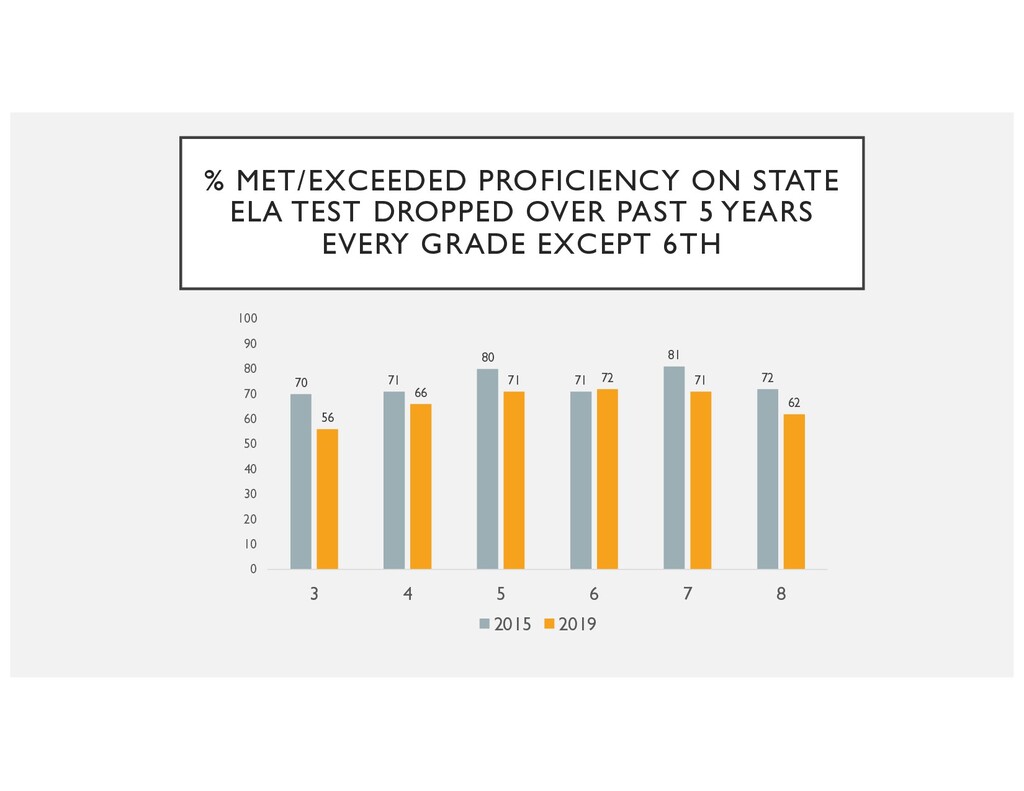
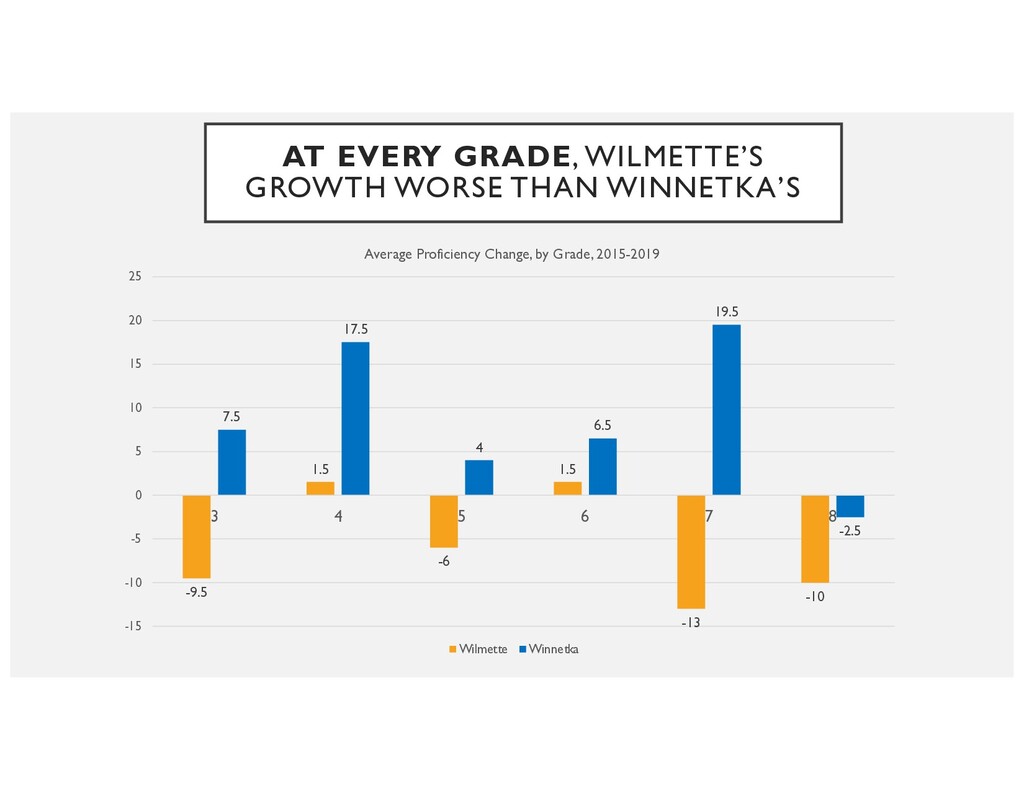
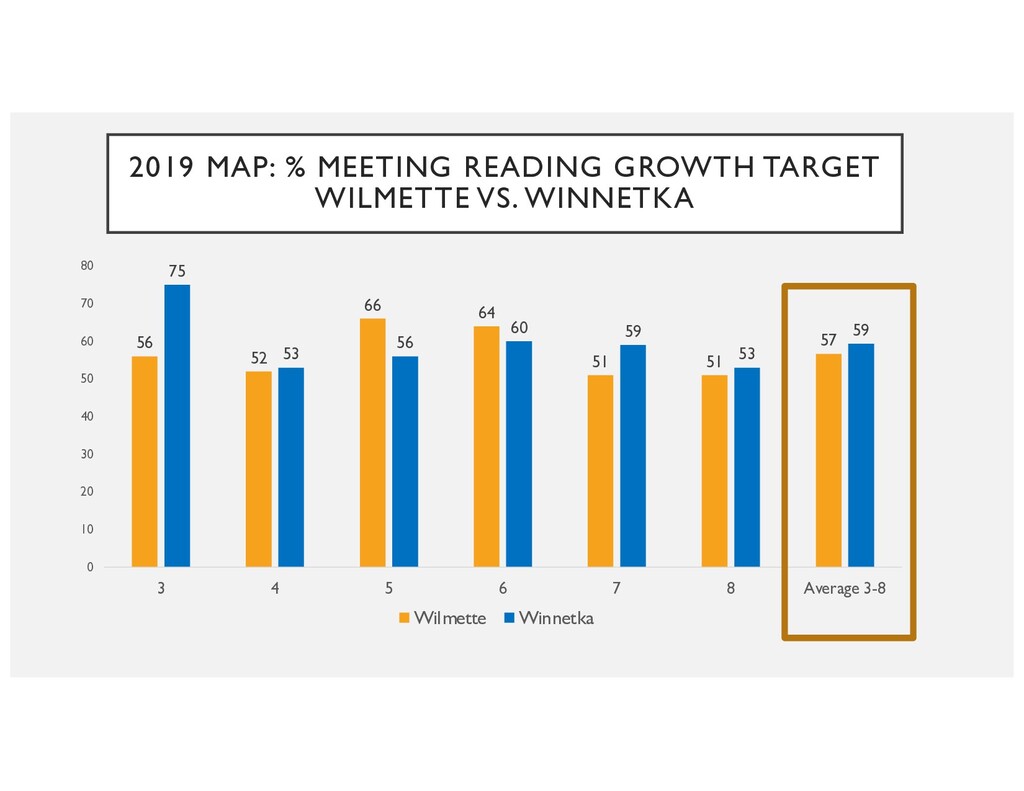
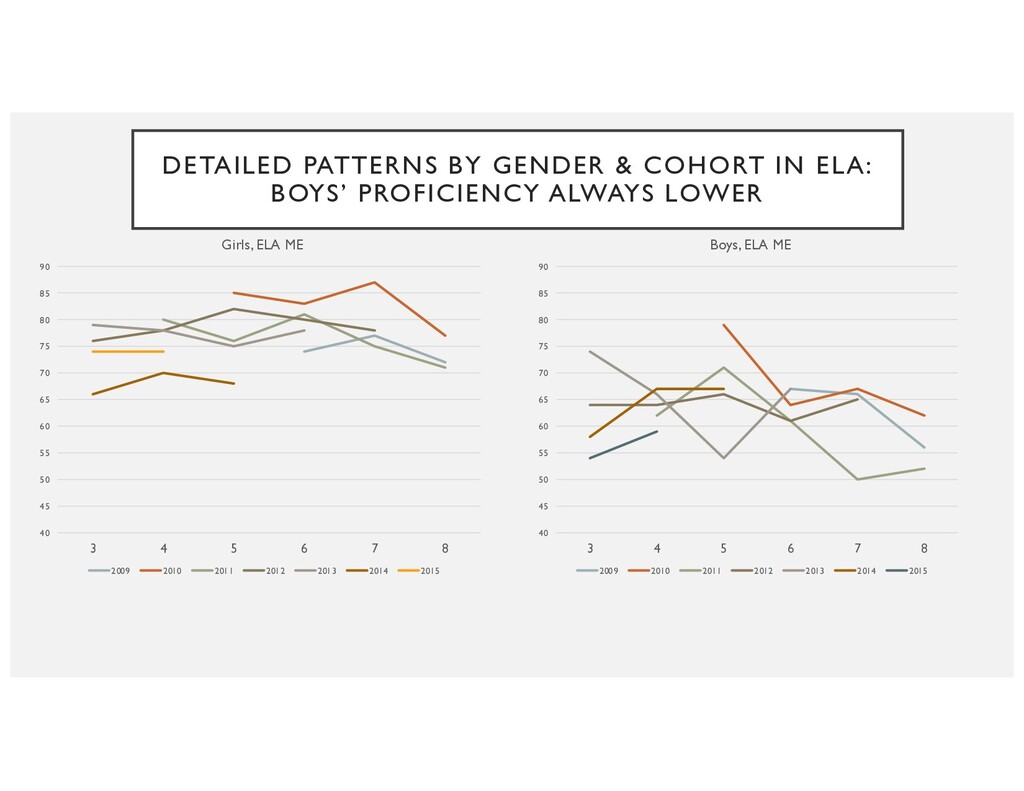
1. English/Language Arts growth rates were low, with performance declining.
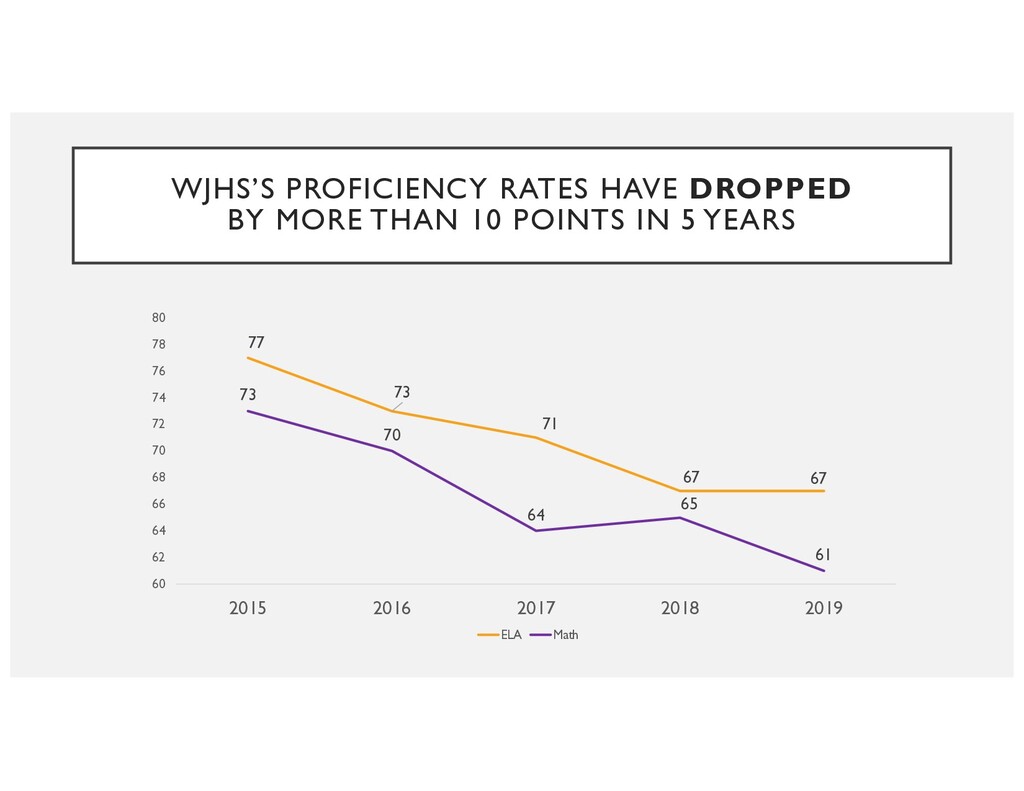
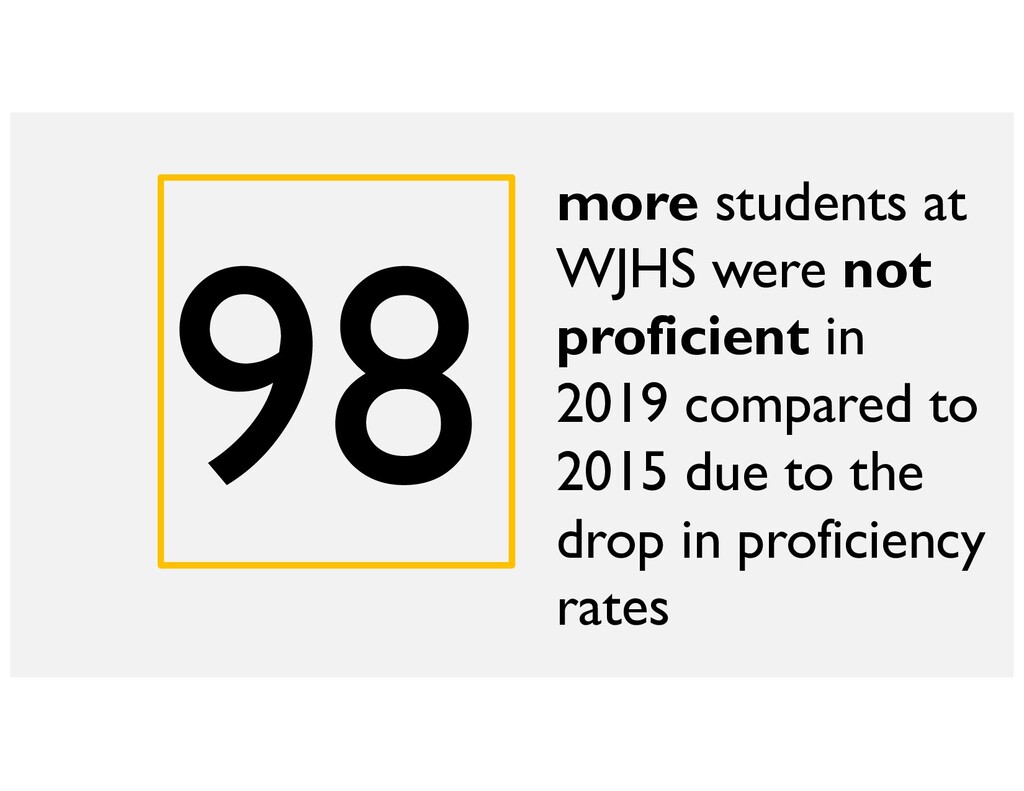
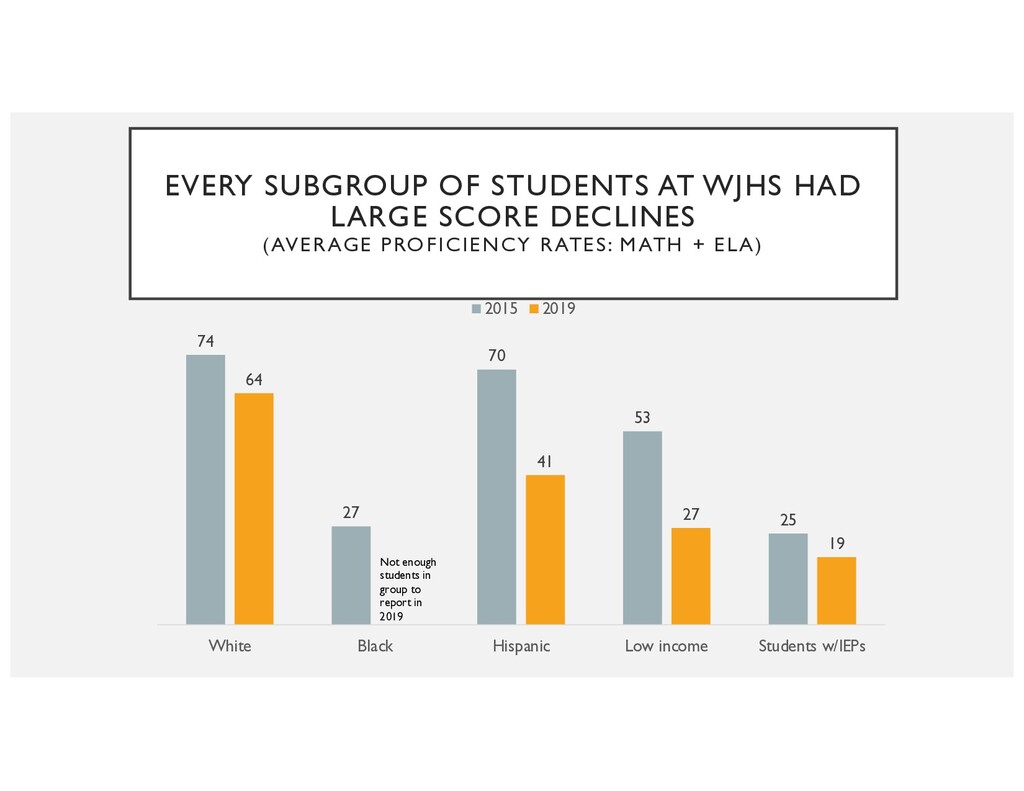
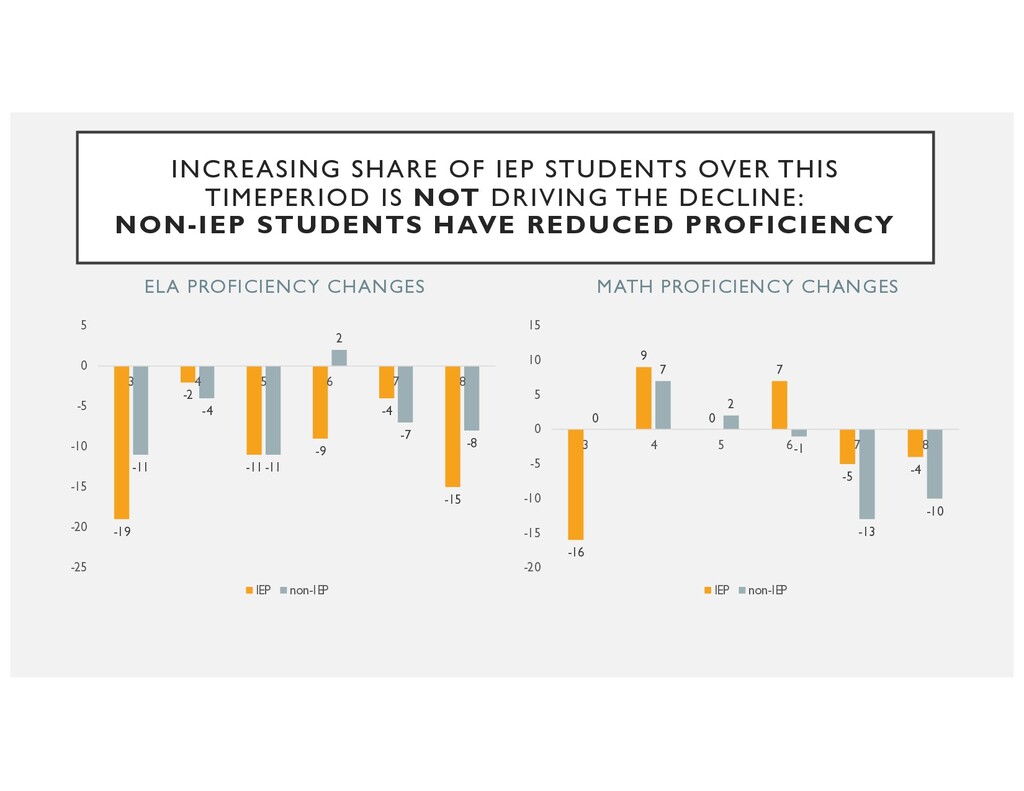
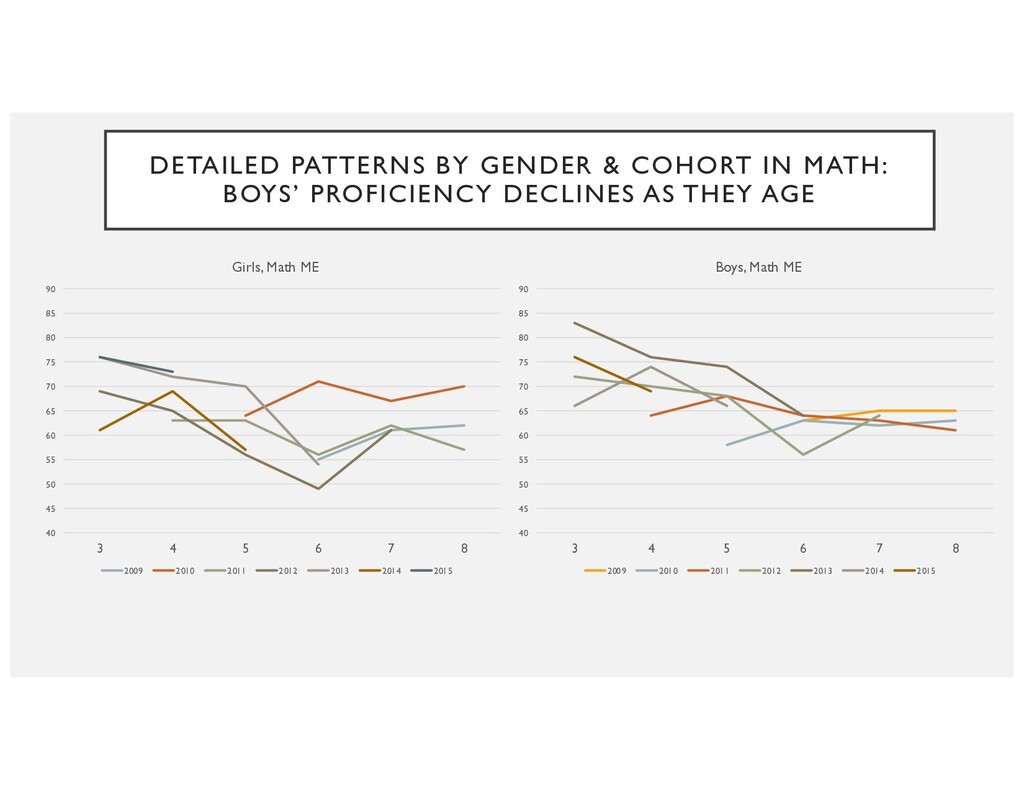
2. Performance was sharply declining in the Junior High.
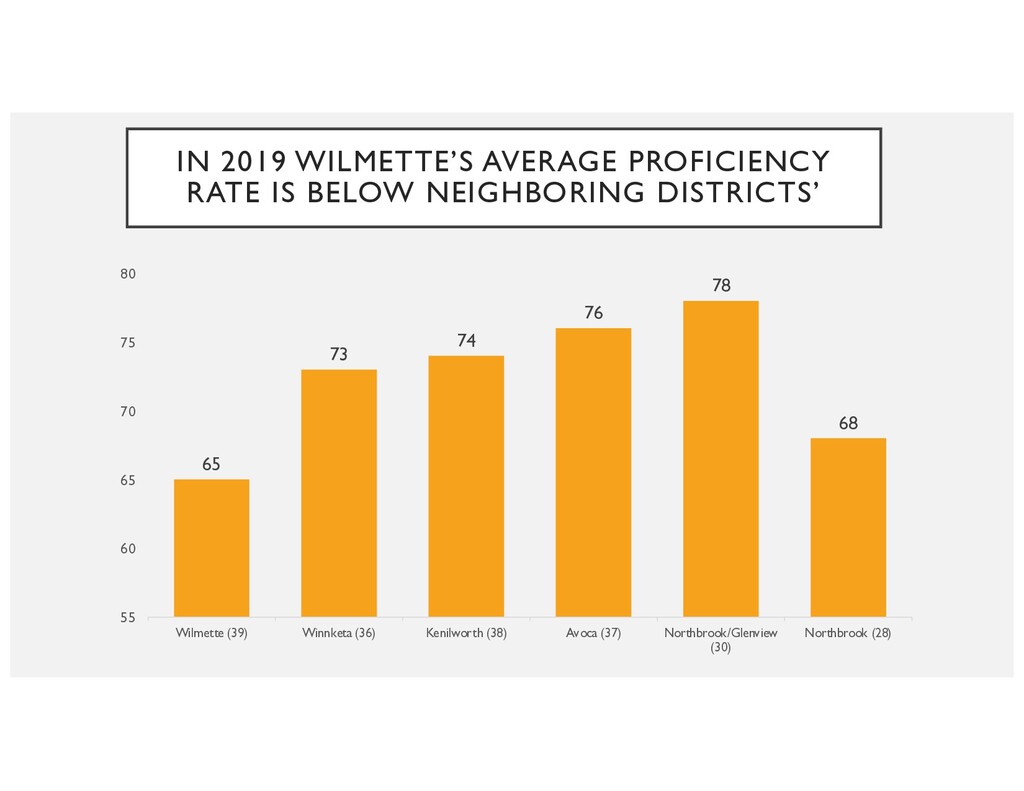
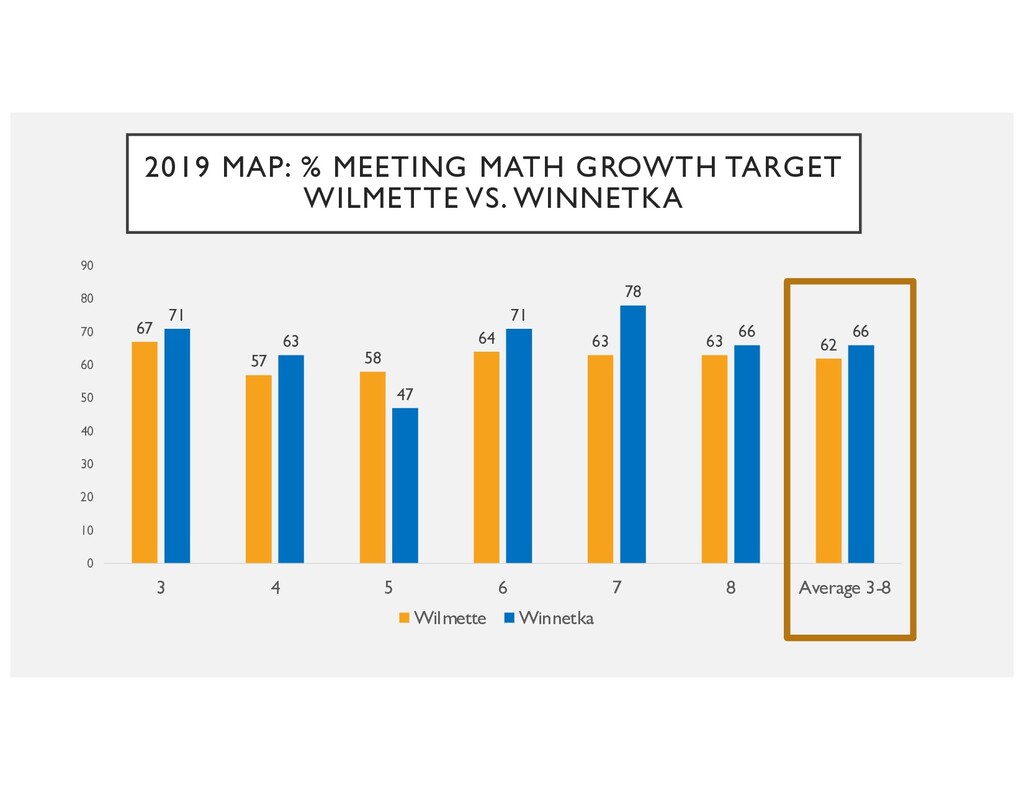
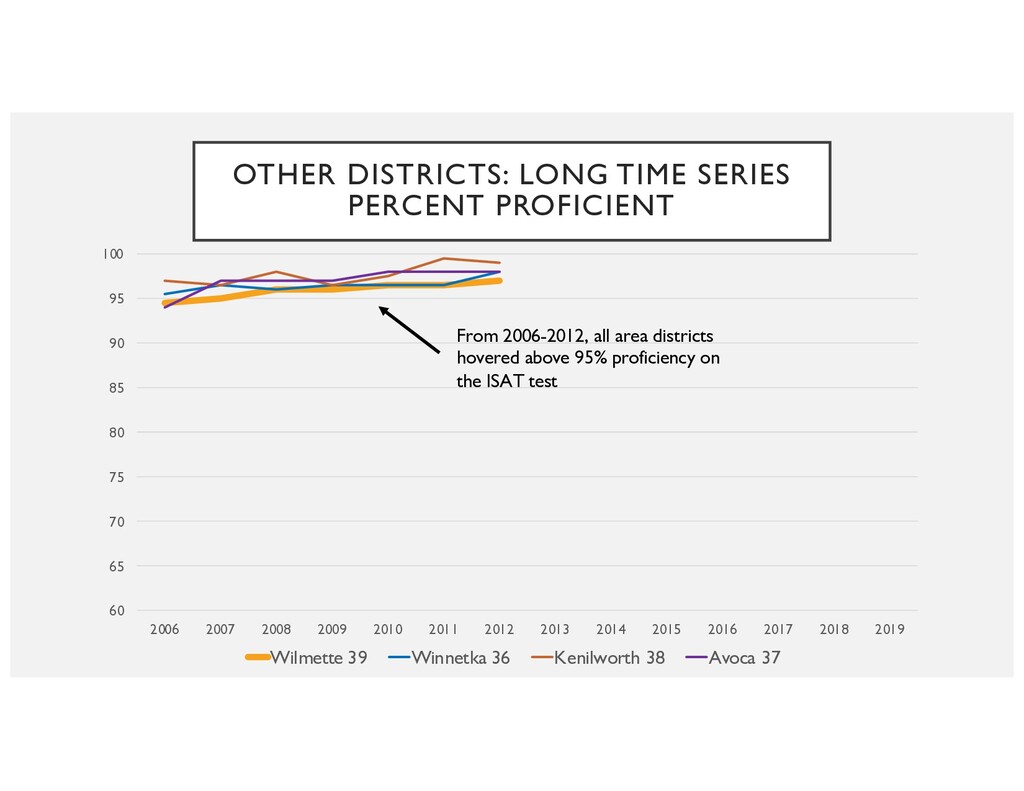
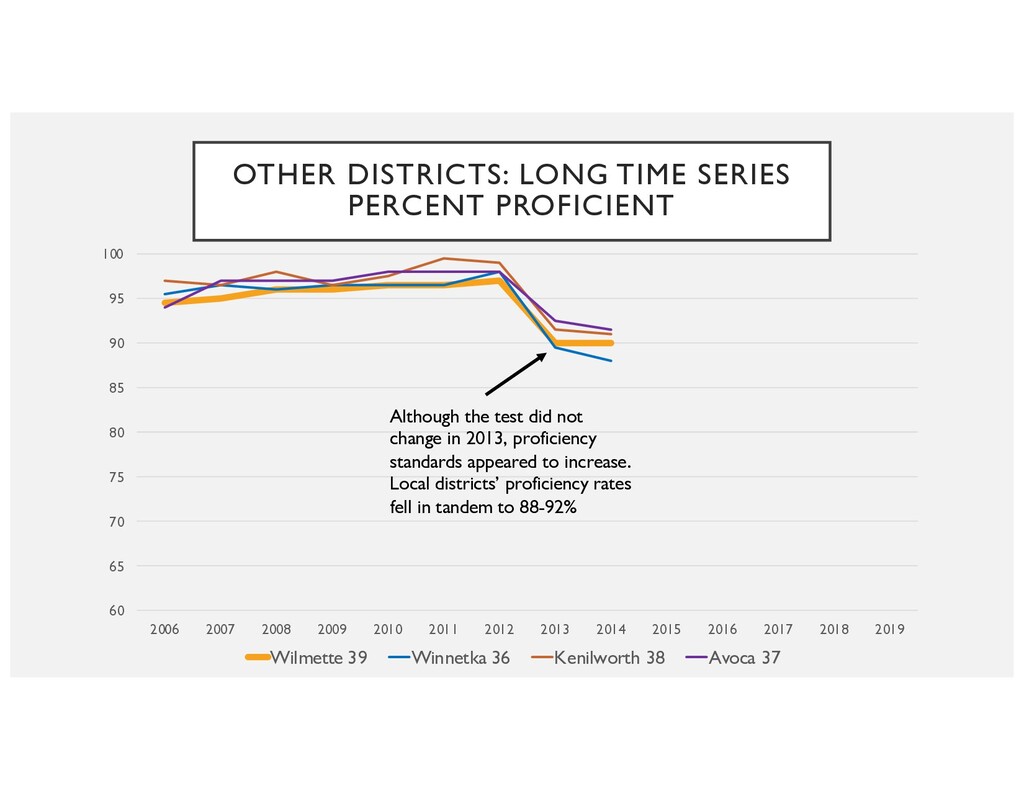
3. Wilmette's schools were performing unfavorably compared to other North Shore districts.

More Decks by Wilmette Schools Project

Other Decks in Education

Transcript

  1. 3 PRIMARY PERFORMANCE CONCERNS • 1. English/Language Arts growth low,

    performance declining • 2. WJHS performance sharply declining • 3. Wilmette’s performance compares unfavorably to many North Shore neighbors.
  2. 1 IN 4 STUDENTS HAD NO GROWTH LAST YEAR 69

    56 52 66 64 51 51 0 10 20 30 40 50 60 70 80 90 100 2 3 4 5 6 7 8 PERCENT MEETING MAP GROWTH TARGET IN READING, 2018-19 READING GROWTH ACROSS DISTRICT LOW SHARE MEETING GROWTH TARGETS LOW ESPECIALLY IN GRADES 3-4 AND 7-8
  3. % MET/EXCEEDED PROFICIENCY ON STATE ELA TEST DROPPED OVER PAST

    5 YEARS EVERY GRADE EXCEPT 6TH 70 71 80 71 81 72 56 66 71 72 71 62 0 10 20 30 40 50 60 70 80 90 100 3 4 5 6 7 8 2015 2019
  4. % MET/EXCEEDED PROFICIENCY ON STATE ELA TEST DROPPED OVER PAST

    5 YEARS AT ALL SCHOOLS EXCEPT ROMONA 70 75 60 74 75 77 43 61 72 67 70 67 0 10 20 30 40 50 60 70 80 90 100 Harper McKenzie Romona Central Highcrest WJHS 2015 2019
  5. PROFICIENCY HAS DROPPED ACROSS THE BOARD IN WILMETTE SCHOOLS, 2015-19

    -7 -12 -5 1 -14 -2 -27 -4 -7 3 12 9 -30 -25 -20 -15 -10 -5 0 5 10 15 ELA MATH Change in proficiency rates, 2015-19 WJHS HIGHCREST MCKENZIE HARPER CENTRAL ROMONA
  6. WJHS’S PROFICIENCY RATES HAVE DROPPED BY MORE THAN 10 POINTS

    IN 5 YEARS 77 73 71 67 67 73 70 64 65 61 60 62 64 66 68 70 72 74 76 78 80 2015 2016 2017 2018 2019 ELA Math
  7. 98 more students at WJHS were not proficient in 2019

    compared to 2015 due to the drop in proficiency rates
  8. EVERY SUBGROUP OF STUDENTS AT WJHS HAD LARGE SCORE DECLINES

    (AVERAGE PROFICIENCY RATES: MATH + ELA) 74 27 70 53 25 64 41 27 19 White Black Hispanic Low income Students w/IEPs 2015 2019 Not enough students in group to report in 2019
  9. FEWER WJHS STUDENTS MEET GROWTH TARGETS 61 63 52 50

    52 54 56 58 60 62 64 66 68 70 % meet growth Elementaries (average) Highcrest WJHS 38 38 47 30 32 34 36 38 40 42 44 46 48 50 Low growth Elementaries (average) Highcrest WJHS MORE WJHS STUDENTS ARE CATEGORIZED AS “LOW GROWTH” WJHS SHOWS LOW GROWTH ON MAP READING TEST TOO Average 2018 + 2019
  10. IN 2019 WILMETTE’S AVERAGE PROFICIENCY RATE IS BELOW NEIGHBORING DISTRICTS’

    65 73 74 76 78 68 55 60 65 70 75 80 Wilmette (39) Winnketa (36) Kenilworth (38) Avoca (37) Northbrook/Glenview (30) Northbrook (28)
  11. AT EVERY GRADE, WILMETTE’S GROWTH WORSE THAN WINNETKA’S -9.5 1.5

    -6 1.5 -13 -10 7.5 17.5 4 6.5 19.5 -2.5 -15 -10 -5 0 5 10 15 20 25 3 4 5 6 7 8 Average Proficiency Change, by Grade, 2015-2019 Wilmette Winnetka
  12. 2019 MAP: % MEETING MATH GROWTH TARGET WILMETTE VS. WINNETKA

    67 57 58 64 63 63 62 71 63 47 71 78 66 66 0 10 20 30 40 50 60 70 80 90 3 4 5 6 7 8 Average 3-8 Wilmette Winnetka
  13. 2019 MAP: % MEETING READING GROWTH TARGET WILMETTE VS. WINNETKA

    56 52 66 64 51 51 57 75 53 56 60 59 53 59 0 10 20 30 40 50 60 70 80 3 4 5 6 7 8 Average 3-8 Wilmette Winnetka
  14. WHAT CAN PARENTS DO? Contact the school board and tell

    them you are concerned! Emails are here -> http://wilmette39.org/board_of_ed
  15. THESE DROPS REQUIRE URGENT ATTENTION • We love Wilmette schools!

    • Test scores are only one dimension of a school’s performance. We can and should improve scores while still maintaining excellence on non-test dimensions. This should be a key component in the strategic plan. • We likely do not need additional spending. We spend $16K per student and should be able to maintain excellence with that budget. • We have some of the best teachers in the country. • We need to make sure academic performance is actively monitored by the school board and by parents.
  16. WHY DID THIS HAPPEN? • It is hard to know

    from the outside why the declines have occurred. • Harper & McKenzie saw drops during principal turnovers. Both have strong educators in place now, so we would expect achievement to improve. • The decline at WJHS lines up with the timing of having a single principal over two campuses. Each school will have a dedicated principal next year, which may improve these trends. • The decline at WJHS also lines up with the iPads. It is not possible to say whether they have caused the decline, and research on iPads more generally is inconclusive. Highcrest also uses iPads and has not had the same decline. • The district-wide declines in ELA/Reading suggest a need to consider the curriculum, teacher support, and other factors that may have changed in recent years.
  17. HOW TO INTERVENE? • Need a culture of continuous improvement

    & monitoring of achievement • Not using these scores as “gotcha’s” • School Board must make this a central concern • Parents need to be vocal about their concerns • Discuss with leadership (superintendent, principals, central office, board) • Take care not to demoralize teachers
  18. READING CURRICULUM AND SUPPORT? • Reading coaches to help teachers?

    • Like other districts • Curriculum changes? • Unclear how much based on whole word reading, increasingly shown to be ineffective • Targeted interventions? • Is current curriculum and instruction staff doing what is needed? • Harper school: do MAP scores look as bad? Have MAP tests turned around this year?
  19. OTHER DISTRICTS: LONG TIME SERIES PERCENT PROFICIENT 60 65 70

    75 80 85 90 95 100 2006 2007 2008 2009 2010 2011 2012 2013 2014 2015 2016 2017 2018 2019 Wilmette 39 Winnetka 36 Kenilworth 38 Avoca 37 From 2006-2012, all area districts hovered above 95% proficiency on the ISAT test
  20. OTHER DISTRICTS: LONG TIME SERIES PERCENT PROFICIENT 60 65 70

    75 80 85 90 95 100 2006 2007 2008 2009 2010 2011 2012 2013 2014 2015 2016 2017 2018 2019 Wilmette 39 Winnetka 36 Kenilworth 38 Avoca 37 Although the test did not change in 2013, proficiency standards appeared to increase. Local districts’ proficiency rates fell in tandem to 88-92%
  21. OTHER DISTRICTS: LONG TIME SERIES PERCENT PROFICIENT 60 65 70

    75 80 85 90 95 100 2006 2007 2008 2009 2010 2011 2012 2013 2014 2015 2016 2017 2018 2019 Wilmette 39 Winnetka 36 Kenilworth 38 Avoca 37 2015: new test (PARCC) administered Local districts dropped sharply. After the drop, other districts have improved or held steady 2015-2019. Wilmette has continued to fall sharply.
  22. ELA PROFICIENCY CHANGES -19 -2 -11 -9 -4 -15 -11

    -4 -11 2 -7 -8 -25 -20 -15 -10 -5 0 5 3 4 5 6 7 8 IEP non-IEP -16 9 0 7 -5 -4 0 7 2 -1 -13 -10 -20 -15 -10 -5 0 5 10 15 3 4 5 6 7 8 IEP non-IEP MATH PROFICIENCY CHANGES INCREASING SHARE OF IEP STUDENTS OVER THIS TIMEPERIOD IS NOT DRIVING THE DECLINE: NON-IEP STUDENTS HAVE REDUCED PROFICIENCY
  23. DETAILED PATTERNS BY GENDER & COHORT IN MATH: BOYS’ PROFICIENCY

    DECLINES AS THEY AGE 40 45 50 55 60 65 70 75 80 85 90 3 4 5 6 7 8 Girls, Math ME 2009 2010 2011 2012 2013 2014 2015 40 45 50 55 60 65 70 75 80 85 90 3 4 5 6 7 8 Boys, Math ME 2009 2010 2011 2012 2013 2014 2015
  24. DETAILED PATTERNS BY GENDER & COHORT IN ELA: BOYS’ PROFICIENCY

    ALWAYS LOWER 40 45 50 55 60 65 70 75 80 85 90 3 4 5 6 7 8 Girls, ELA ME 2009 2010 2011 2012 2013 2014 2015 40 45 50 55 60 65 70 75 80 85 90 3 4 5 6 7 8 Boys, ELA ME 2009 2010 2011 2012 2013 2014 2015