Upgrade to Pro — share decks privately, control downloads, hide ads and more …

How to Read MAP School Reports

How to Read MAP School Reports

A brief guide to interpreting MAP school reports, including understanding the school conditional growth percentile.

More Decks by Wilmette Schools Project

Other Decks in Education

Transcript

  1. # of students tested at both points # met expected

    growth (50%ile of observed growth, conditional on first score) % of students who met projected growth
  2. Each student has a growth percentile – those with 50th

    %ile or higher met expected growth Line up by growth, report middle student’s growth Median student growth 34th %ile
  3. How do you think about our growth compared to other

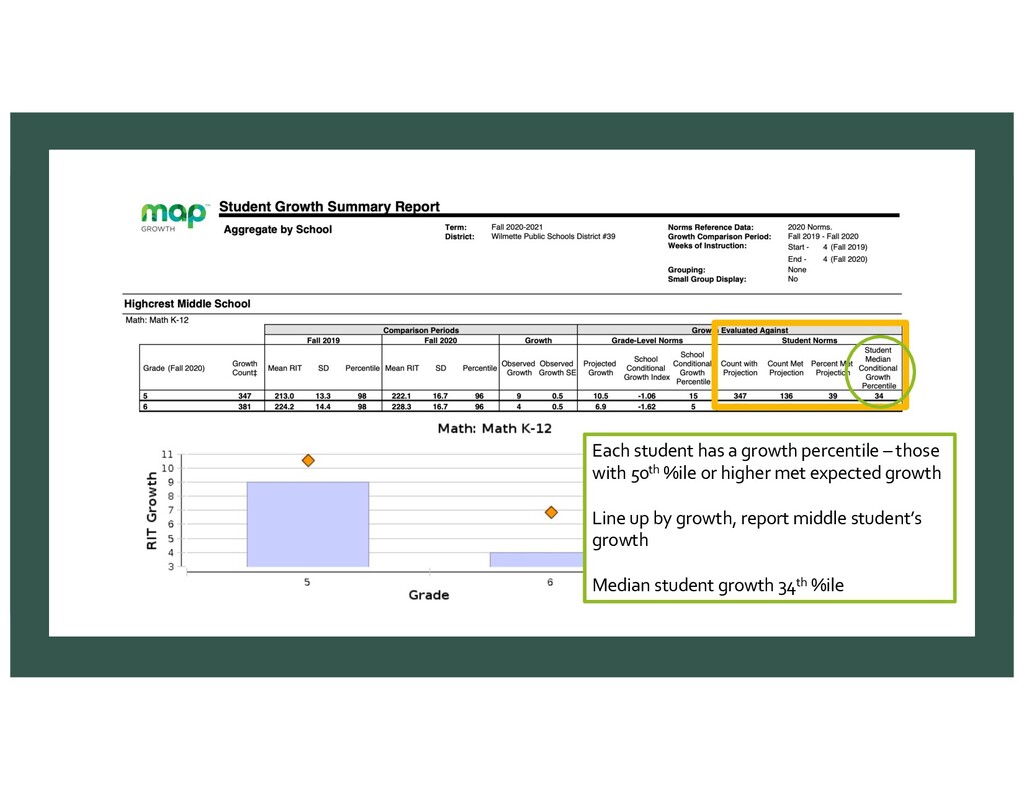
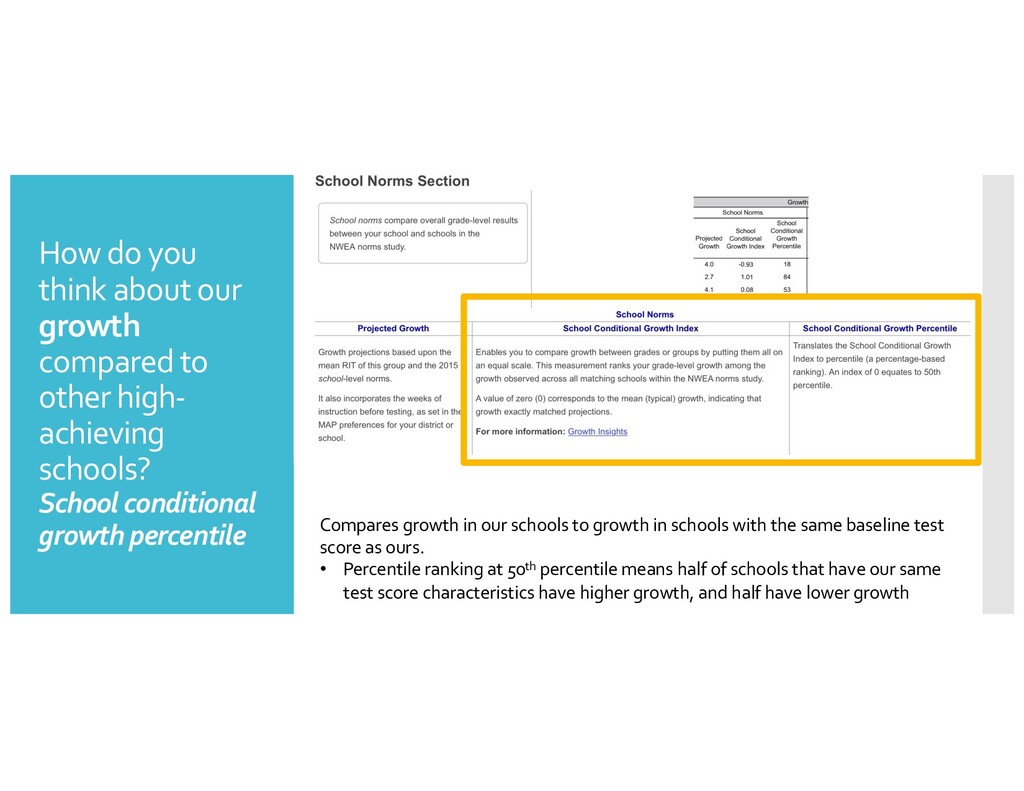
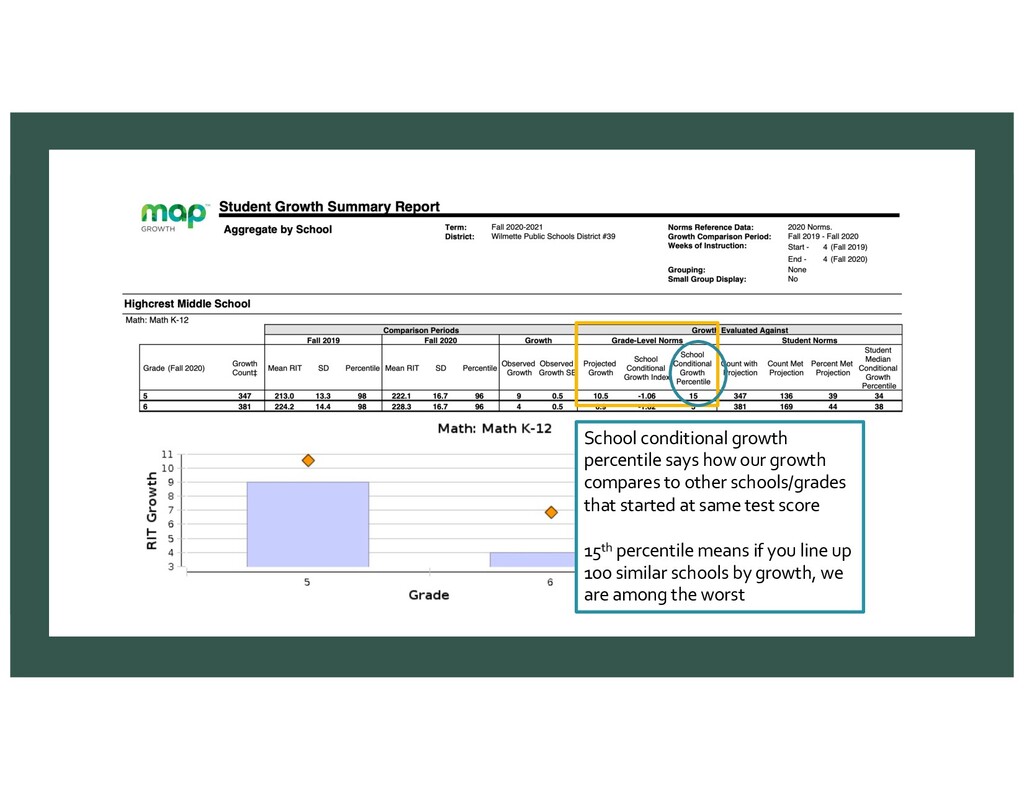
    high- achieving schools? School conditional growth percentile Compares growth in our schools to growth in schools with the same baseline test score as ours. • Percentile ranking at 50th percentile means half of schools that have our same test score characteristics have higher growth, and half have lower growth
  4. Projected growth = how much growth expected based on mean

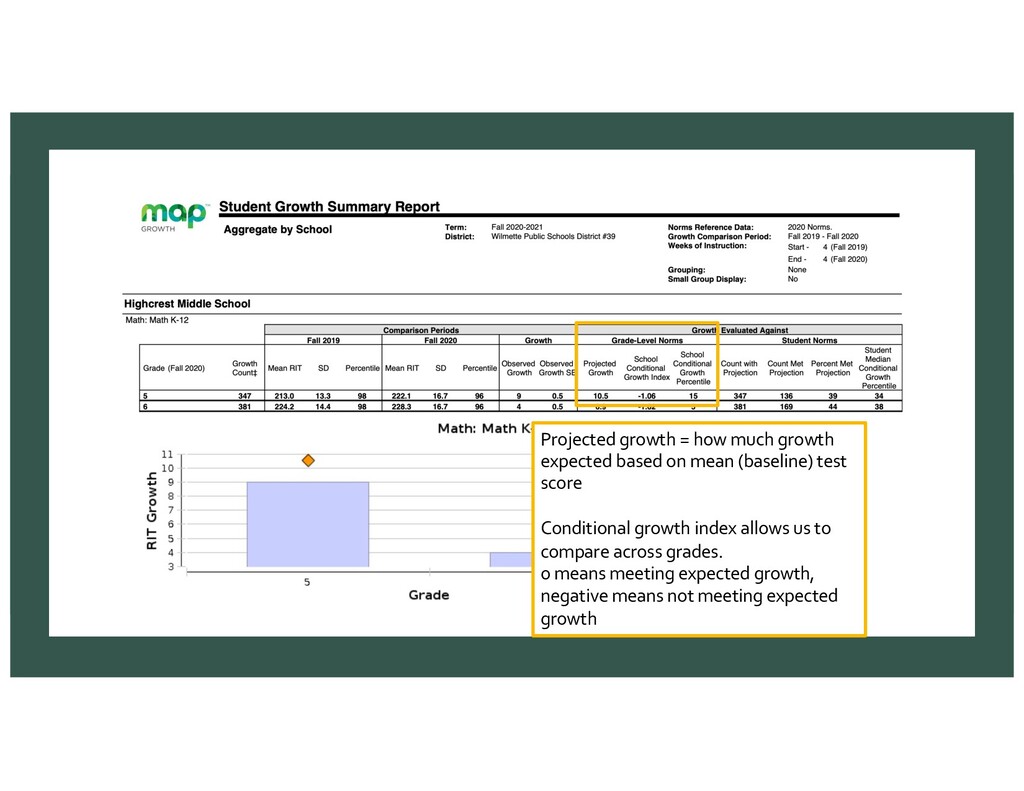
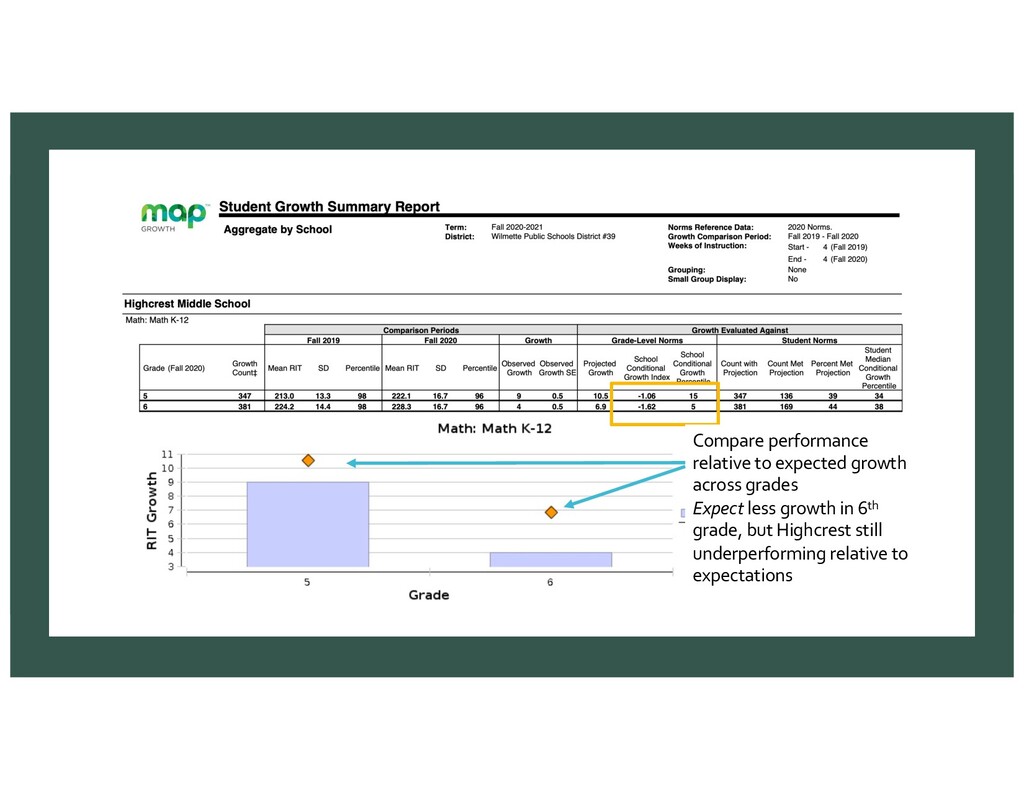
    (baseline) test score Conditional growth index allows us to compare across grades. 0 means meeting expected growth, negative means not meeting expected growth
  5. School conditional growth percentile says how our growth compares to

    other schools/grades that started at same test score 15th percentile means if you line up 100 similar schools by growth, we are among the worst
  6. Measures variation of students’ test scores around the school average

    Lower SD means students’ scores are more similar; higher means more different
  7. Compare this year’s 5th grade fall scores (orange) to last

    year’s (blue) -> current cohort slightly lower scores (98th vs. 96th percentile)
  8. Compare performance relative to expected growth across grades Expect less

    growth in 6th grade, but Highcrest still underperforming relative to expectations
  9. Getting back on track – The board & parents need

    to be monitoring school performance in a meaningful way – Data on our achievement and growth relative to similar peers should be routinely monitored and presented to the Board & parents – Given the centrality of projected vs. actual growth on the reports, it is surprising that this information has not been presented to the board & parents