Highcrest & Wilmette Junior High School MAP Scores
Evidence from MAP Scores: Are the shares of students meeting their growth targets good? How does growth in Wilmette compare to growth in other high-achieving schools?
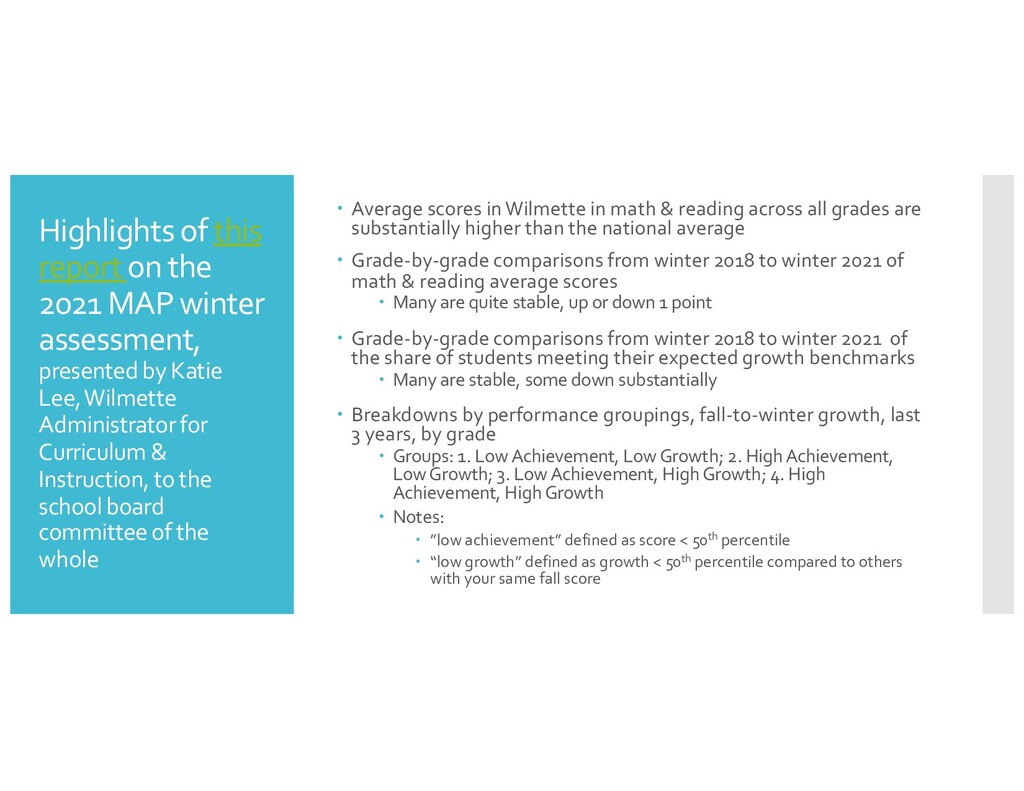
presented by Katie Lee, Wilmette Administrator for Curriculum & Instruction, to the school board committee of the whole Average scores in Wilmette in math & reading across all grades are substantially higher than the national average Grade-by-grade comparisons from winter 2018 to winter 2021 of math & reading average scores Many are quite stable, up or down 1 point Grade-by-grade comparisons from winter 2018 to winter 2021 of the share of students meeting their expected growth benchmarks Many are stable, some down substantially Breakdowns by performance groupings, fall-to-winter growth, last 3 years, by grade Groups: 1. Low Achievement, Low Growth; 2. High Achievement, Low Growth; 3. Low Achievement, High Growth; 4. High Achievement, High Growth Notes: ”low achievement” defined as score < 50th percentile “low growth” defined as growth < 50th percentile compared to others with your same fall score
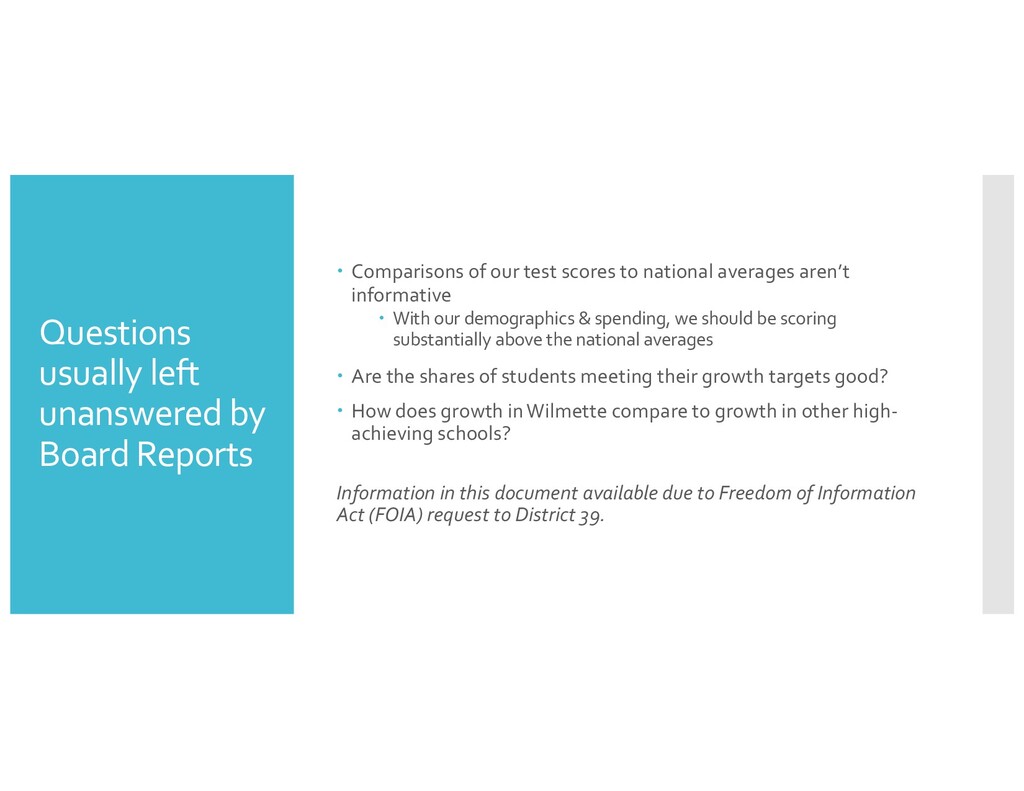
our test scores to national averages aren’t informative With our demographics & spending, we should be scoring substantially above the national averages Are the shares of students meeting their growth targets good? How does growth in Wilmette compare to growth in other high- achieving schools? Information in this document available due to Freedom of Information Act (FOIA) request to District 39.
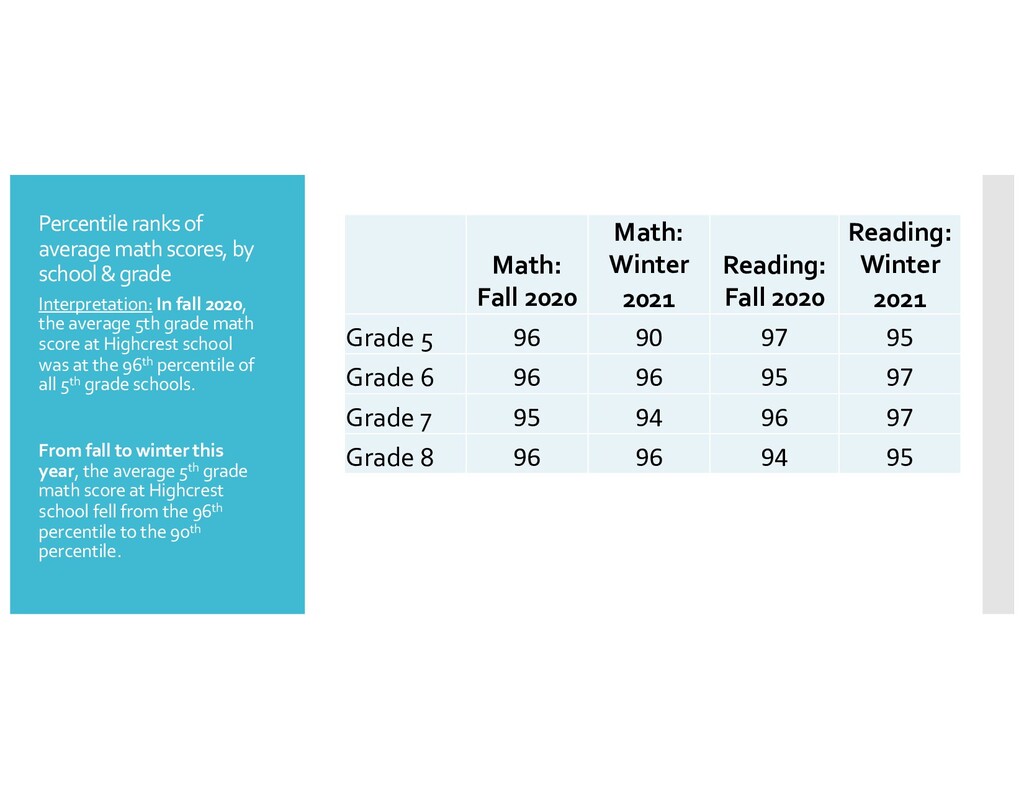
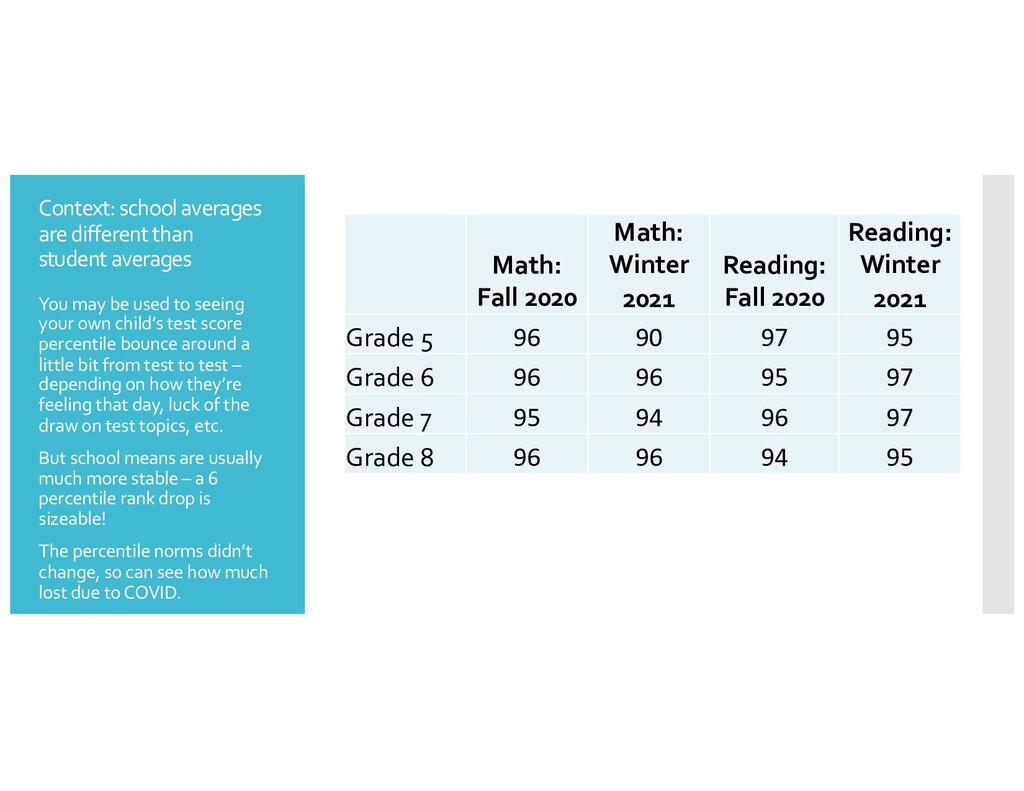
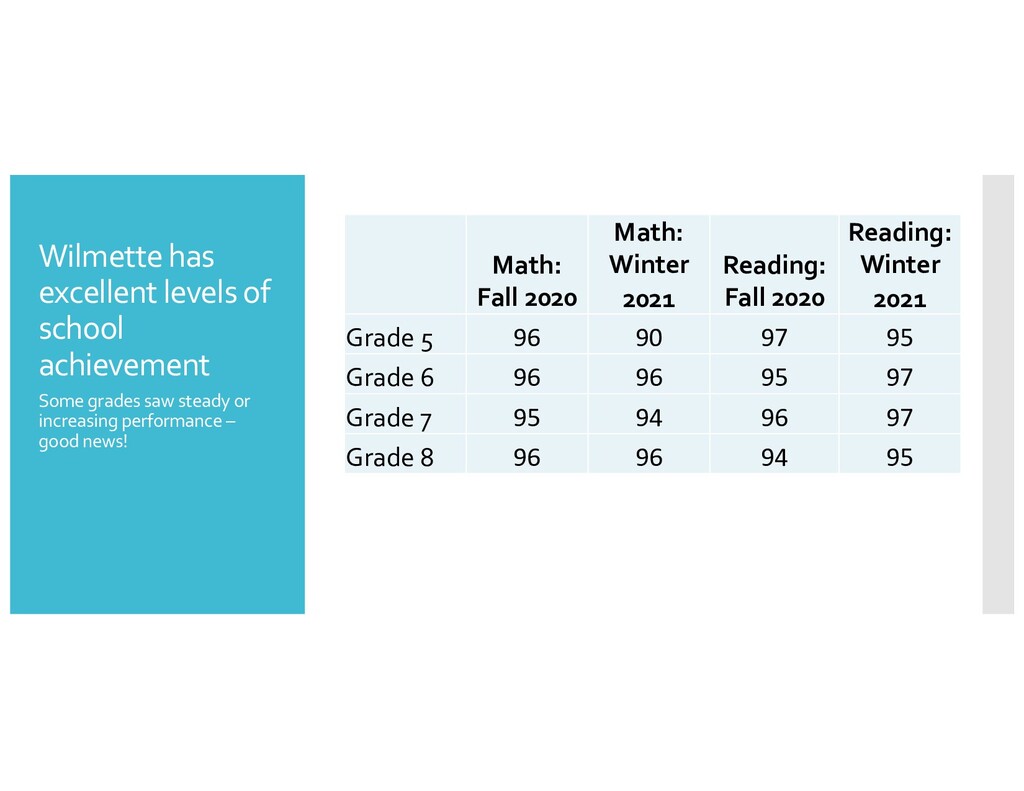
Interpretation: In fall 2020, the average 5th grade math score at Highcrest school was at the 96th percentile of all 5th grade schools. From fall to winter this year, the average 5th grade math score at Highcrest school fell from the 96th percentile to the 90th percentile. Math: Fall 2020 Math: Winter 2021 Reading: Fall 2020 Reading: Winter 2021 Grade 5 96 90 97 95 Grade 6 96 96 95 97 Grade 7 95 94 96 97 Grade 8 96 96 94 95
be used to seeing your own child’s test score percentile bounce around a little bit from test to test – depending on how they’re feeling that day, luck of the draw on test topics, etc. But school means are usually much more stable – a 6 percentile rank drop is sizeable! The percentile norms didn’t change, so can see how much lost due to COVID. Math: Fall 2020 Math: Winter 2021 Reading: Fall 2020 Reading: Winter 2021 Grade 5 96 90 97 95 Grade 6 96 96 95 97 Grade 7 95 94 96 97 Grade 8 96 96 94 95
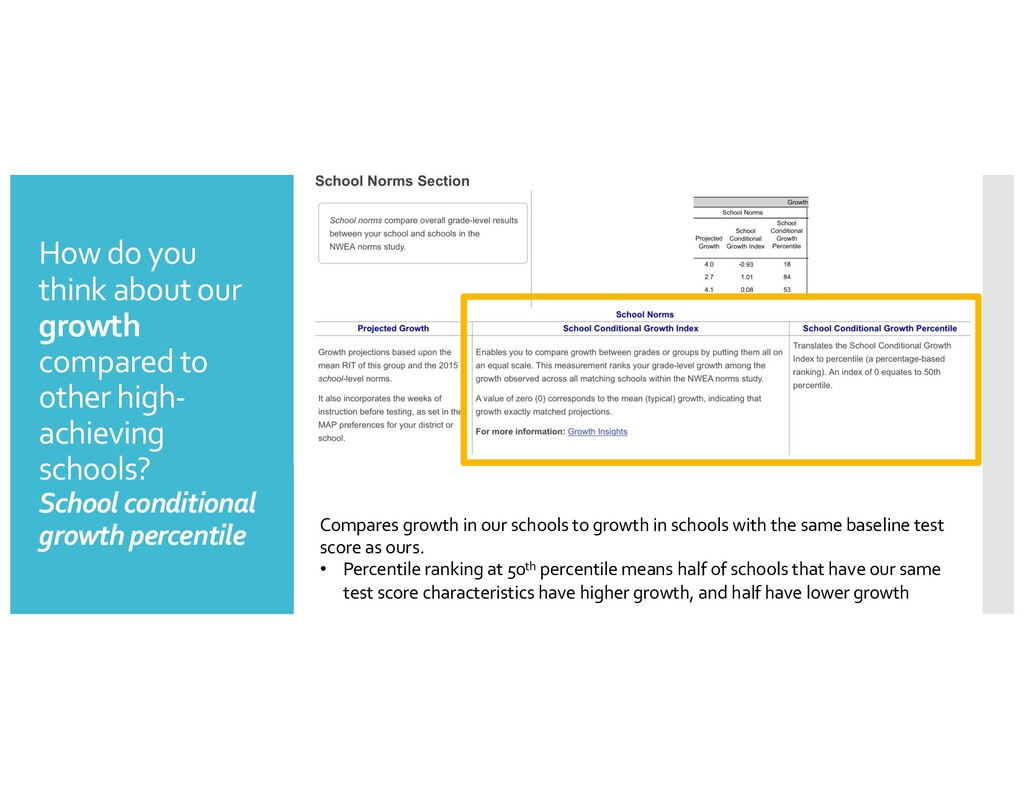
high- achieving schools? School conditional growth percentile Compares growth in our schools to growth in schools with the same baseline test score as ours. • Percentile ranking at 50th percentile means half of schools that have our same test score characteristics have higher growth, and half have lower growth
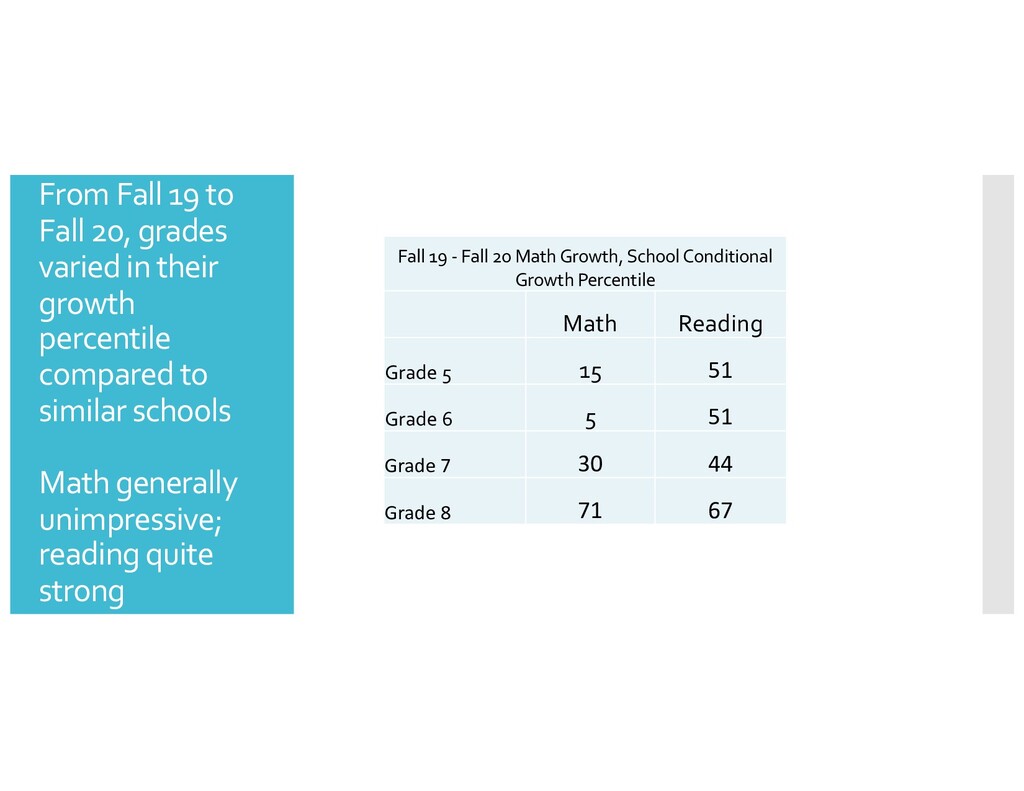
growth percentile compared to similar schools Math generally unimpressive; reading quite strong Fall 19 - Fall 20 Math Growth, School Conditional Growth Percentile Math Reading Grade 5 15 51 Grade 6 5 51 Grade 7 30 44 Grade 8 71 67
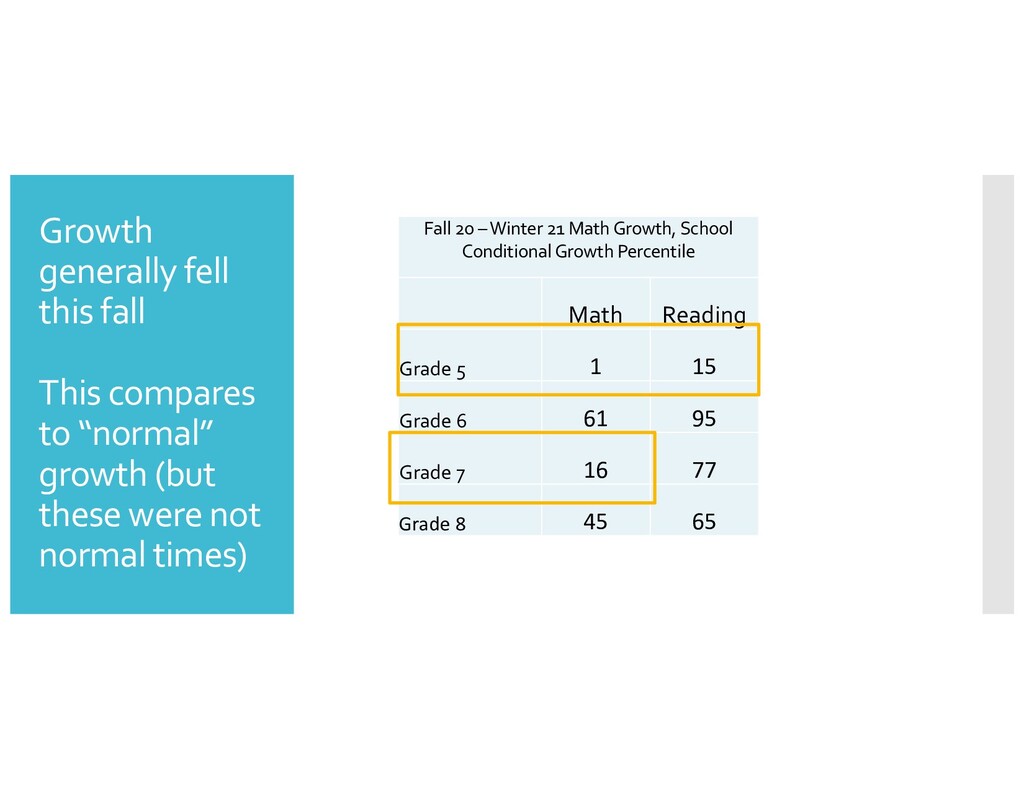
(but these were not normal times) Fall 20 –Winter 21 Math Growth, School Conditional Growth Percentile Math Reading Grade 5 1 15 Grade 6 61 95 Grade 7 16 77 Grade 8 45 65
downward achievement trends I documented last year These have been years in the making, and will require effort to turn around Puts some numbers on the academic ground we have lost due to COVID The board & parents need to be monitoring school performance in a meaningful way Data on our achievement and growth relative to similar peers should be routinely monitored and presented to the Board & parents School conditional growth percentiles is a sensible approach