Upgrade to Pro — share decks privately, control downloads, hide ads and more …

Growth in Wilmette's Elementary MAP Scores

Growth in Wilmette's Elementary MAP Scores

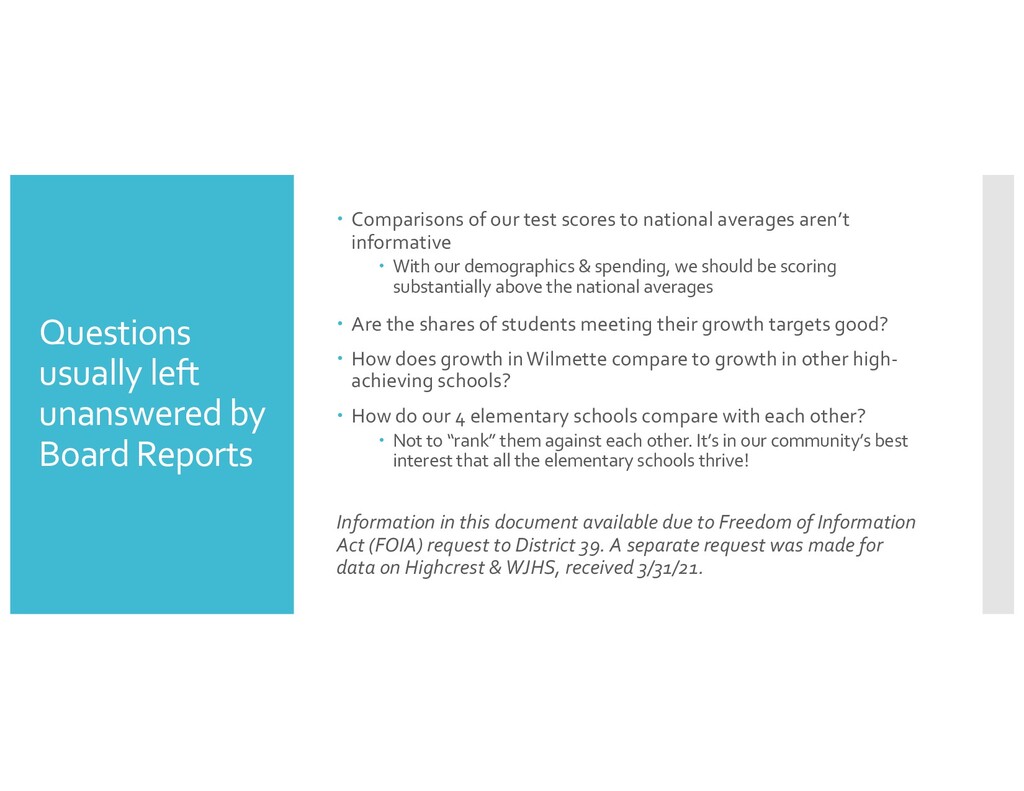
Wilmette usually compares our district's MAP test scores to national averages -- instead of comparing us to other schools with similar demographics & spending.

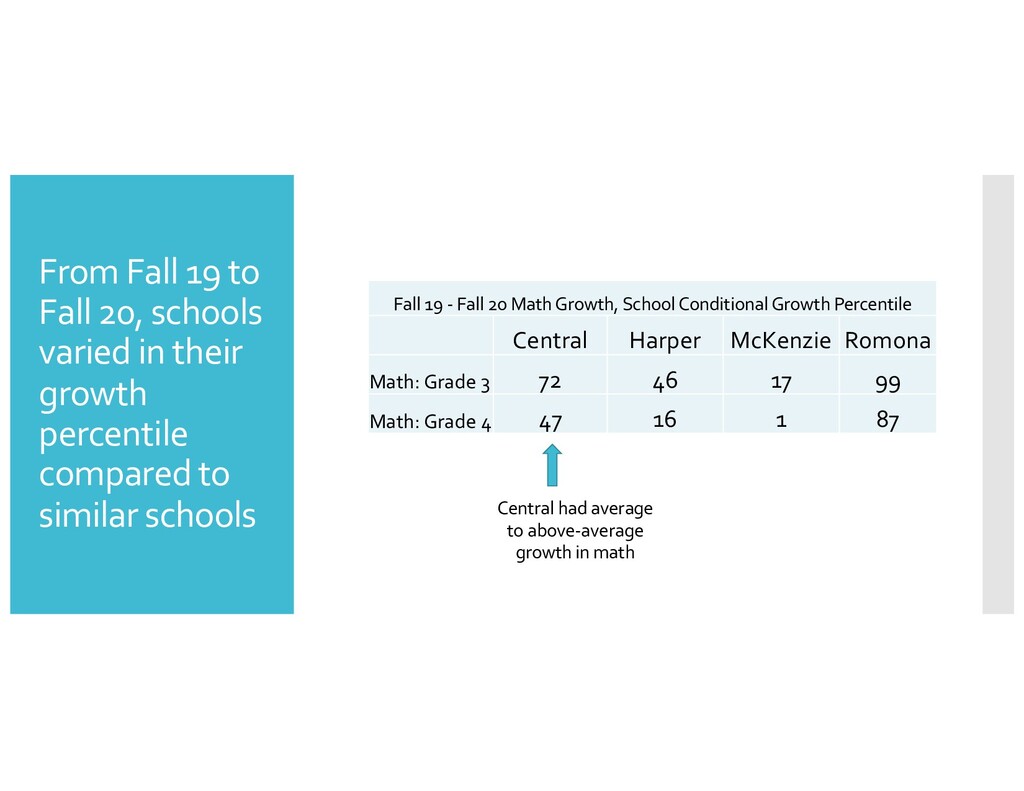
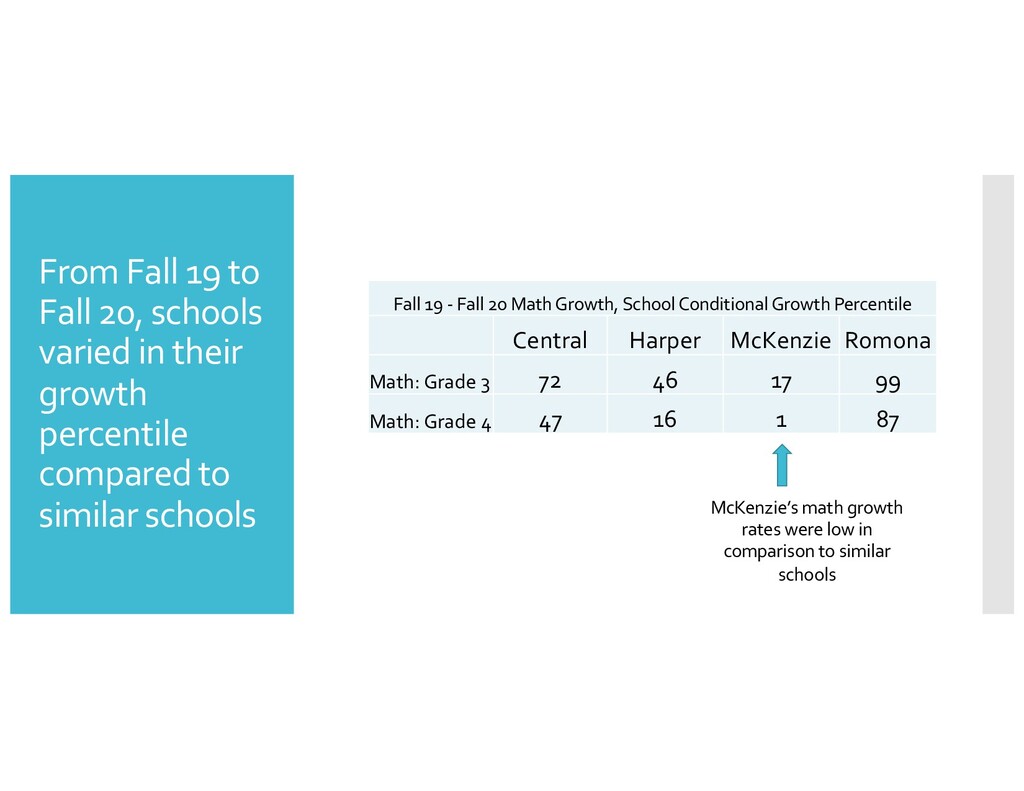
This deck addresses questions such as: How does growth in Wilmette compare to growth in other high-achieving schools? How does performance vary across our 4 elementary schools?

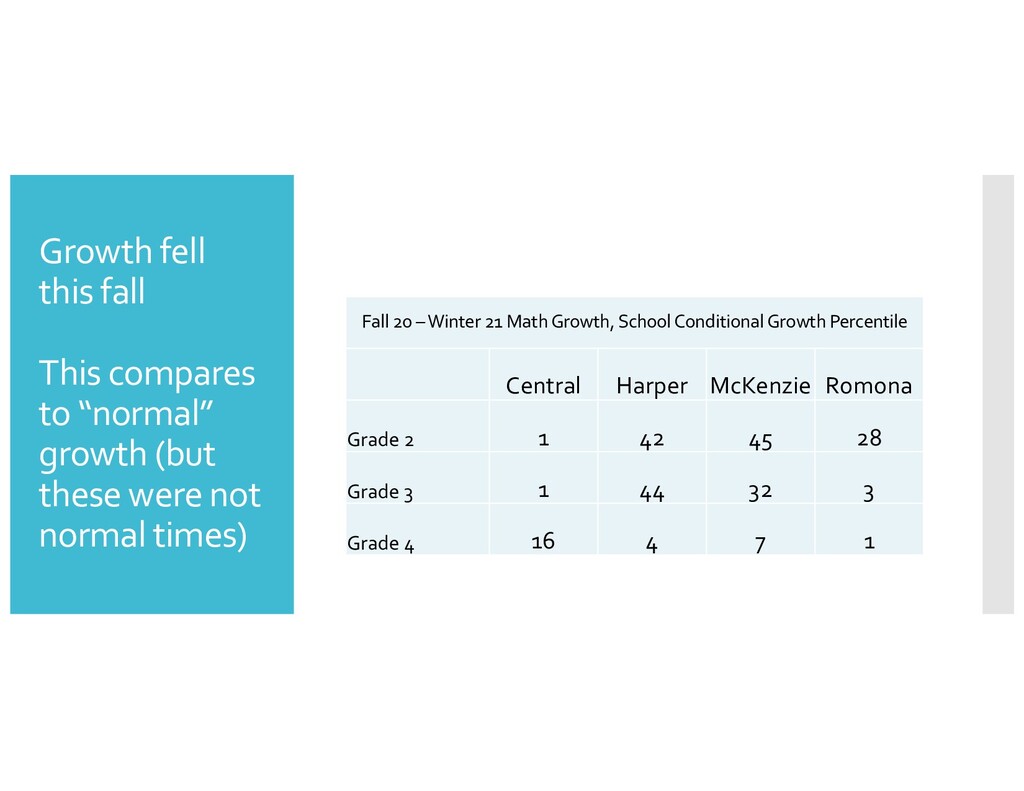
Covers both pre-COVID and COVID.

More Decks by Wilmette Schools Project

Other Decks in Education

Transcript

  1. Highlights of this report on the 2021 MAP winter assessment,

    presented by Katie Lee, Wilmette Administrator for Curriculum & Instruction, to the school board committee of the whole – Average scores in Wilmette in math & reading across all grades are substantially higher than the national average – Grade-by-grade comparisons from winter 2018 to winter 2021 of math & reading average scores – Many are quite stable, up or down 1 point – Grade-by-grade comparisons from winter 2018 to winter 2021 of the share of students meeting their expected growth benchmarks – Many are stable, some down substantially – Breakdowns by performance groupings, fall-to-winter growth, last 3 years, by grade – Groups: 1. Low Achievement, Low Growth; 2. High Achievement, Low Growth; 3. Low Achievement, High Growth; 4. High Achievement, High Growth – Notes: – ”low achievement” defined as score < 50th percentile – “low growth” defined as growth < 50th percentile compared to others with your same fall score
  2. Questions usually left unanswered by Board Reports – Comparisons of

    our test scores to national averages aren’t informative – With our demographics & spending, we should be scoring substantially above the national averages – Are the shares of students meeting their growth targets good? – How does growth in Wilmette compare to growth in other high- achieving schools? – How do our 4 elementary schools compare with each other? – Not to “rank” them against each other. It’s in our community’s best interest that all the elementary schools thrive! Information in this document available due to Freedom of Information Act (FOIA) request to District 39. A separate request was made for data on Highcrest & WJHS, received 3/31/21.
  3. Percentile ranks of average math scores, by school & grade

    Interpretation: In fall 2020, the average 2nd grade math score at Central school was at the 95th percentile of all 2nd grade schools. From fall to winter this year, the average 2nd grade math score at Central school fell from the 95th percentile to the 87th percentile. Central Harper McKenzie Romona Math: Fall 2020 Grade 2 95 93 96 99 Grade 3 95 93 89 94 Grade 4 96 97 85 99 Math: Winter 2021 Grade 2 87 92 96 98 Grade 3 88 92 87 88 Grade 4 95 94 79 96
  4. Context: school averages are different than student averages You may

    be used to seeing your own child’s test score percentile bounce around a little bit from test to test – depending on how they’re feeling that day, luck of the draw on test topics, etc. But school means are usually much more stable – an 8 percentile rank drop is sizeable! The percentile norms didn’t change, so can see how much lost due to COVID. Central Harper McKenzie Romona Math: Fall 2020 Grade 2 95 93 96 99 Grade 3 95 93 89 94 Grade 4 96 97 85 99 Math: Winter 2021 Grade 2 87 92 96 98 Grade 3 88 92 87 88 Grade 4 95 94 79 96
  5. Wilmette has excellent levels of school achievement Some grades &

    schools dropped more than others this fall Also note steady decline in McKenzie scores across grades Central Harper McKenzie Romona Math: Fall 2020 Grade 2 95 93 96 99 Grade 3 95 93 89 94 Grade 4 96 97 85 99 Math: Winter 2021 Grade 2 87 92 96 98 Grade 3 88 92 87 88 Grade 4 95 94 79 96
  6. How do you think about our growth compared to other

    high- achieving schools? School conditional growth percentile Compares growth in our schools to growth in schools with the same baseline test score as ours. • Percentile ranking at 50th percentile means half of schools that have our same test score characteristics have higher growth, and half have lower growth
  7. From Fall 19 to Fall 20, schools varied in their

    growth percentile compared to similar schools Fall 19 - Fall 20 Math Growth, School Conditional Growth Percentile Central Harper McKenzie Romona Math: Grade 3 72 46 17 99 Math: Grade 4 47 16 1 87 Romona had exceptionally high growth in math
  8. From Fall 19 to Fall 20, schools varied in their

    growth percentile compared to similar schools Fall 19 - Fall 20 Math Growth, School Conditional Growth Percentile Central Harper McKenzie Romona Math: Grade 3 72 46 17 99 Math: Grade 4 47 16 1 87 Central had average to above-average growth in math
  9. From Fall 19 to Fall 20, schools varied in their

    growth percentile compared to similar schools Fall 19 - Fall 20 Math Growth, School Conditional Growth Percentile Central Harper McKenzie Romona Math: Grade 3 72 46 17 99 Math: Grade 4 47 16 1 87 Harper’s students moving from grade 2-> 3 had average growth Students moving from grade 3-> 4 had low growth
  10. From Fall 19 to Fall 20, schools varied in their

    growth percentile compared to similar schools Fall 19 - Fall 20 Math Growth, School Conditional Growth Percentile Central Harper McKenzie Romona Math: Grade 3 72 46 17 99 Math: Grade 4 47 16 1 87 McKenzie’s math growth rates were low in comparison to similar schools
  11. Growth fell this fall This compares to “normal” growth (but

    these were not normal times) Fall 20 –Winter 21 Math Growth, School Conditional Growth Percentile Central Harper McKenzie Romona Grade 2 1 42 45 28 Grade 3 1 44 32 3 Grade 4 16 4 7 1
  12. The same analysis can be done with reading scores Reading

    achievement levels (percentiles) Central Harper McKenzie Romona Reading: Fall 2020 Grade 2 99 98 99 99 Grade 3 99 98 99 98 Grade 4 97 97 96 98 Reading: Winter 2021 Grade 2 96 96 99 99 Grade 3 96 94 98 93 Grade 4 94 94 95 95 School conditional growth percentiles, reading Fall 19 - Fall 20 Reading Growth, School Conditional Growth Percentile Central Harper McKenzie Romona Reading: Grade 3 89 89 98 99 Reading: Grade 4 84 33 46 54 Fall 20 - Winter 21 Reading Growth, School Conditional Growth Percentile Central Harper McKenzie Romona Grade 2 1 8 18 44 Grade 3 1 1 2 1 Grade 4 3 5 43 1
  13. Getting back on track – This is consistent with the

    downward achievement trends I documented last year – These have been years in the making, and will require effort to turn around – Puts some numbers on the academic ground we have lost due to COVID – The board & parents need to be monitoring school performance in a meaningful way – Data on our achievement and growth relative to similar peers should be routinely monitored and presented to the Board & parents