Upgrade to Pro — share decks privately, control downloads, hide ads and more …

Making Classification Error and Bias Transparen...

Making Classification Error and Bias Transparent and Understandable

Avatar for Emma Beauxis-Aussalet

Emma Beauxis-Aussalet

December 14, 2019

Other Decks in Technology

Transcript

  1. STEP 1 DEFINE 
 ERROR & BIAS Disclaimer: 
 Does

    not discuss the (human) sources of bias.
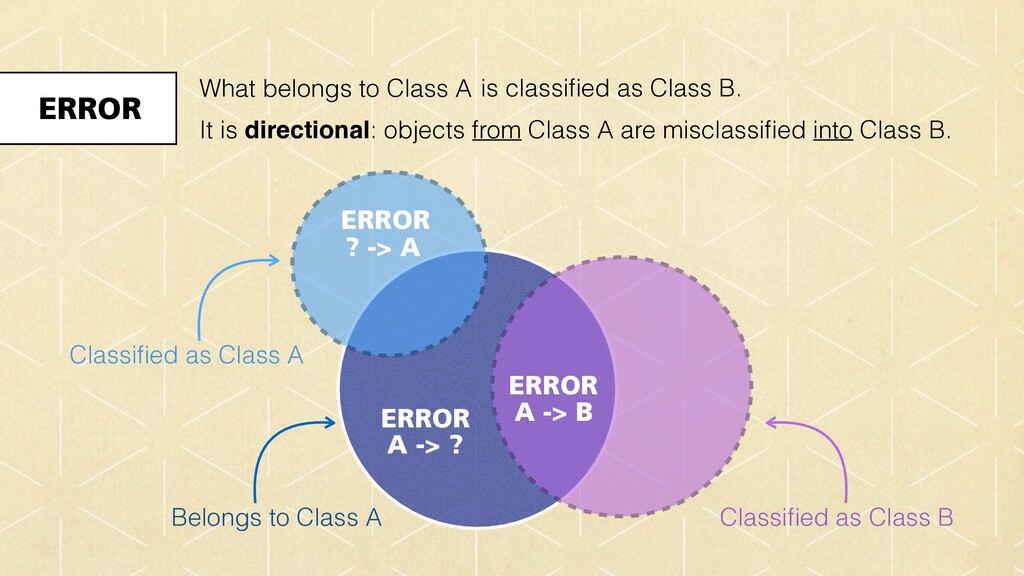
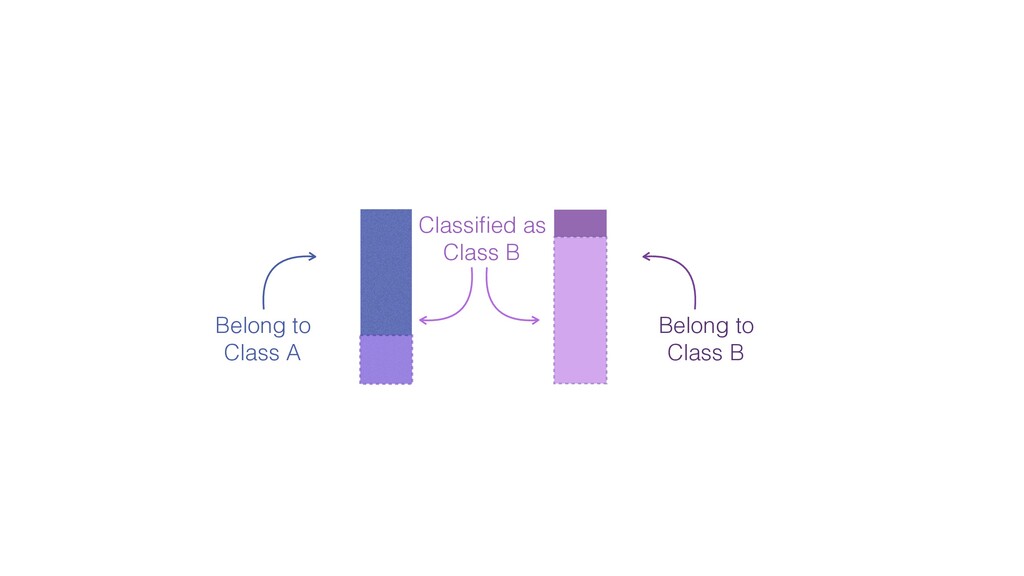
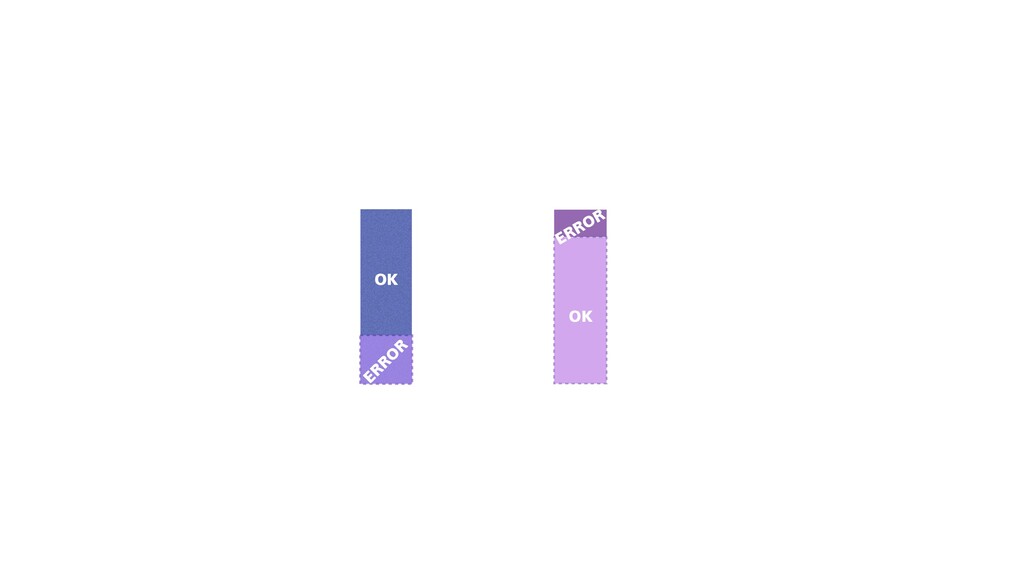
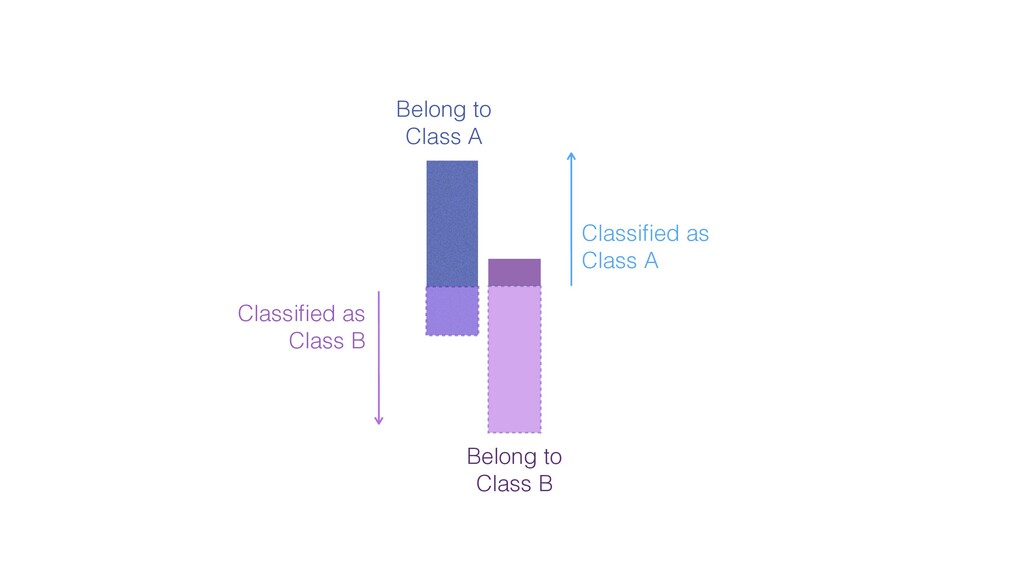
  2. ERROR What belongs to Class A It is directional: objects

    from Class A are misclassified into Class B. Belongs to Class A is classified as Class B. Classified as Class B ERROR Classified as Class A A -> B ERROR ? -> A ERROR A -> ?
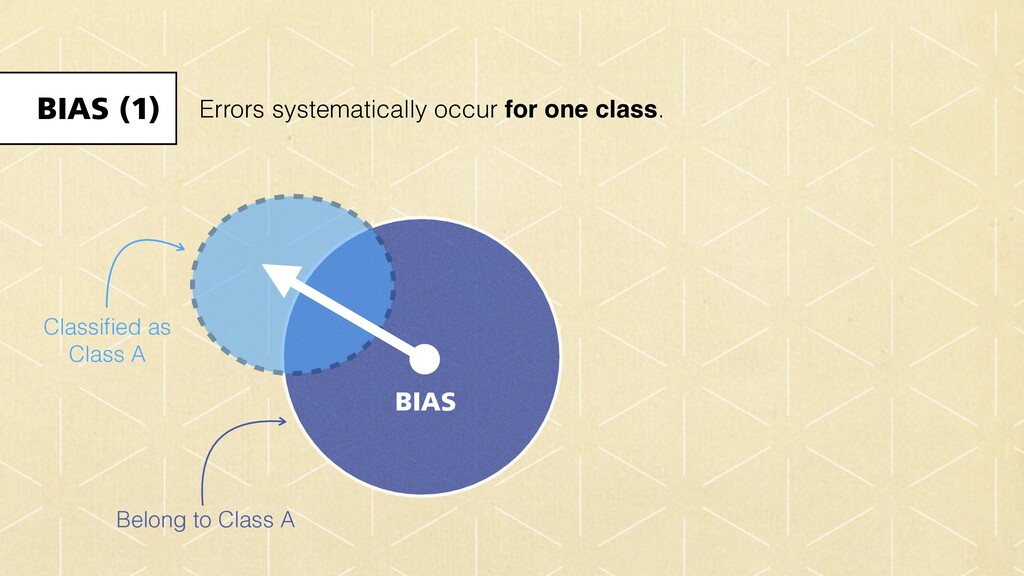
  3. BIAS (1) Errors systematically occur for one class. Belong to

    Class A Classified as 
 Class A BIAS
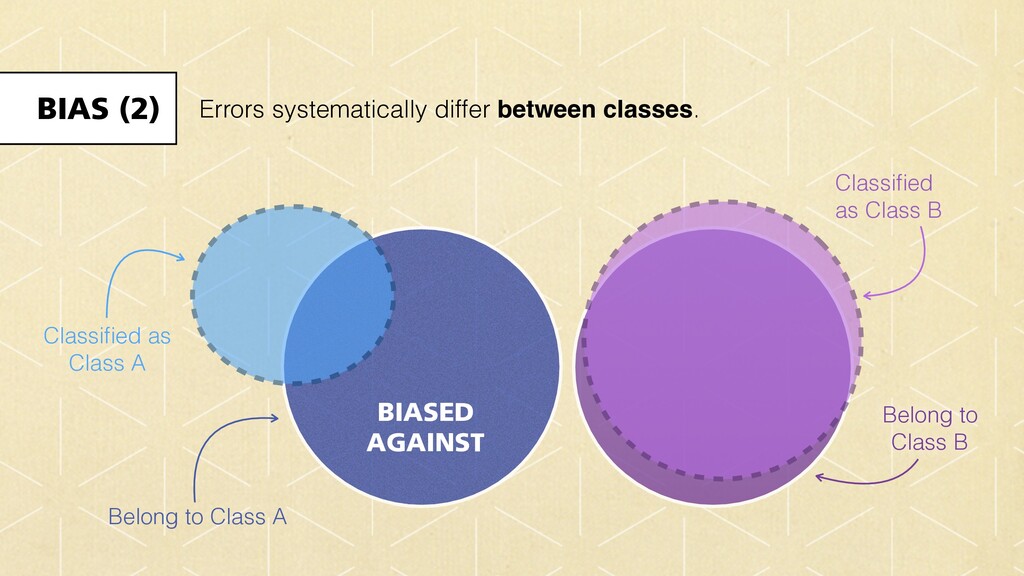
  4. BIAS (2) Errors systematically differ between classes. Belong to Class

    A Belong to 
 Class B Classified as 
 Class A Classified
 as Class B BIASED
 AGAINST
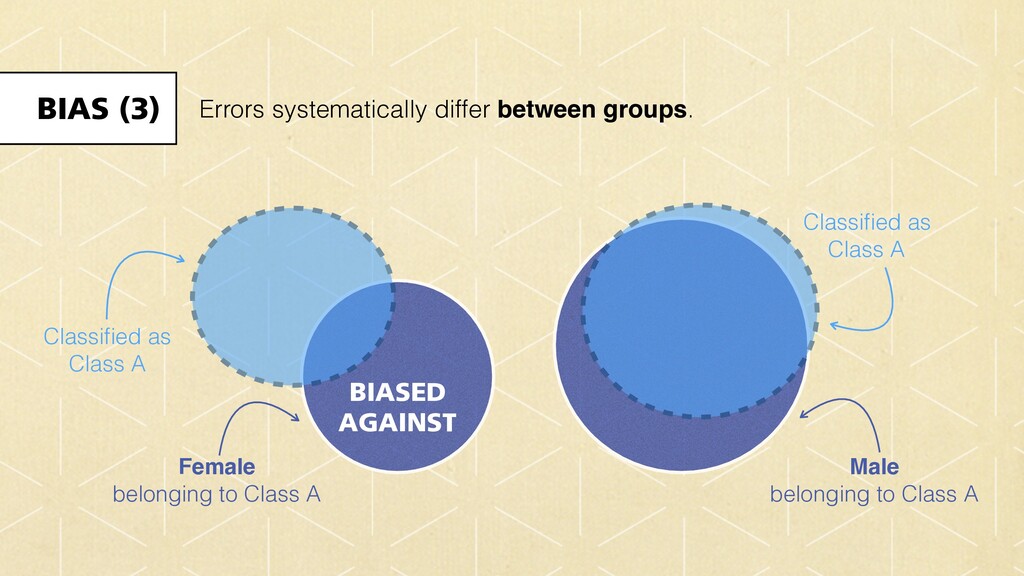
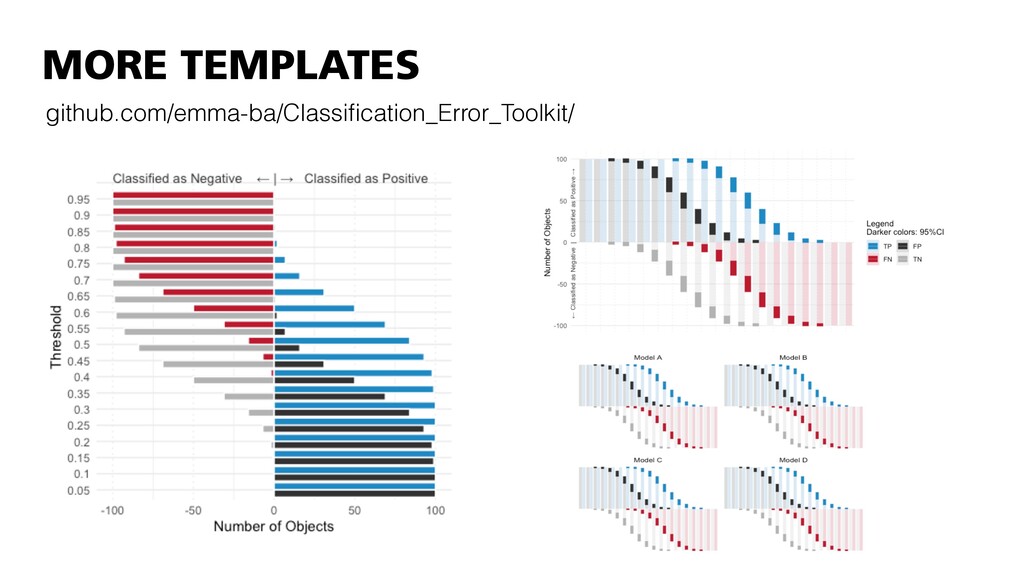
  5. Female 
 belonging to Class A BIASED
 AGAINST Male 


    belonging to Class A Classified as 
 Class A Classified as 
 Class A BIAS (3) Errors systematically differ between groups.
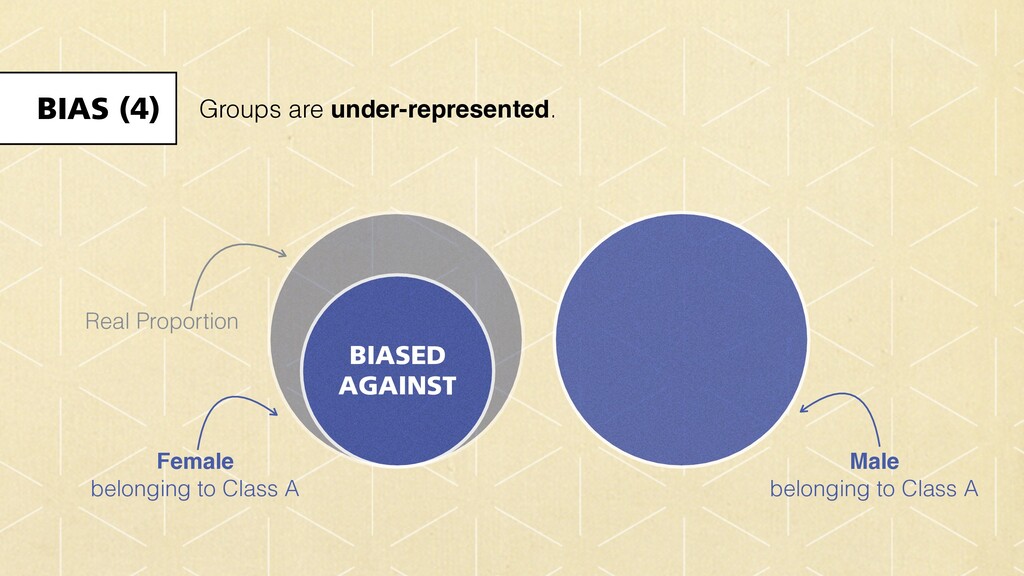
  6. BIAS (4) Groups are under-represented. Real Proportion BIASED
 AGAINST Male

    
 belonging to Class A Female 
 belonging to Class A
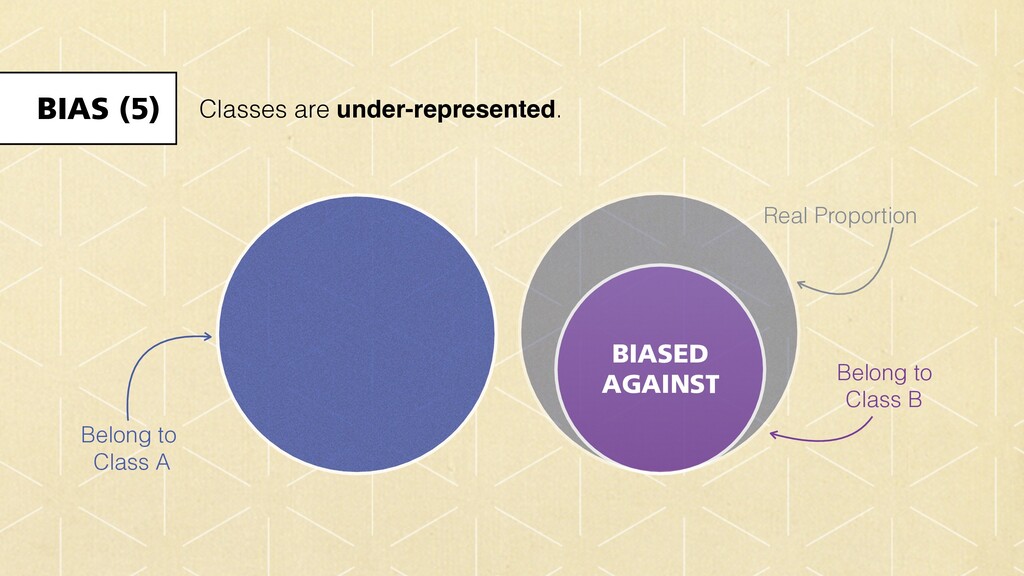
  7. BIAS (5) Real Proportion Belong to
 Class A Belong to

    
 Class B BIASED
 AGAINST Classes are under-represented.
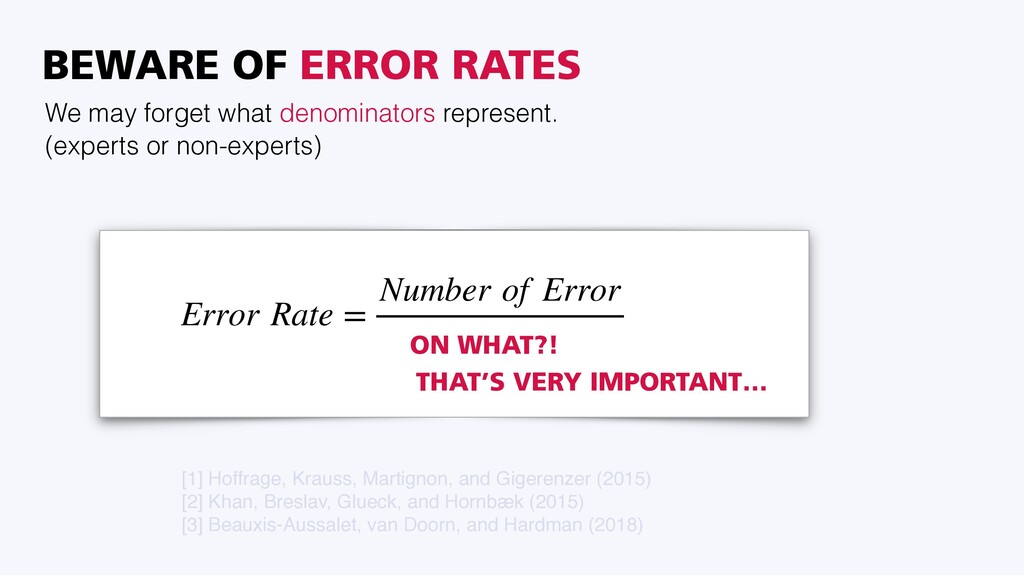
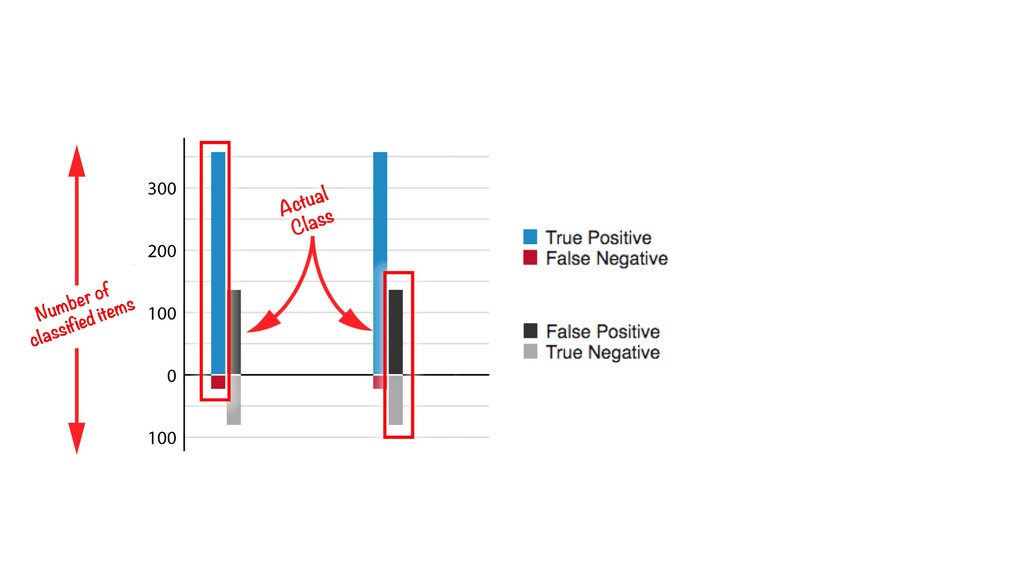
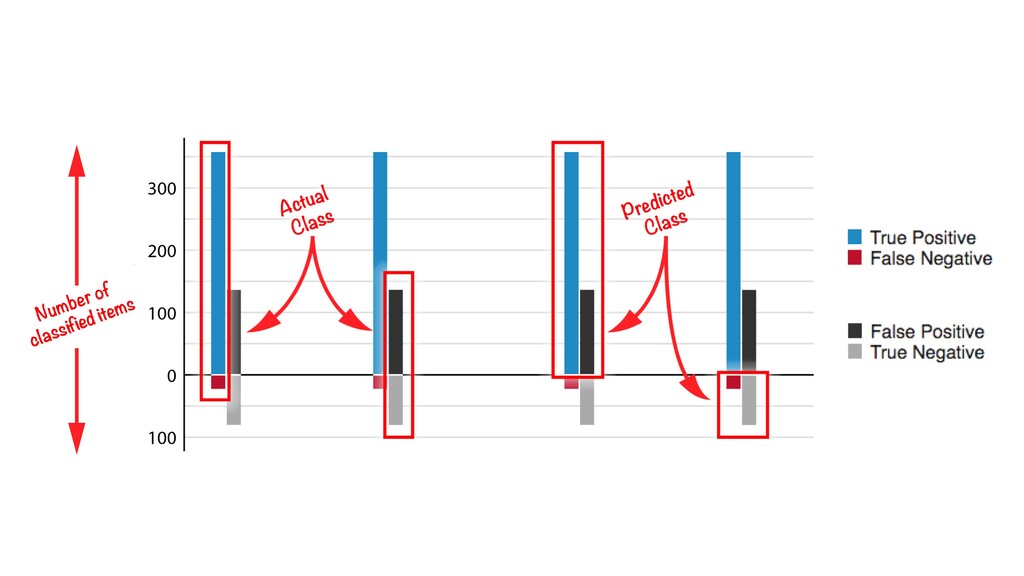
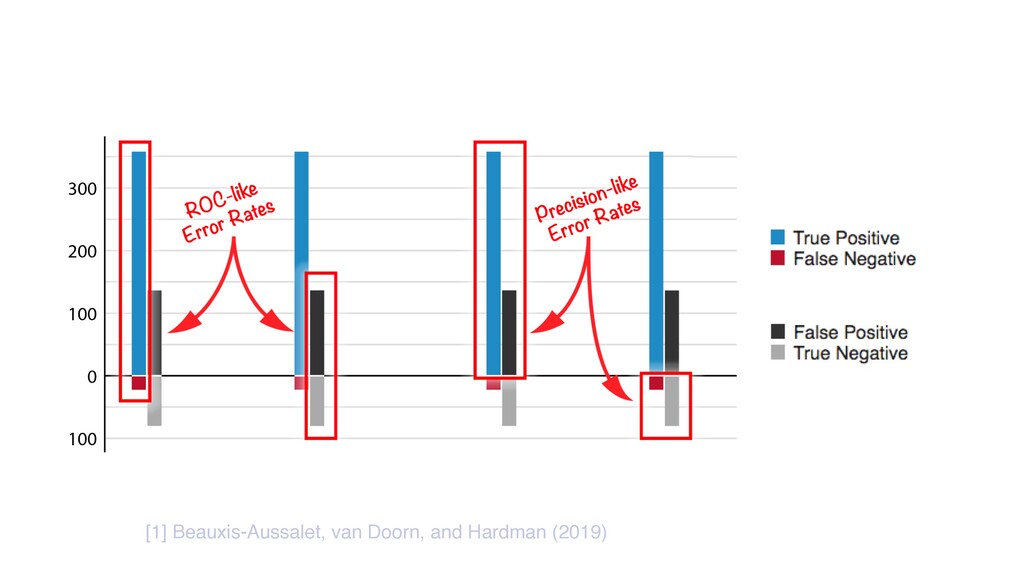
  8. Error Rate = Number of Error On What ?! ON

    WHAT?! [1] Hoffrage, Krauss, Martignon, and Gigerenzer (2015) 
 [2] Khan, Breslav, Glueck, and Hornbæk (2015) [3] Beauxis-Aussalet, van Doorn, and Hardman (2018) THAT’S VERY IMPORTANT… BEWARE OF ERROR RATES We may forget what denominators represent.
 (experts or non-experts)
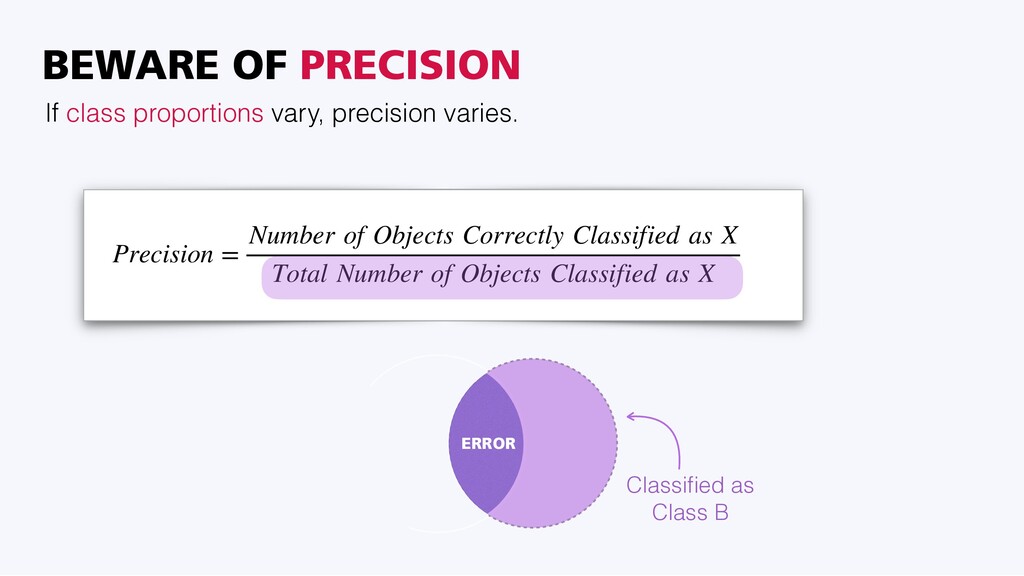
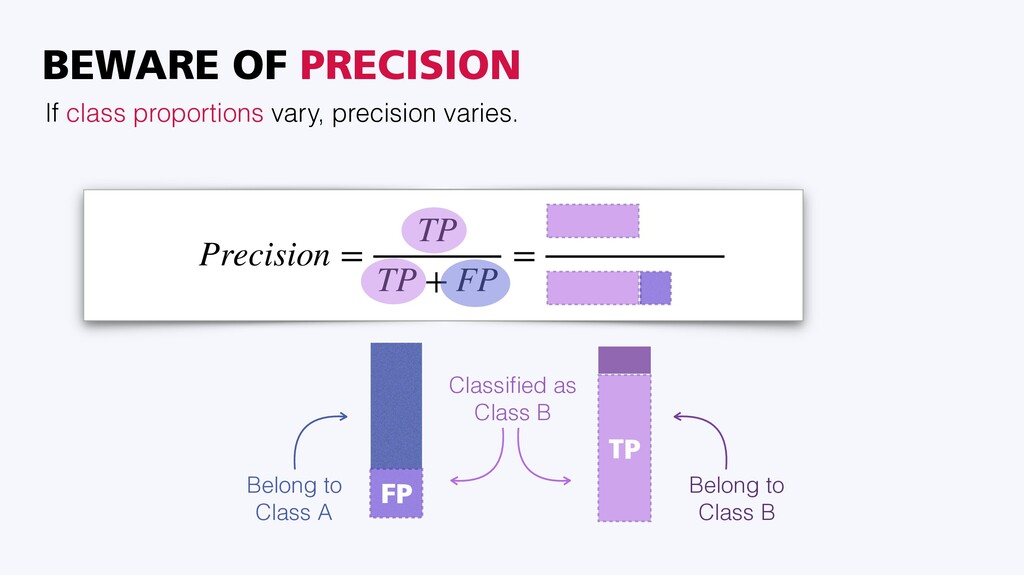
  9. Precision = Number of Objects Correctly Classified as X Total

    Number of Objects Classified as X Belongs to Class A Classified as Class B ERROR BEWARE OF PRECISION If class proportions vary, precision varies.
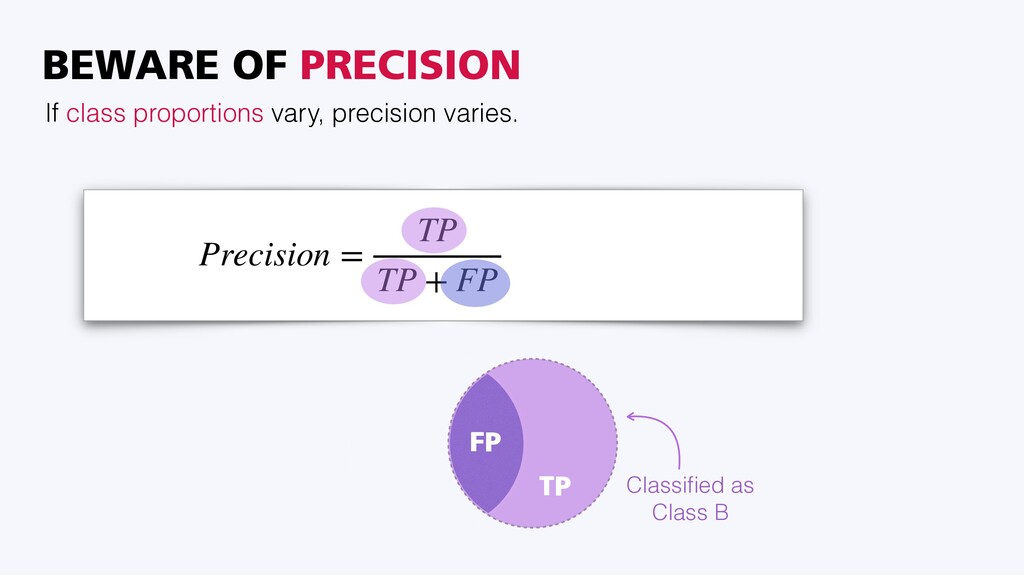
  10. Precision = TP TP + FP = Classified as Class

    B TP FP BEWARE OF PRECISION If class proportions vary, precision varies.
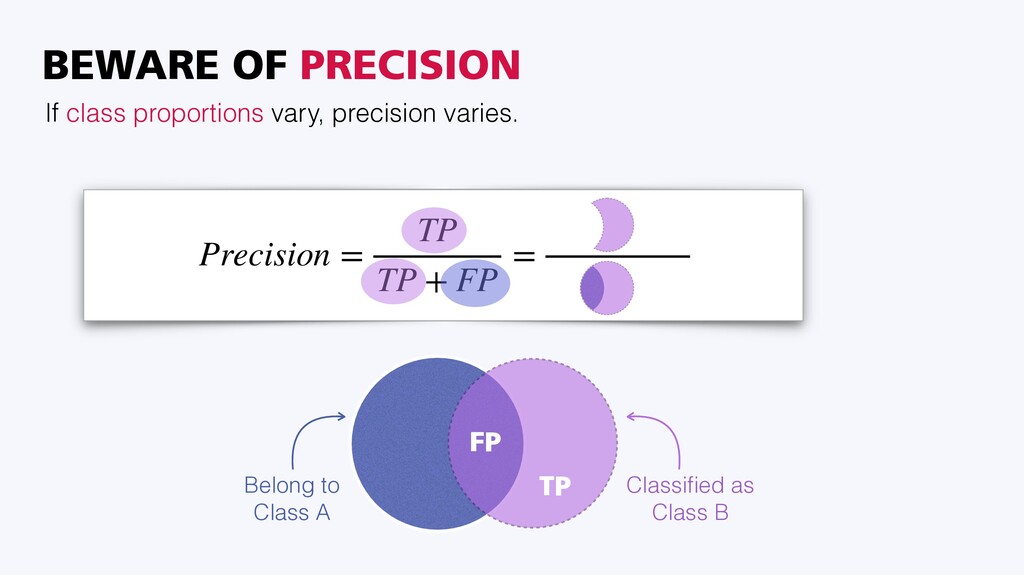
  11. Precision = TP TP + FP = Classified as Class

    B Belong to Class A TP FP BEWARE OF PRECISION If class proportions vary, precision varies.
  12. Precision = TP TP + FP = Classified as Class

    B Belong to Class A TP FP BEWARE OF PRECISION If class proportions vary, precision varies.
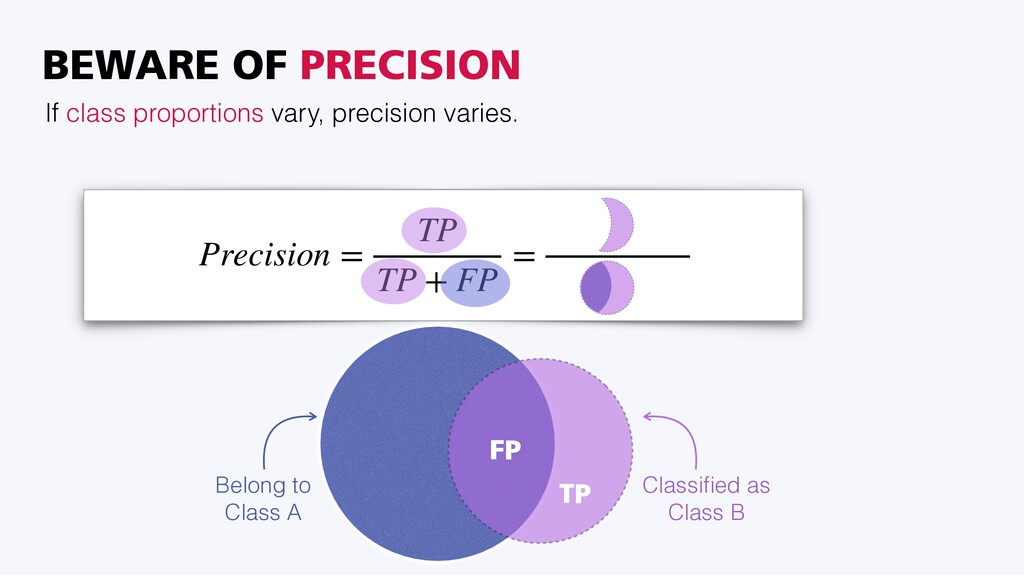
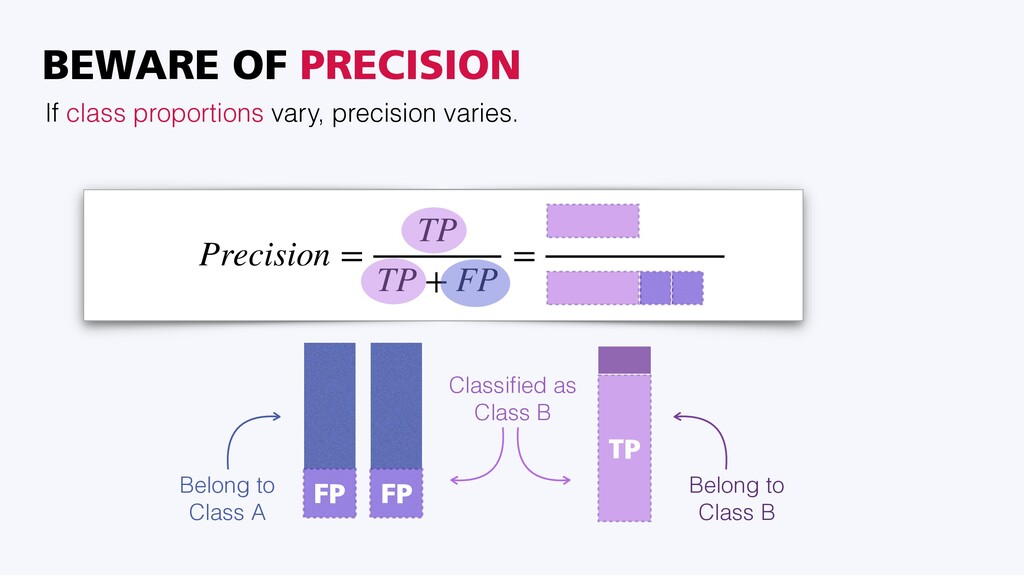
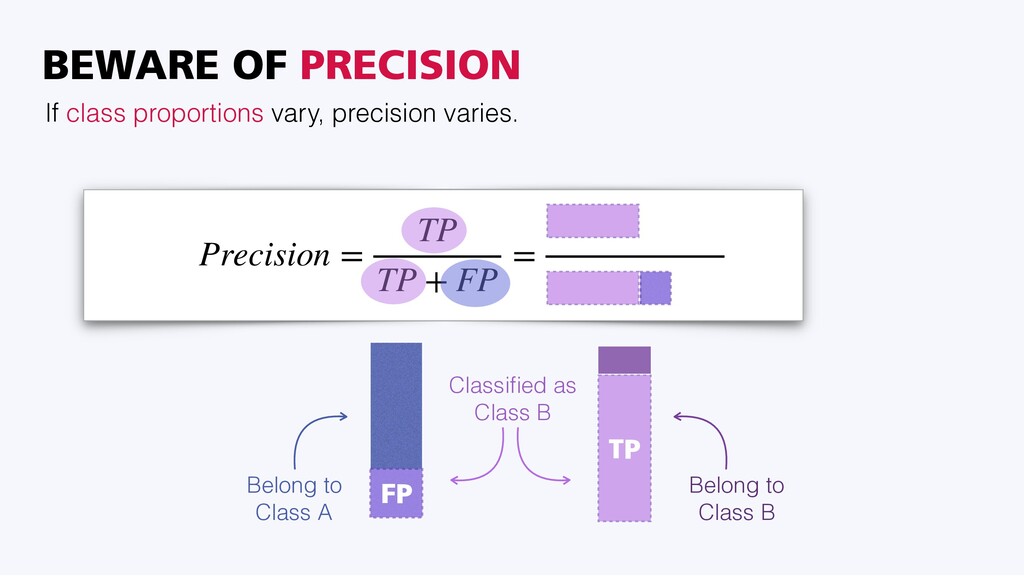
  13. Precision = TP TP + FP = Belong to Class

    B Belong to Class A FP TP Classified as Class B BEWARE OF PRECISION If class proportions vary, precision varies.
  14. Precision = TP TP + FP = Belong to Class

    A FP TP Classified as Class B FP Belong to Class B BEWARE OF PRECISION If class proportions vary, precision varies.
  15. Precision = TP TP + FP = Belong to Class

    B Belong to Class A FP TP Classified as Class B BEWARE OF PRECISION If class proportions vary, precision varies.
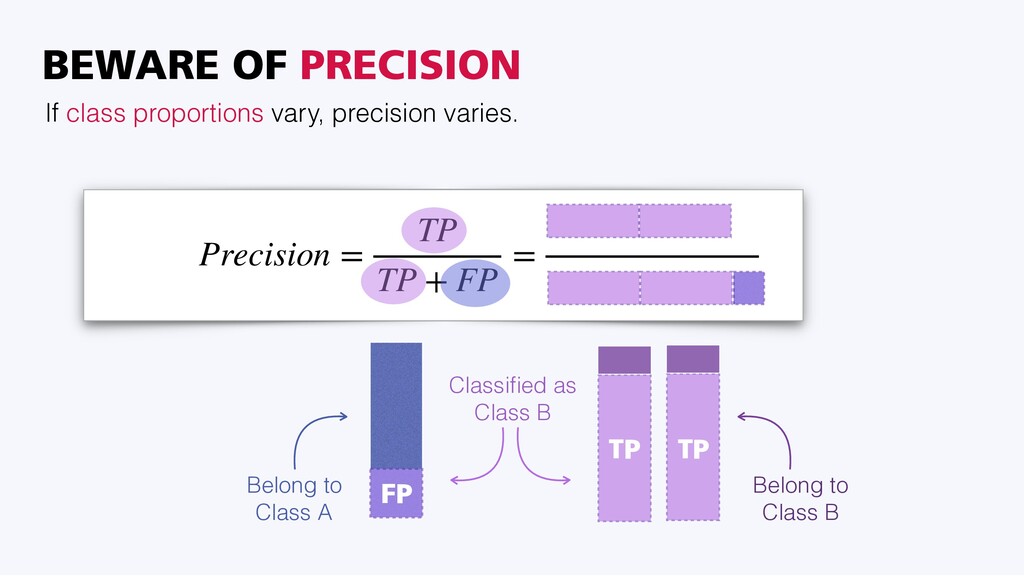
  16. Precision = TP TP + FP = Belong to Class

    B FP TP Classified as Class B Belong to Class A TP BEWARE OF PRECISION If class proportions vary, precision varies.
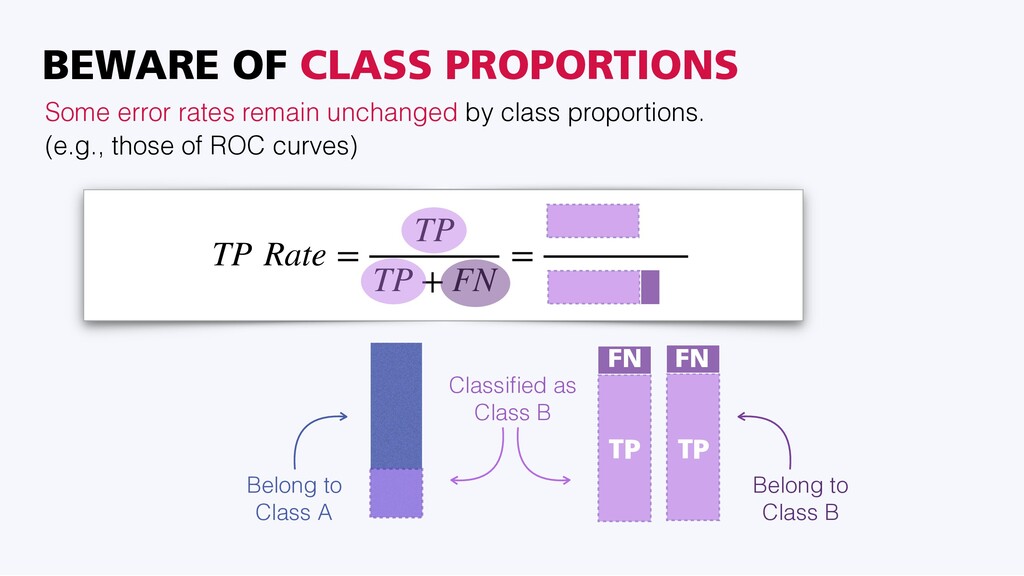
  17. TP Rate = TP TP + FN = Belong to

    Class B TP Classified as Class B Belong to Class A TP FN FN BEWARE OF CLASS PROPORTIONS Some error rates remain unchanged by class proportions.
 (e.g., those of ROC curves)
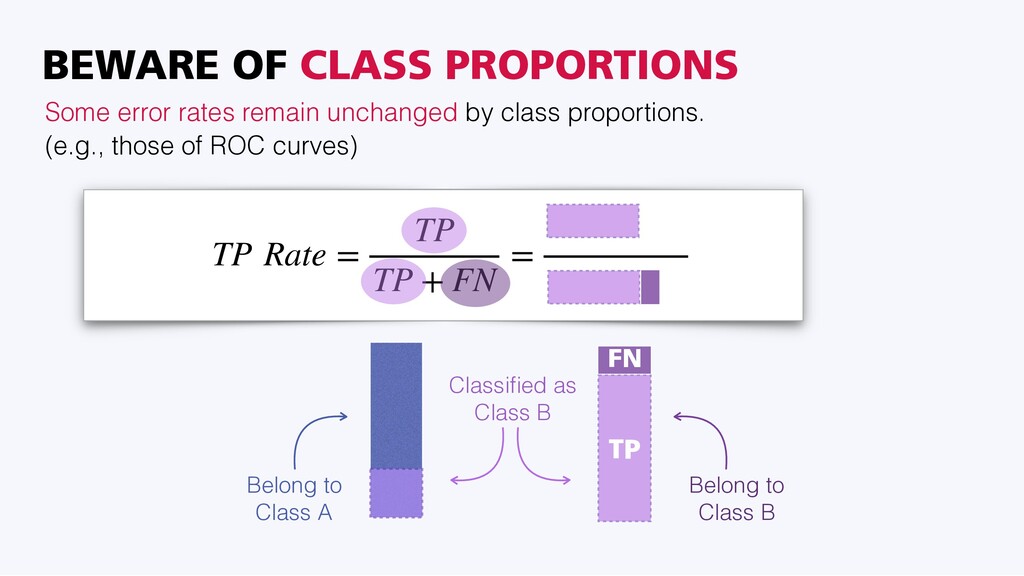
  18. TP Rate = TP TP + FN = TP Classified

    as Class B Belong to Class A FN Belong to Class B BEWARE OF CLASS PROPORTIONS Some error rates remain unchanged by class proportions.
 (e.g., those of ROC curves)
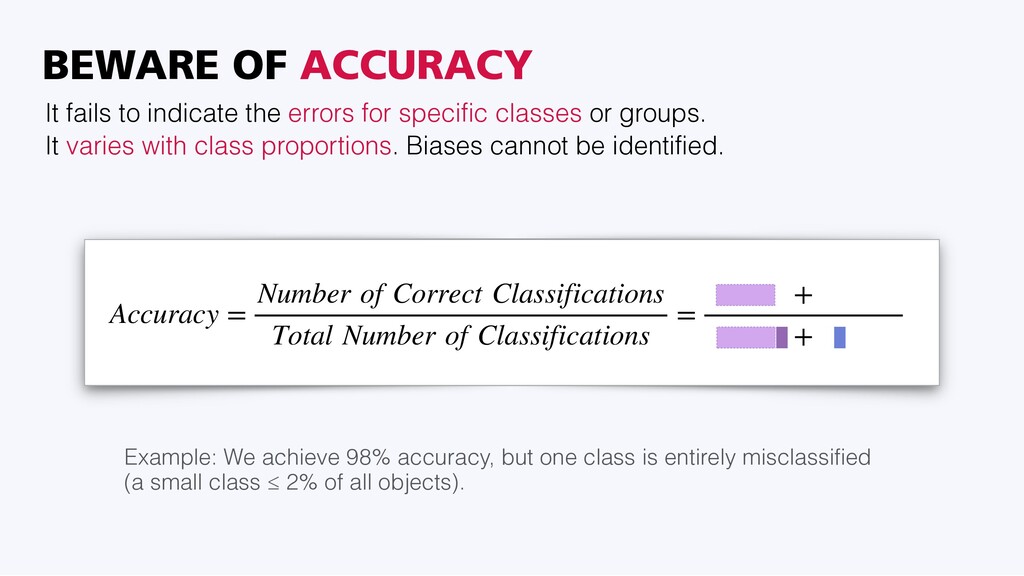
  19. Accuracy = Number of Correct Classifications Total Number of Classifications

    = + + Example: We achieve 98% accuracy, but one class is entirely misclassified 
 (a small class ≤ 2% of all objects). BEWARE OF ACCURACY It fails to indicate the errors for specific classes or groups.
 It varies with class proportions. Biases cannot be identified.
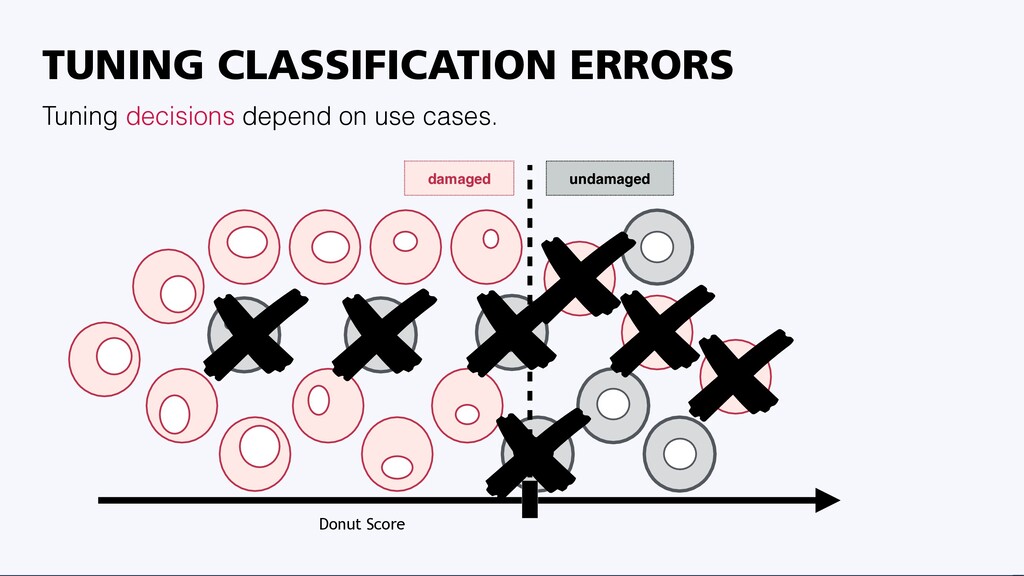
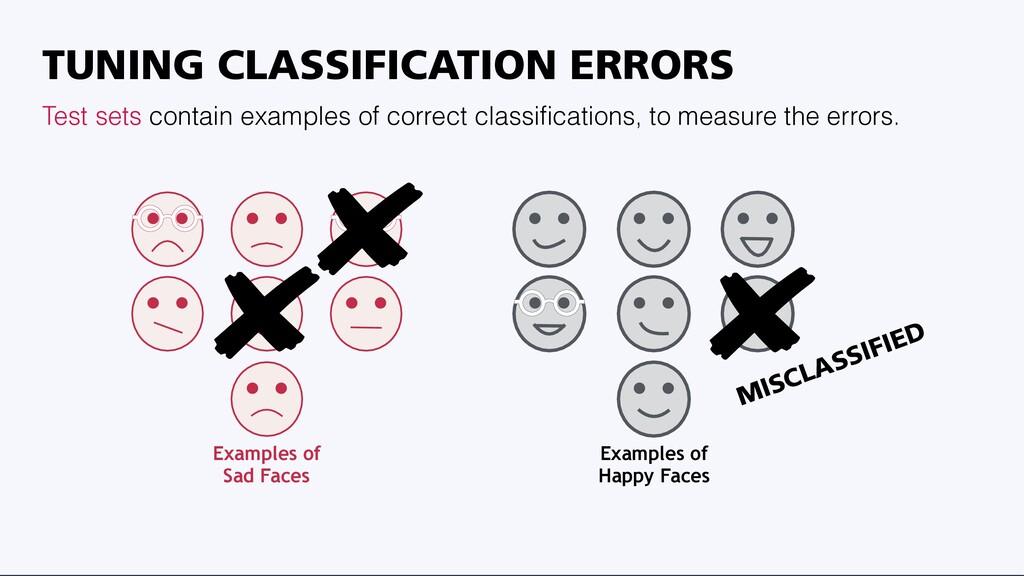
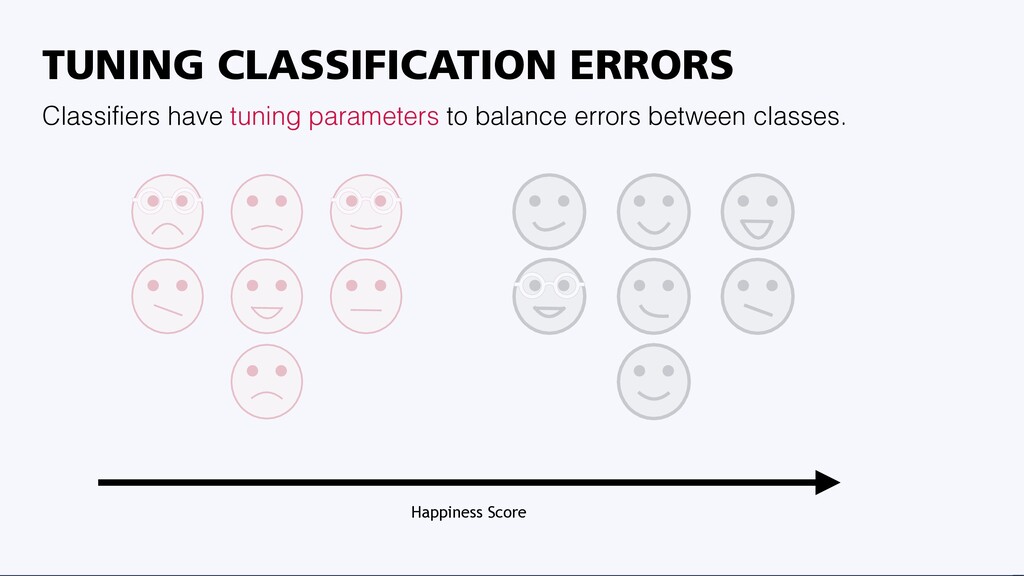
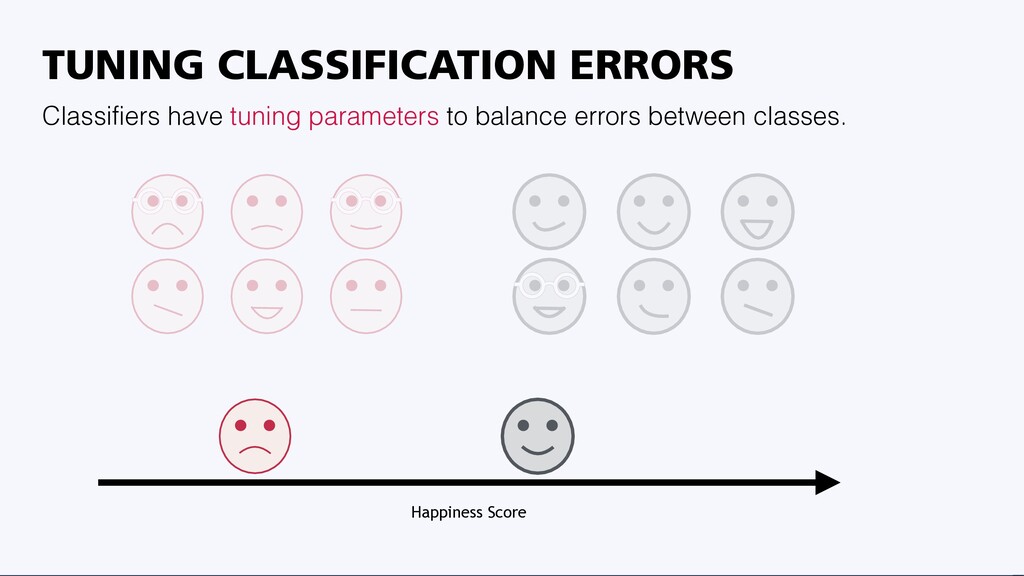
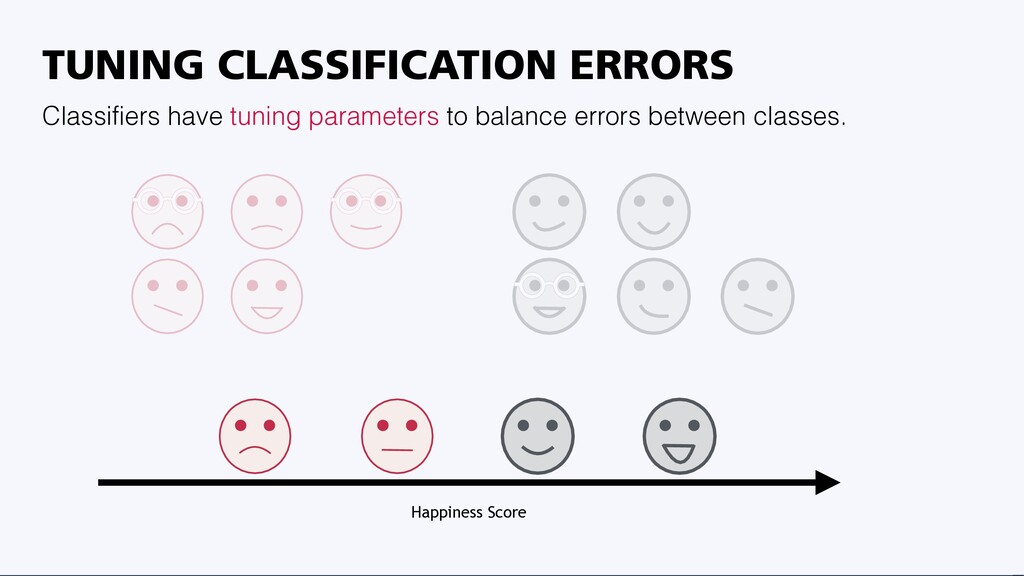
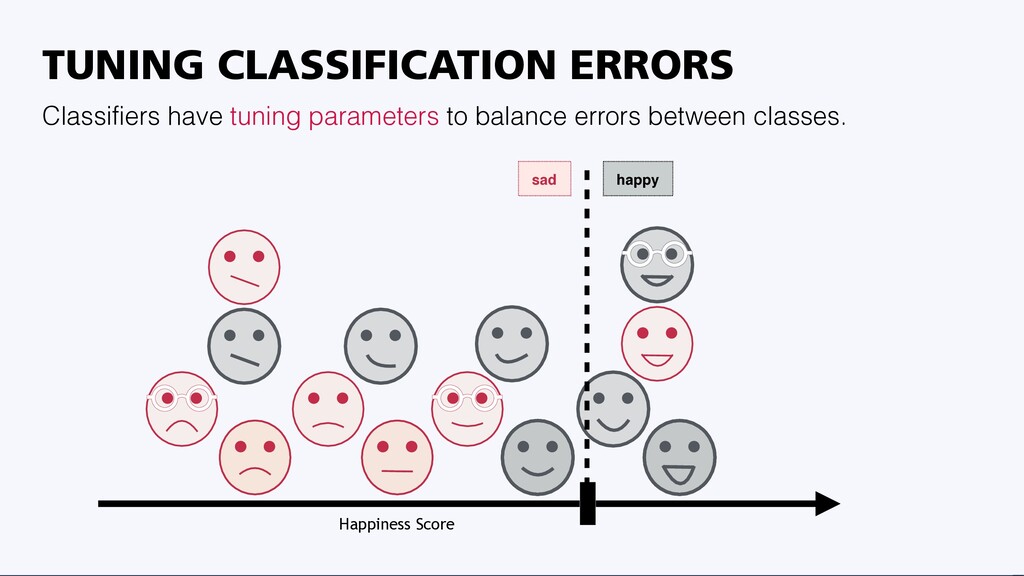
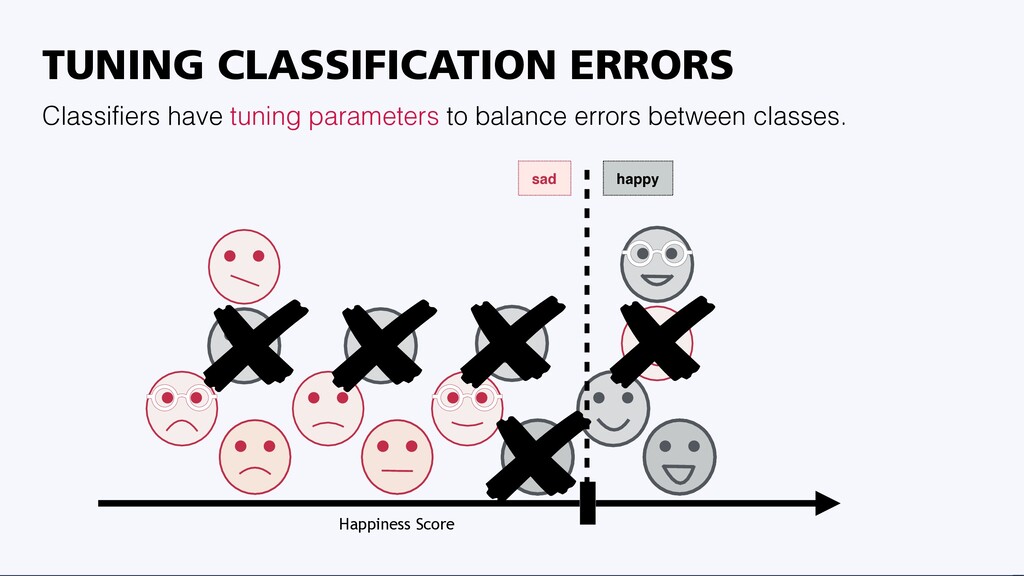
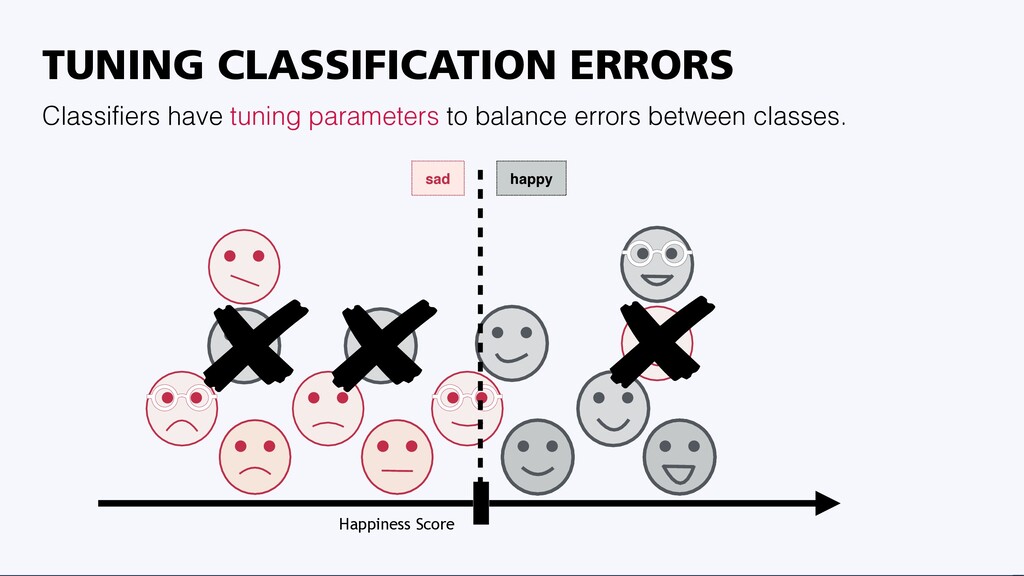
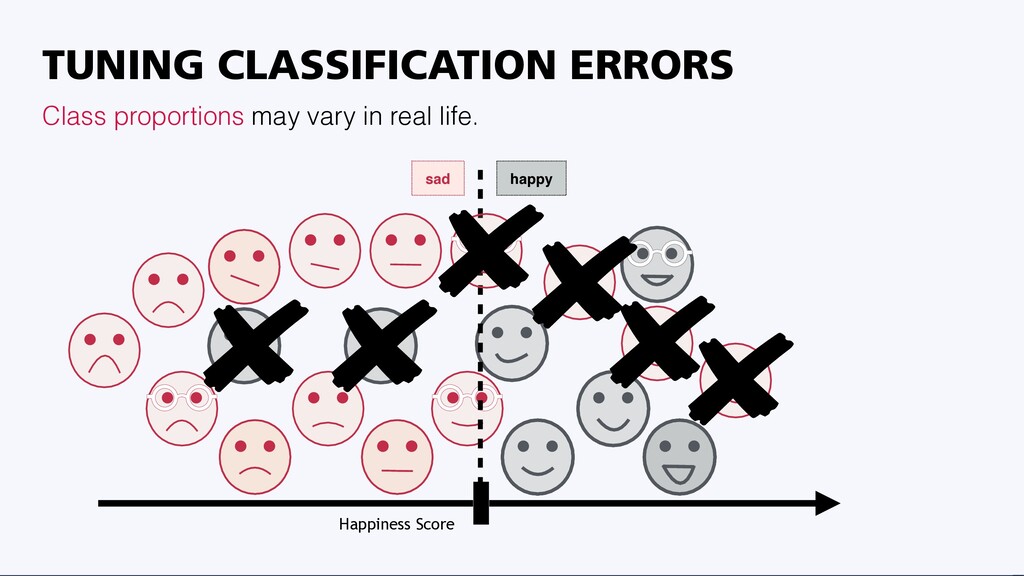
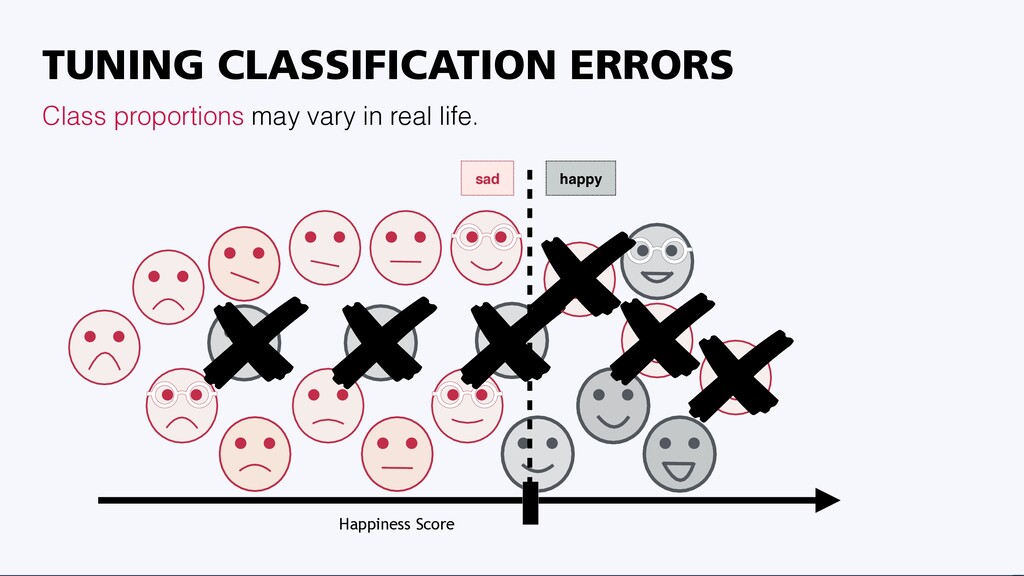
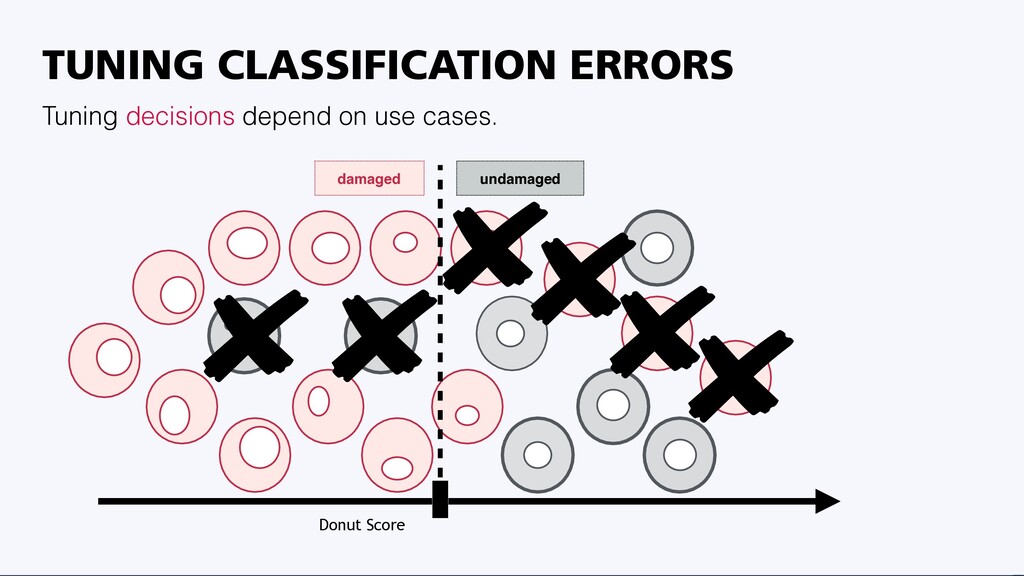
  20. TUNING CLASSIFICATION ERRORS Test sets contain examples of correct classifications,

    to measure the errors. Examples of Happy Faces Examples of 
 Sad Faces MISCLASSIFIED
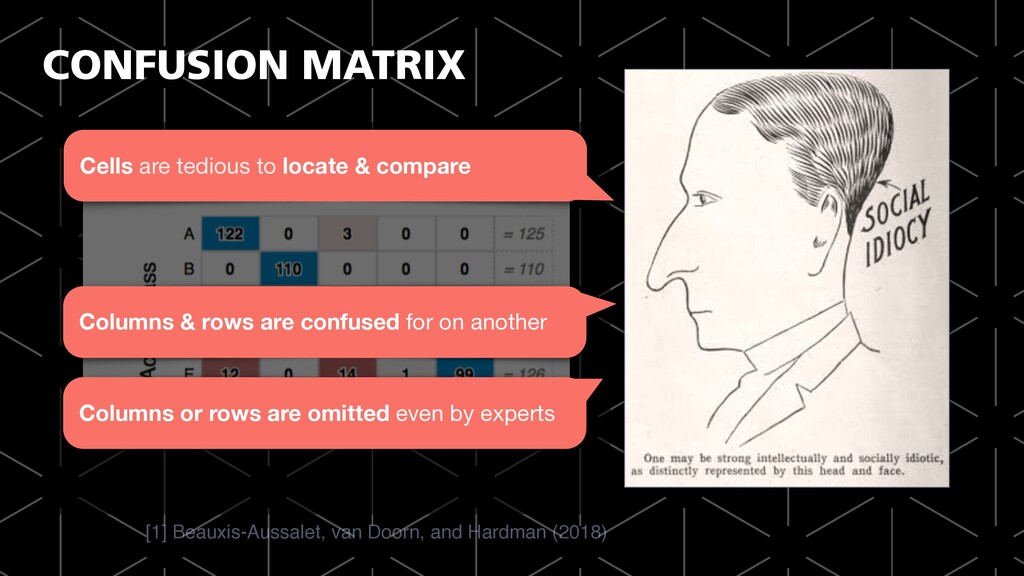
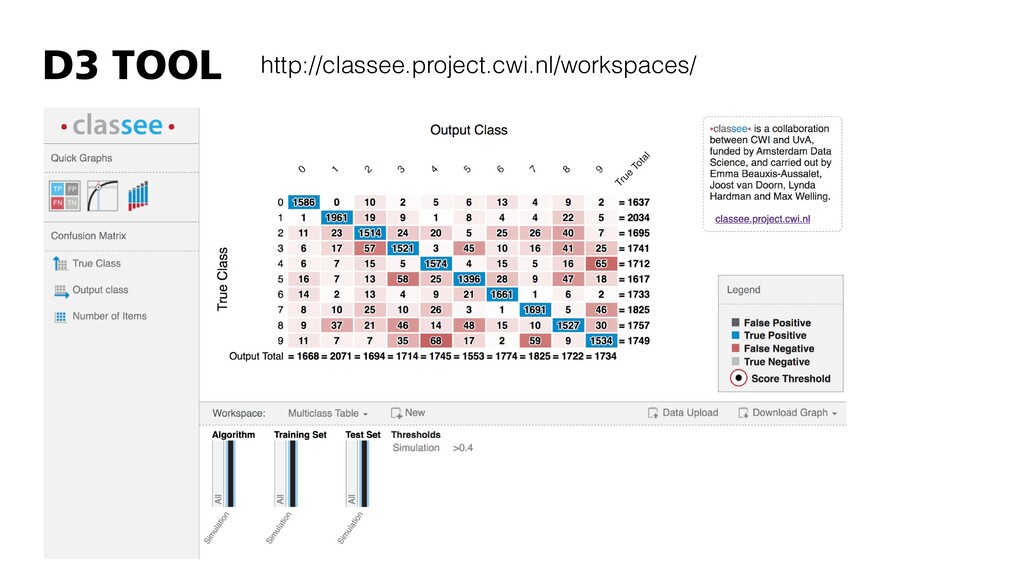
  21. Cells are tedious to locate & compare [1] Beauxis-Aussalet, van

    Doorn, and Hardman (2018) Columns & rows are confused for on another Columns or rows are omitted even by experts CONFUSION MATRIX
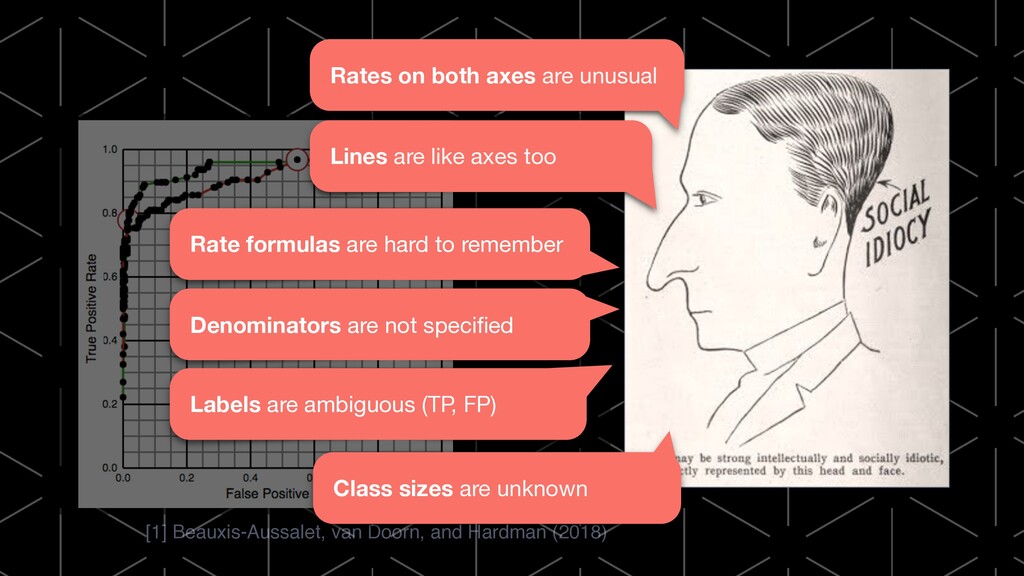
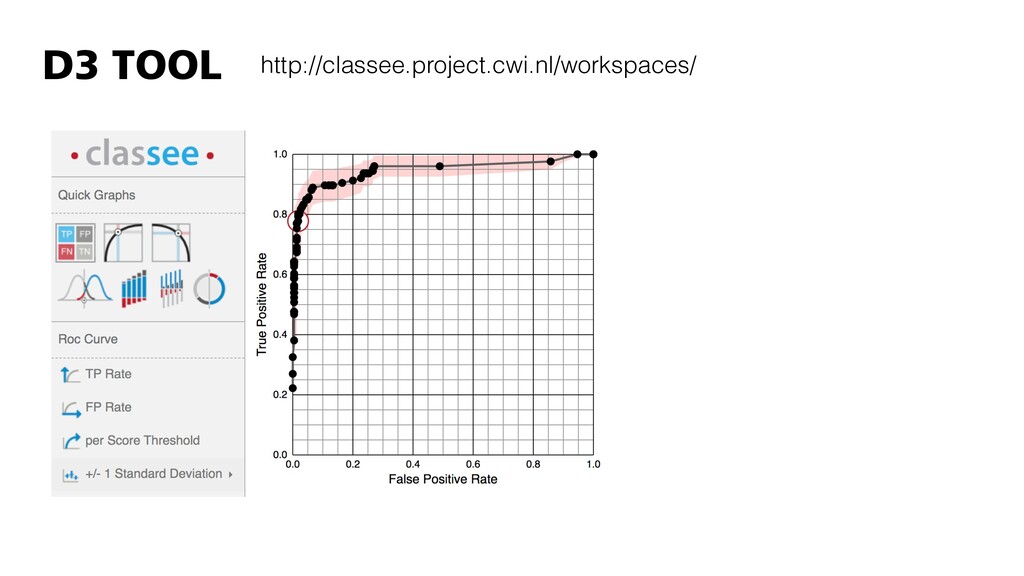
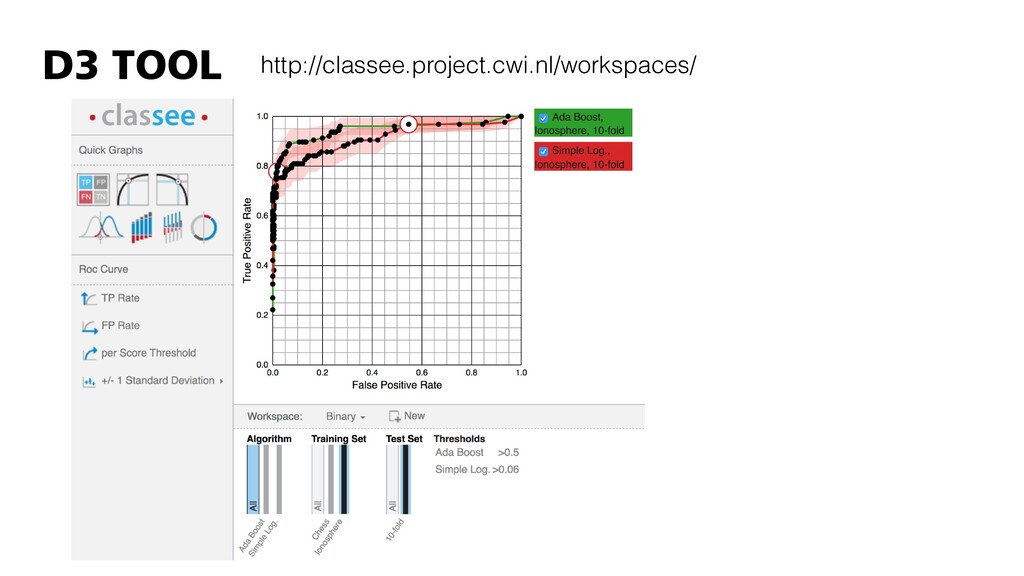
  22. [1] Beauxis-Aussalet, van Doorn, and Hardman (2018) Rates on both
    axes are unusual Lines are like axes too Class sizes are unknown Rate formulas are hard to remember Denominators are not specified Labels are ambiguous (TP, FP)
  23. Classified as Negative | Classified as Positive −1000 −500 0

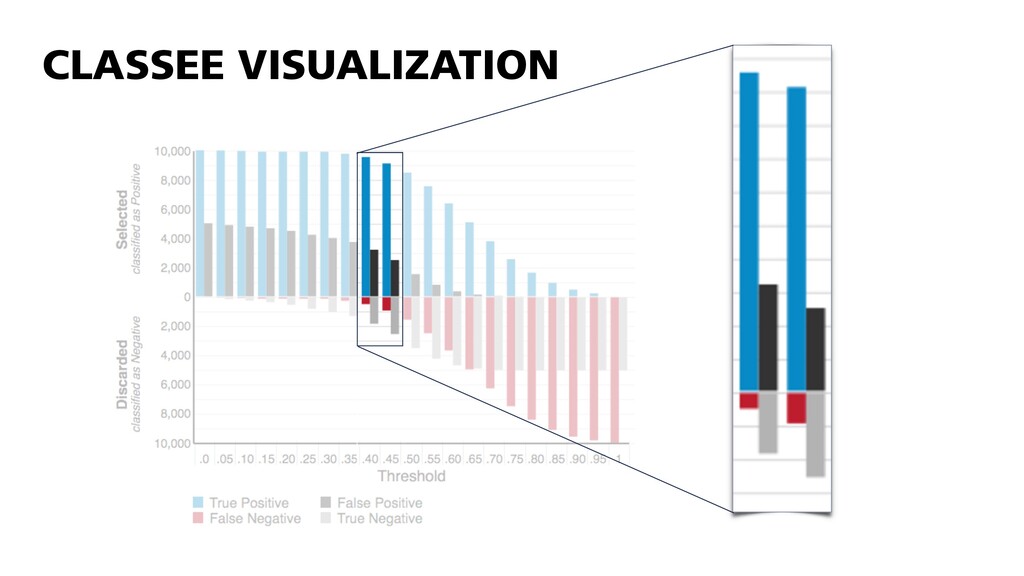
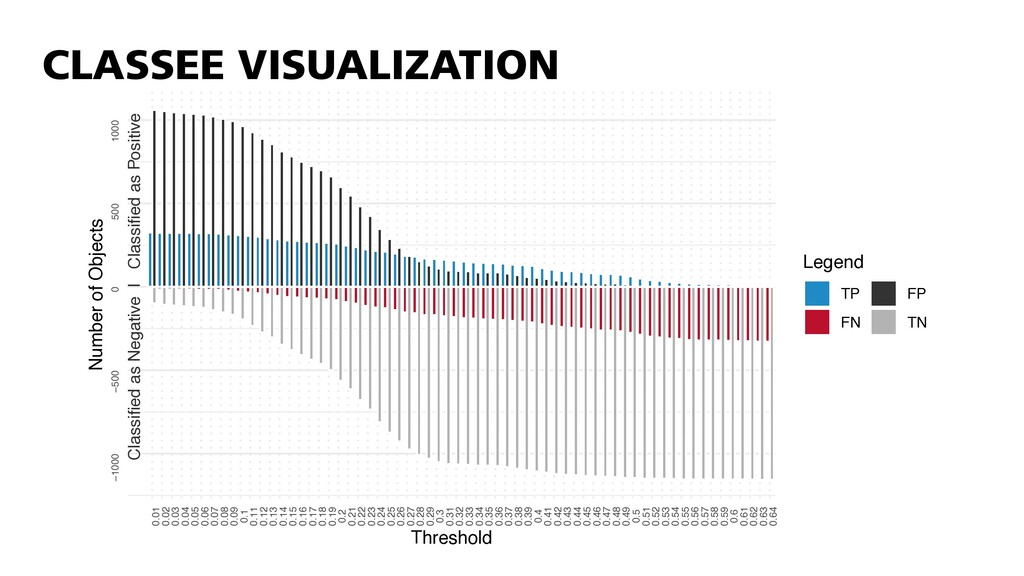
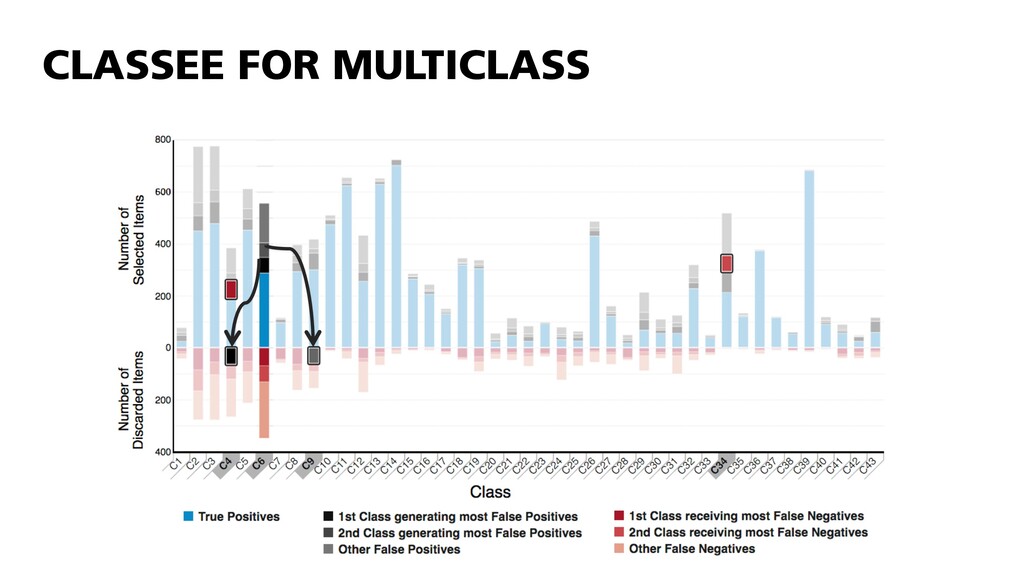
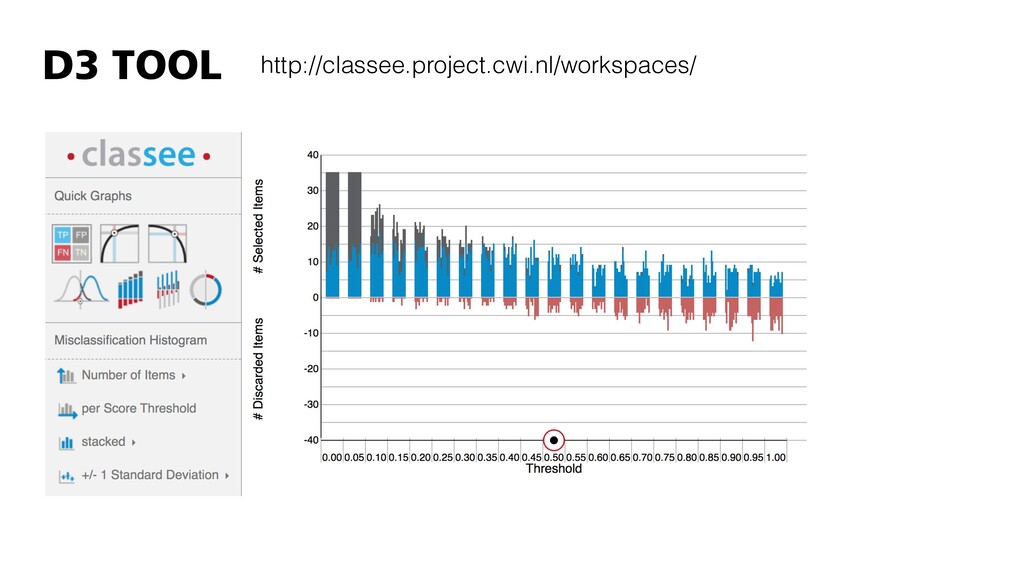
    500 1000 0.01 0.02 0.03 0.04 0.05 0.06 0.07 0.08 0.09 0.1 0.11 0.12 0.13 0.14 0.15 0.16 0.17 0.18 0.19 0.2 0.21 0.22 0.23 0.24 0.25 0.26 0.27 0.28 0.29 0.3 0.31 0.32 0.33 0.34 0.35 0.36 0.37 0.38 0.39 0.4 0.41 0.42 0.43 0.44 0.45 0.46 0.47 0.48 0.49 0.5 0.51 0.52 0.53 0.54 0.55 0.56 0.57 0.58 0.59 0.6 0.61 0.62 0.63 0.64 Threshold Number of Objects Legend TP FN FP TN CLASSEE VISUALIZATION
  24. Classified as Negative | Classified as Positive −1000 −500 0

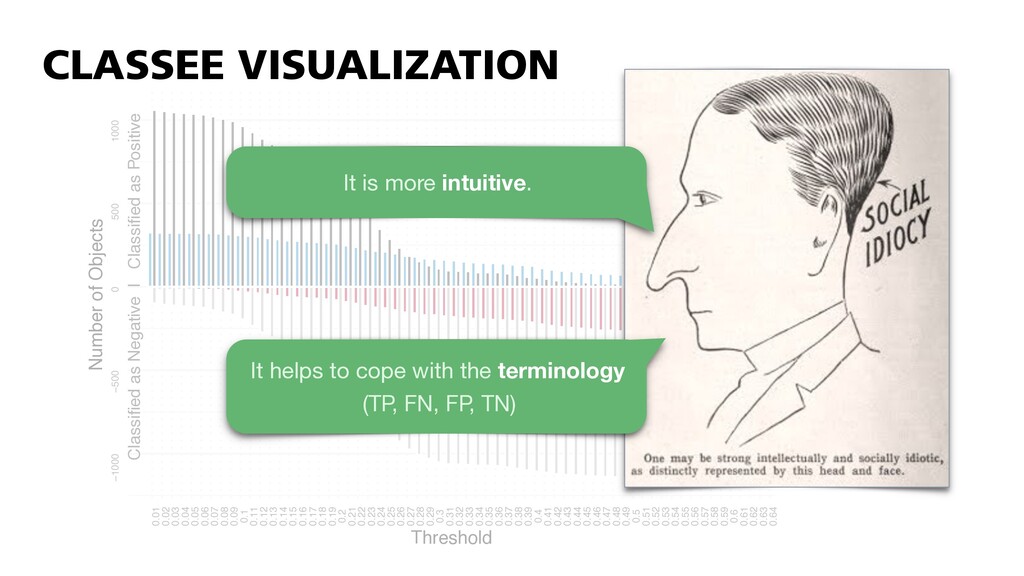
    500 1000 0.01 0.02 0.03 0.04 0.05 0.06 0.07 0.08 0.09 0.1 0.11 0.12 0.13 0.14 0.15 0.16 0.17 0.18 0.19 0.2 0.21 0.22 0.23 0.24 0.25 0.26 0.27 0.28 0.29 0.3 0.31 0.32 0.33 0.34 0.35 0.36 0.37 0.38 0.39 0.4 0.41 0.42 0.43 0.44 0.45 0.46 0.47 0.48 0.49 0.5 0.51 0.52 0.53 0.54 0.55 0.56 0.57 0.58 0.59 0.6 0.61 0.62 0.63 0.64 Threshold Number of Objects Legend TP FN FP TN It is more intuitive. It helps to cope with the terminology
 (TP, FN, FP, TN) CLASSEE VISUALIZATION
  25. Sign B Sign C Sign A Sign D Sign N

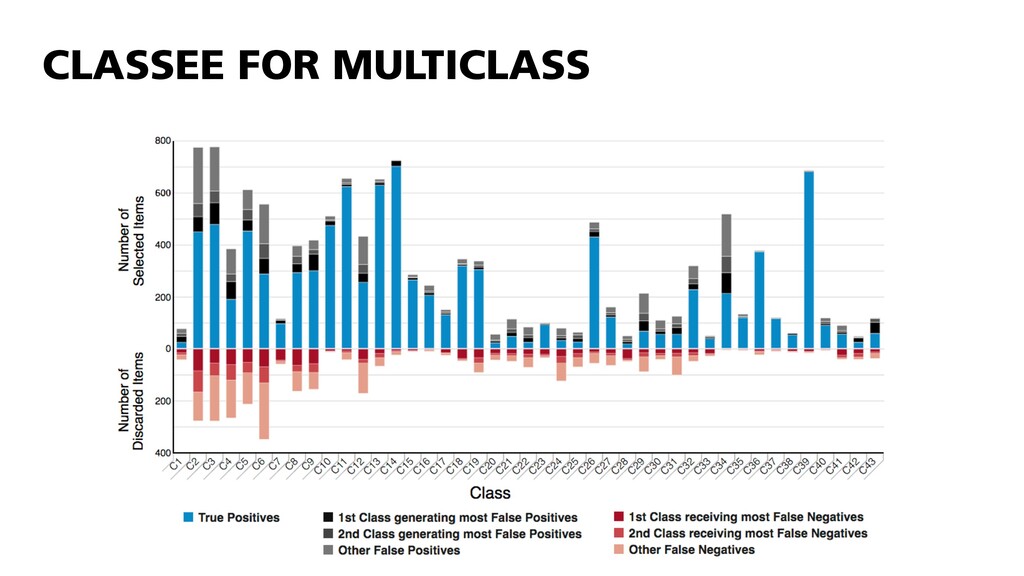
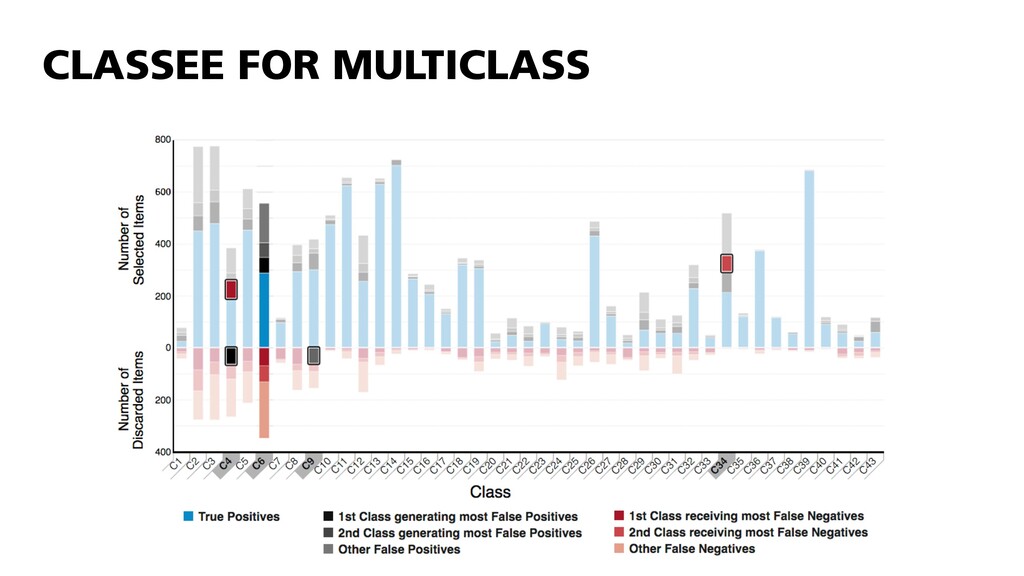
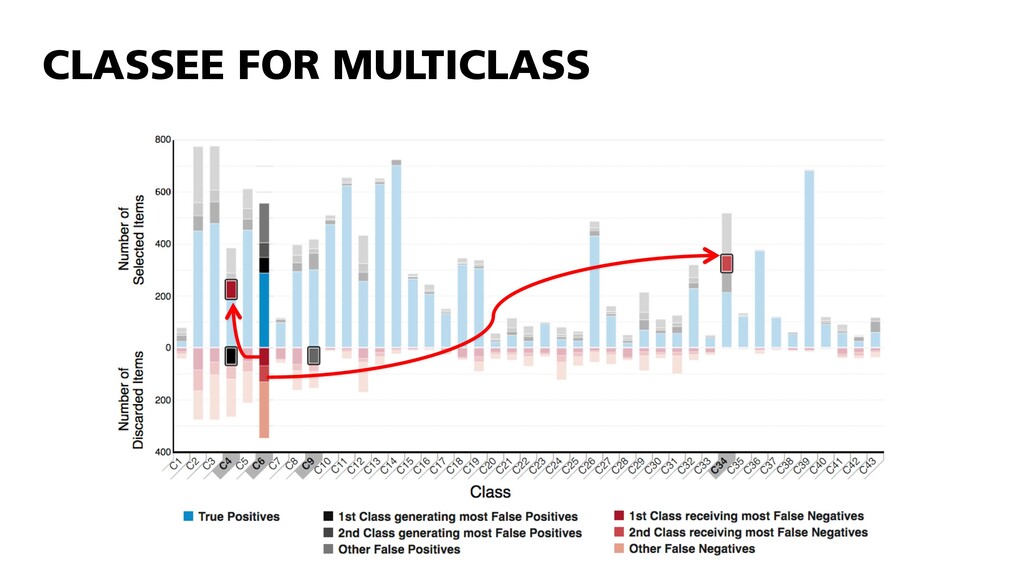
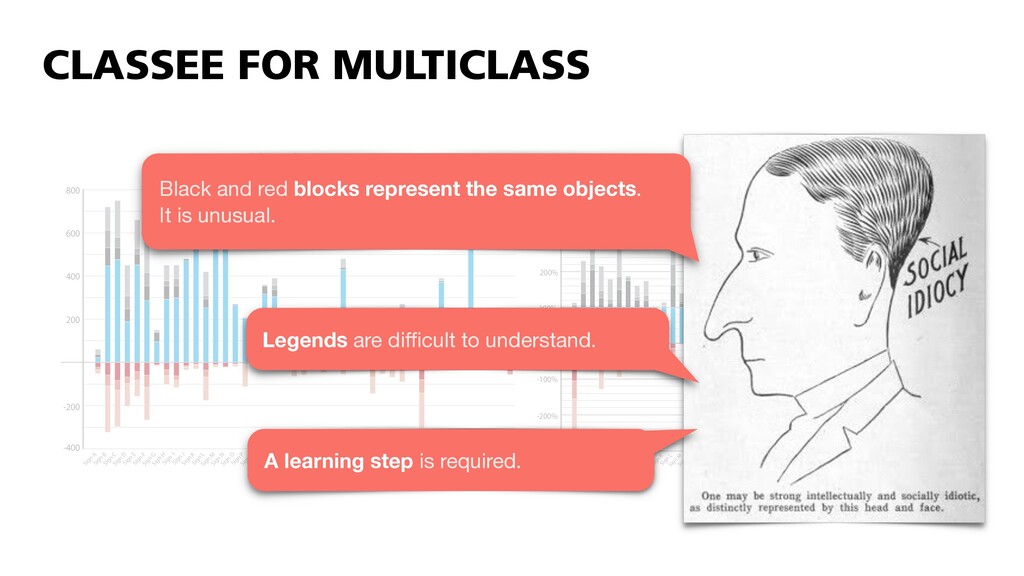
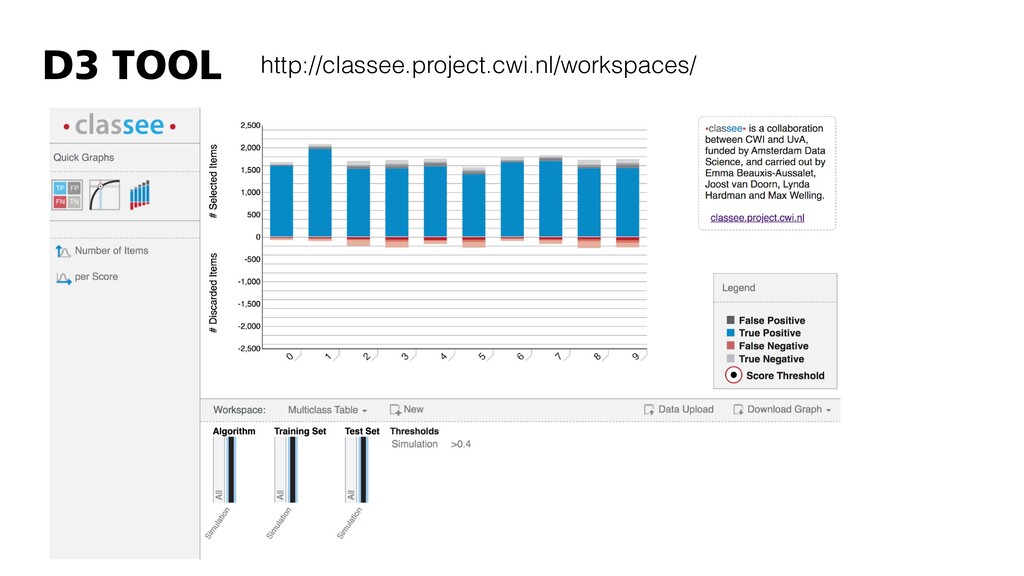
    Sign M Sign L Sign K Sign J Sign I Sign H Sign G Sign F Sign E Sign O Sign Q Sign R Sign P Sign S Sign AC Sign AB Sign AA Sign Z Sign Y Sign X Sign W Sign V Sign U Sign T Sign AD Sign AF Sign AG Sign AH Sign AI Sign AE Sign AK Sign AJ Sign AQ Sign AP Sign AO Sign AN Sign AM Sign AL 100% 200% 300% 400% Detected Missed Legend: -300% -200% -100% -400 -200 200 400 600 800 Sign B Sign C Sign A Sign D Sign N Sign M Sign L Sign K Sign J Sign I Sign H Sign G Sign F Sign E Sign O Sign Q Sign R Sign P Sign S Sign AC Sign AB Sign AA Sign Z Sign Y Sign X Sign W Sign V Sign U Sign T Sign AD Sign AF Sign AG Sign AH Sign AI Sign AE Sign AK Sign AJ Sign AQ Sign AP Sign AO Sign AN Sign AM Sign AL Legend: Numbers Proportions Black and red blocks represent the same objects. 
 It is unusual. Legends are difficult to understand. A learning step is required. CLASSEE FOR MULTICLASS
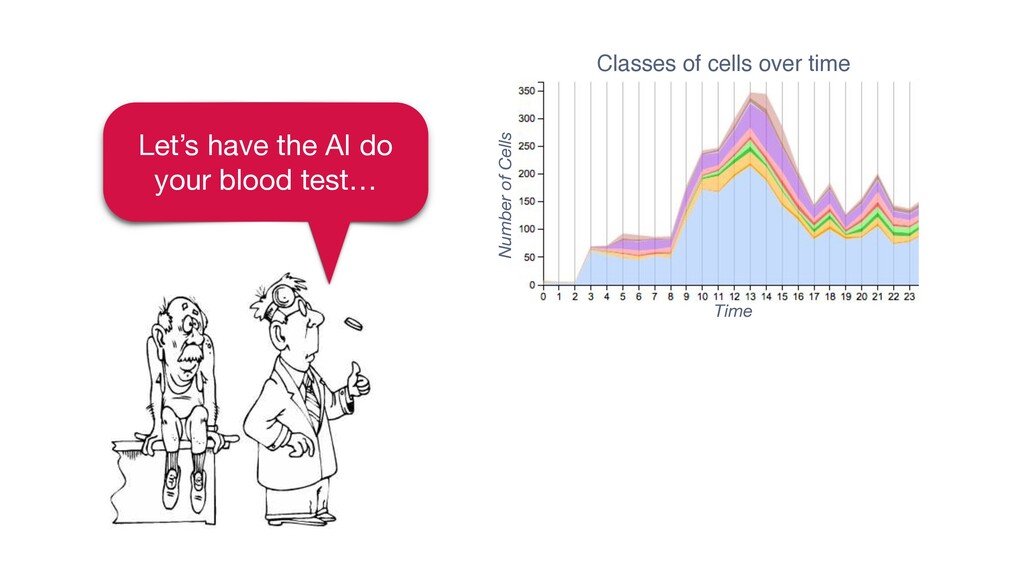
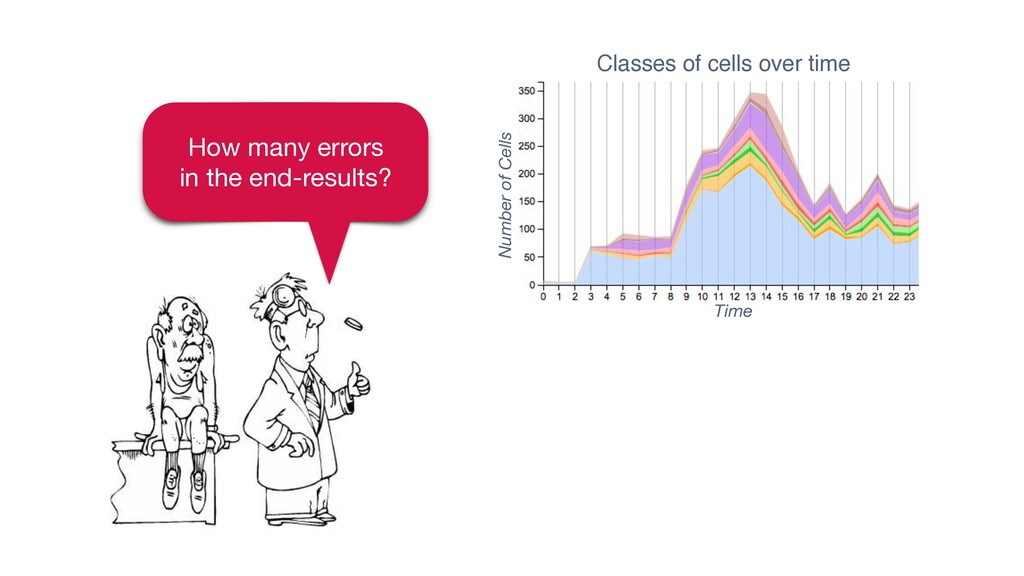
  26. Time Classes of cells over time Number of Cells Class

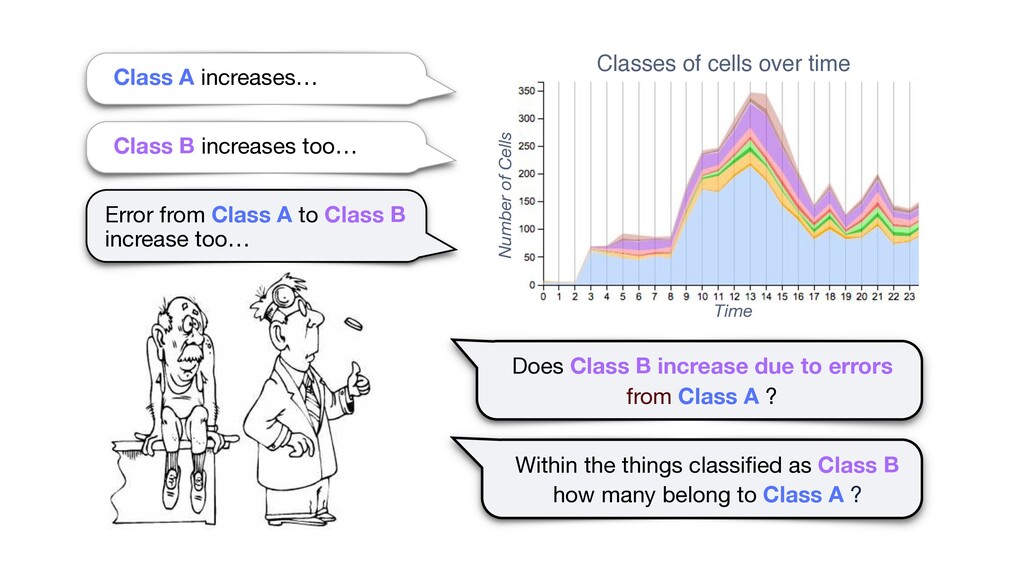
    A increases… Class B increases too… Error from Class A to Class B increase too… Does Class B increase due to errors from Class A ? Within the things classified as Class B 
 how many belong to Class A ?
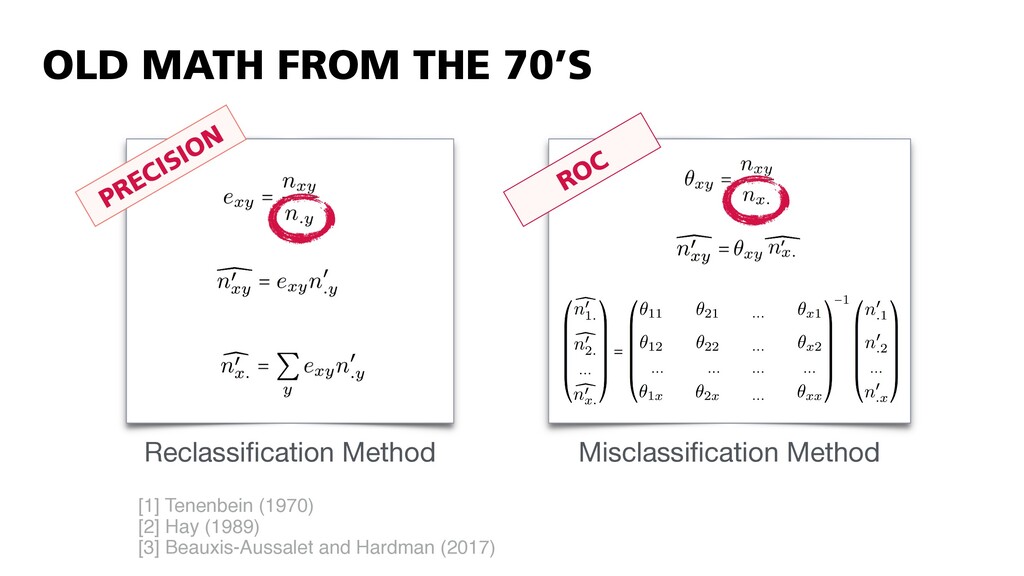
  27. Reclassification Method [1] Tenenbein (1970) 
 [2] Hay (1989) 


    [3] Beauxis-Aussalet and Hardman (2017) Misclassification Method PRECISION ROC OLD MATH FROM THE 70’S
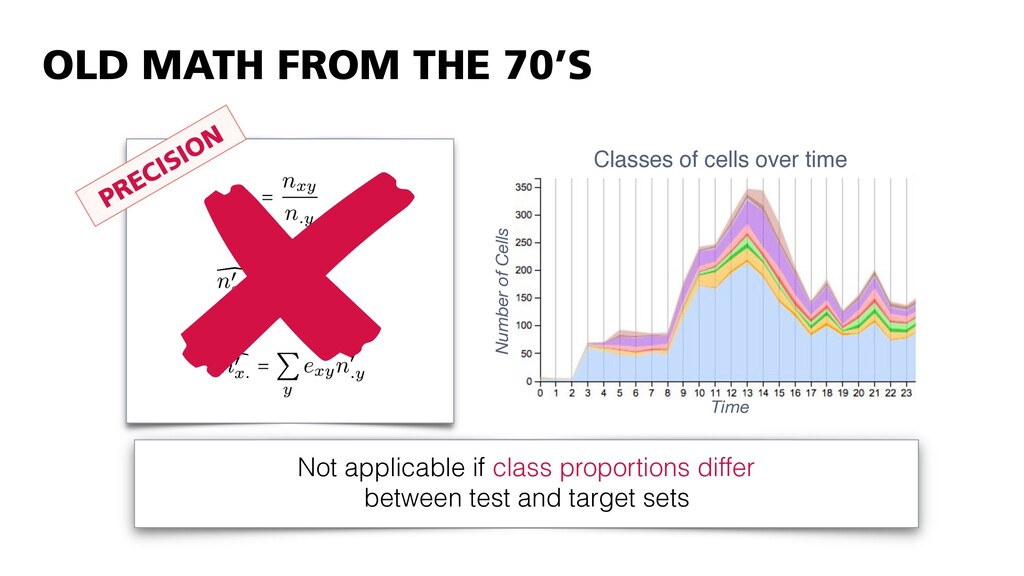
  28. Reclassification Method PRECISION OLD MATH FROM THE 70’S Not applicable

    if class proportions differ 
 between test and target sets Time Classes of cells over time Number of Cells
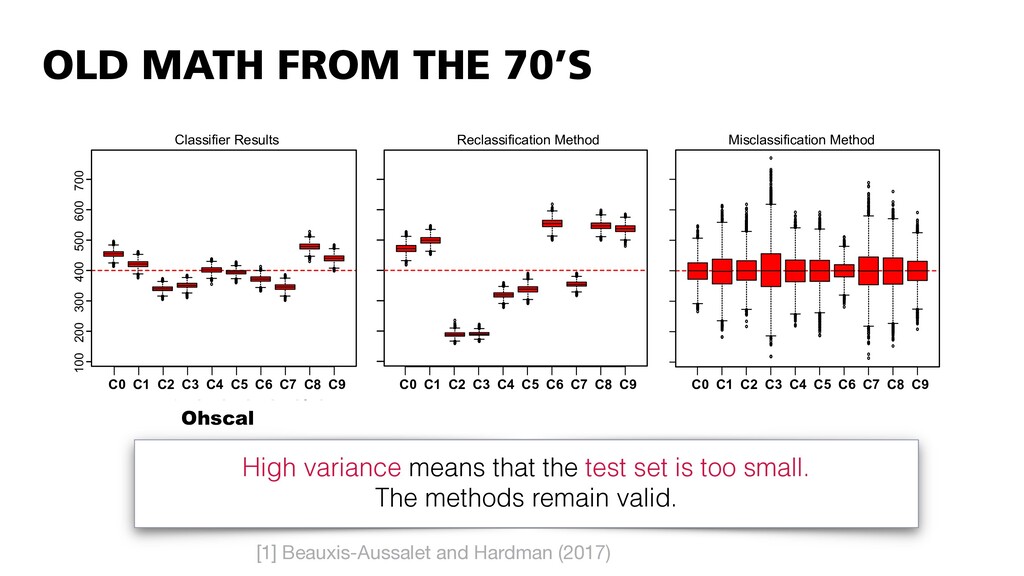
  29. OLD MATH FROM THE 70’S High variance means that the

    test set is too small. The methods remain valid. c) Segment d) Ohscal 50 1 C1 C 50 1 C1 C2 C3 C4 C5 C6 C7 50 1 C1 C2 C3 C4 C5 C6 C7 C0 C1 C2 C3 C4 C5 C6 C7 C8 C9 Misclassification Method C0 C1 C C0 C1 C2 C3 C4 C5 C6 C7 C8 C9 Classifier Results 1000 1400 Reclassification Method 1000 1400 Misclassification Method 1000 1400 Classifier Results 1000 1200 1000 1200 Classifier Results Mis 100 200 300 400 500 600 700 c) Segment d) Ohscal 50 1 C1 C2 C3 C4 C5 C6 C7 C6 C7 50 1 C1 C2 C3 C4 C5 C6 C7 C0 C1 C2 C3 C4 C5 C6 C7 C8 C9 Misclassification Method C0 C1 C2 C3 C4 C5 C6 C7 C8 C9 Reclassification Method C6 C7 C8 C9 ults 1000 1400 Reclassification Method sification Method 1000 1200 1000 1200 1000 1200 Reclass. Meth. Classifier Results Misclass. Meth. c) Segment d) Ohscal 50 1 C1 C2 C3 C4 C5 C6 C7 50 1 C1 C2 C3 C4 C5 C6 C7 50 1 C1 C2 C3 C4 C5 C6 C7 C0 C1 C2 C3 C4 C5 C6 C7 C8 C9 Misclassification Method C0 C1 C2 C3 C4 C5 C6 C7 C8 C9 Reclassification Method C0 C1 C2 C3 C4 C5 C6 C7 C8 C9 Classifier Results 1000 1400 Reclassification Method 1000 1400 Misclassification Method 1000 1400 Classifier Results 1000 1200 1000 1200 1000 1200 Reclass. Meth. Classifier Results Misclass. Meth. 100 200 300 400 500 600 700 c) Segment d) Ohscal 50 100 C1 C2 C3 C4 C5 C6 C7 C7 50 100 C1 C2 C3 C4 C5 C6 C7 C0 C1 C2 C3 C4 C5 C6 C7 C8 C9 Misclassification Method C0 C1 C2 C3 C4 C5 C6 C7 C8 C9 Reclassification Method C7 C8 C9 000 1400 Reclassification Method ation Method 1000 1200 1000 1200 1000 1200 Reclass. Meth. Classifier Results Misclass. Meth. [1] Beauxis-Aussalet and Hardman (2017)
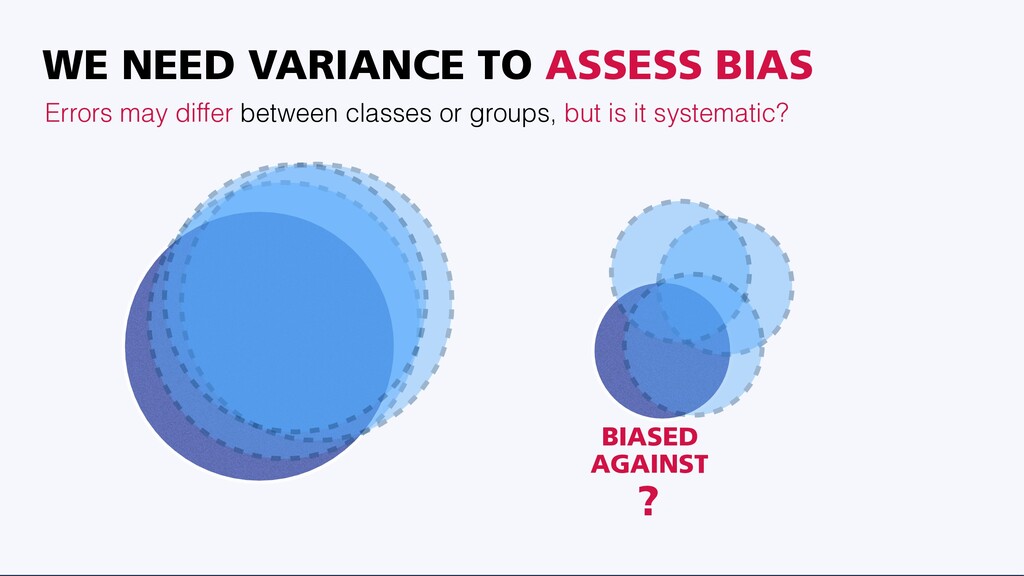
  30. Errors may differ between classes or groups, but is it

    systematic? ? BIASED AGAINST WE NEED VARIANCE TO ASSESS BIAS
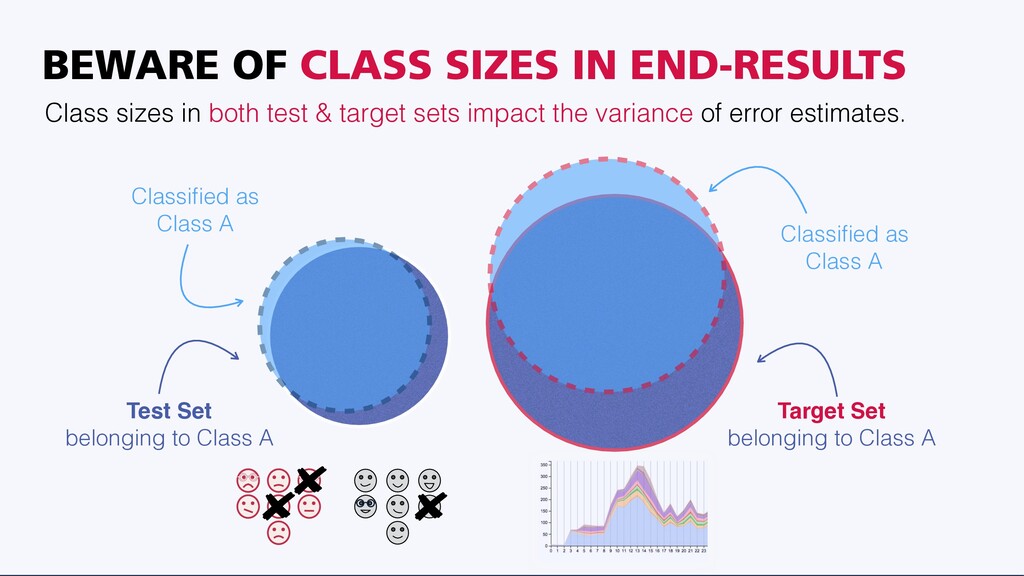
  31. Target Set 
 belonging to Class A Classified as 


    Class A Classified as 
 Class A Test Set 
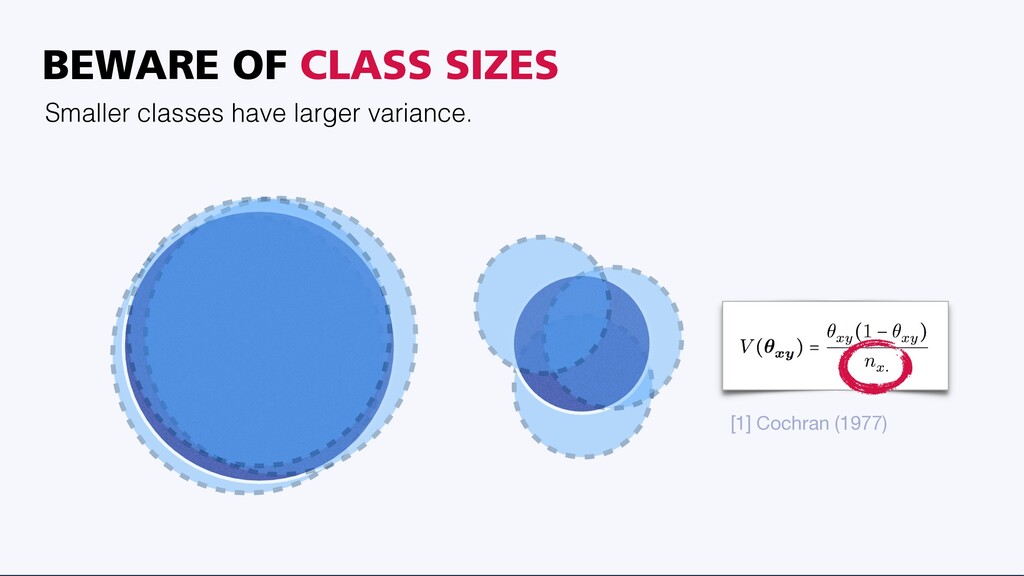
 belonging to Class A BEWARE OF CLASS SIZES IN END-RESULTS Class sizes in both test & target sets impact the variance of error estimates.
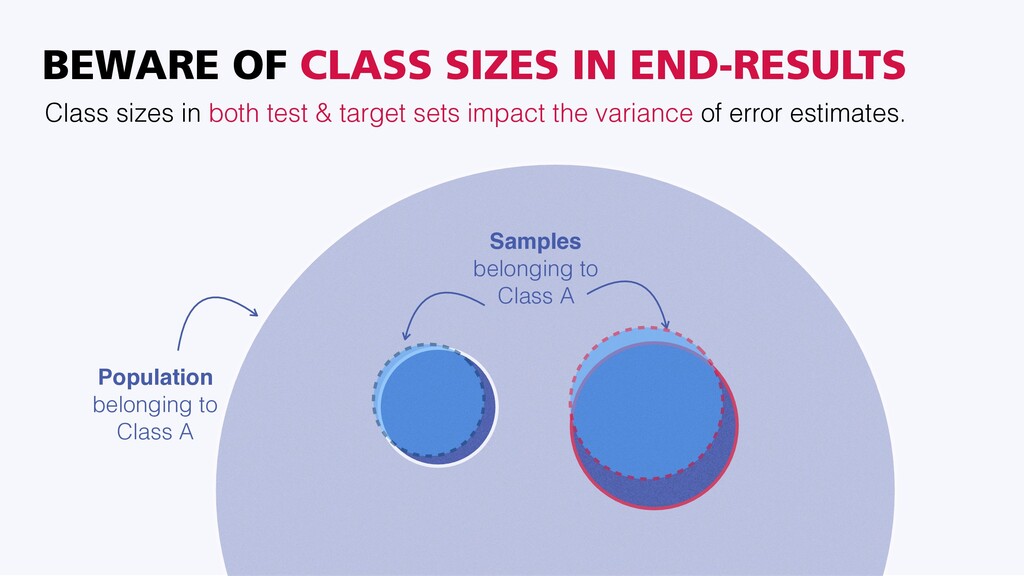
  32. Population 
 belonging to 
 Class A Samples 
 belonging

    to 
 Class A BEWARE OF CLASS SIZES IN END-RESULTS Class sizes in both test & target sets impact the variance of error estimates.
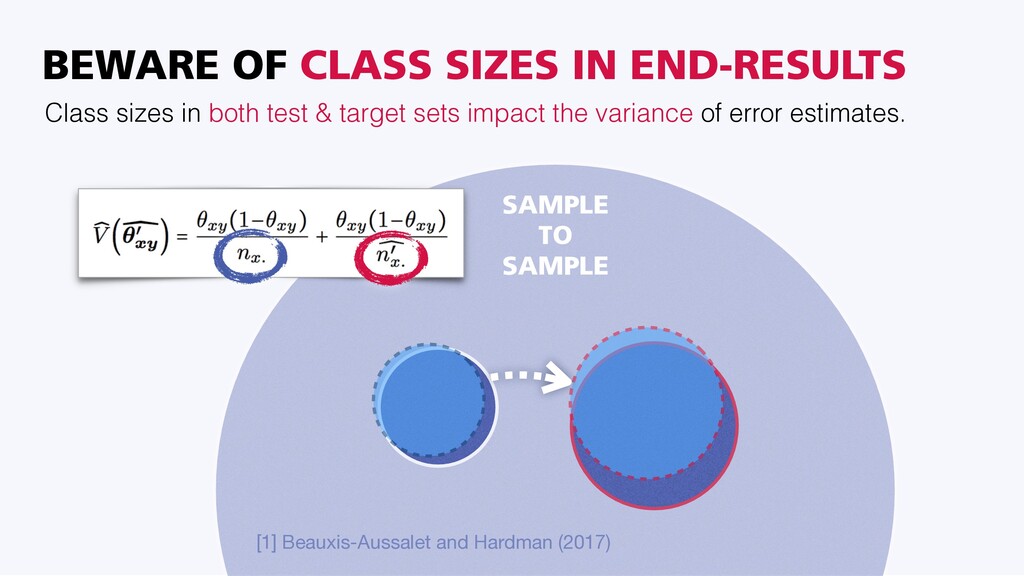
  33. [1] Beauxis-Aussalet and Hardman (2017) SAMPLE 
 TO 
 SAMPLE

    BEWARE OF CLASS SIZES IN END-RESULTS Class sizes in both test & target sets impact the variance of error estimates.
  34. COURSE COMING UP! Get the details in our next newsletters

    (scroll down our website). https://digitalsocietyschool.org/courses/
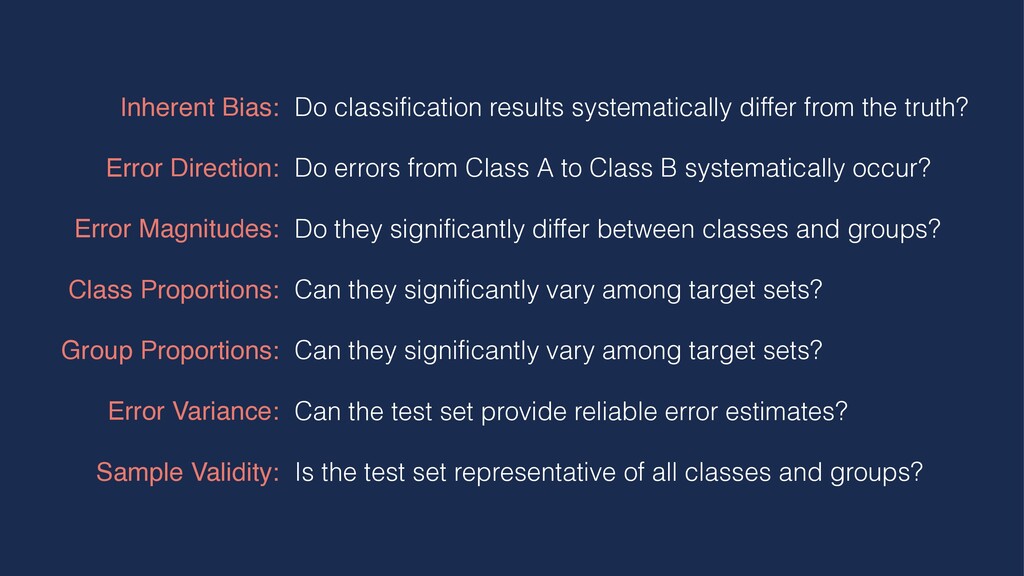
  35. Do classification results systematically differ from the truth? Do errors

    from Class A to Class B systematically occur? Do they significantly differ between classes and groups? Can they significantly vary among target sets? Can they significantly vary among target sets? Can the test set provide reliable error estimates? Is the test set representative of all classes and groups? Inherent Bias: Error Direction: Error Magnitudes: Class Proportions: Group Proportions: Error Variance: Sample Validity:
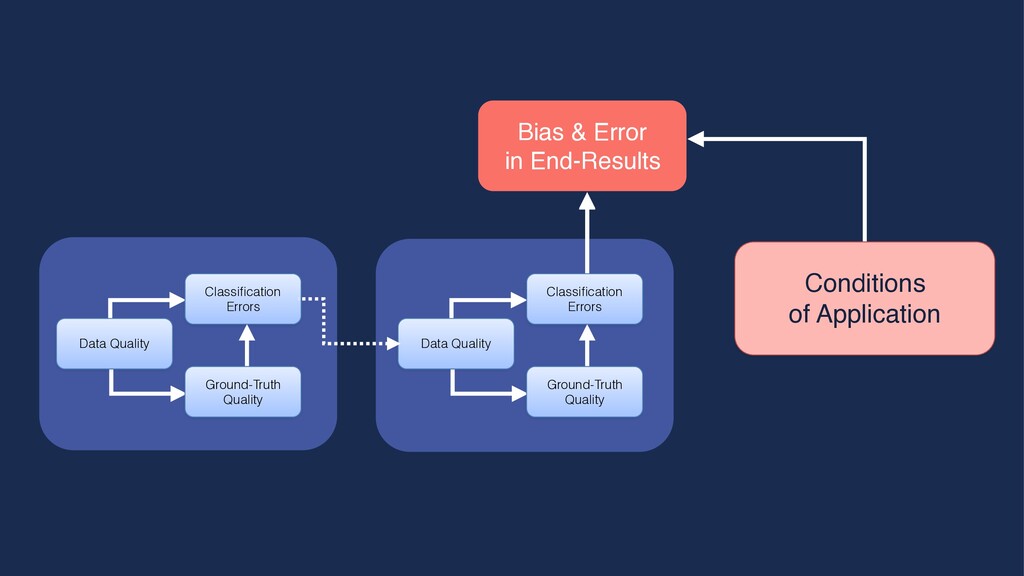
  36. Bias & Error
 in End-Results Classification 
 Errors Ground-Truth Quality

    Classification 
 Errors Data Quality Ground-Truth Quality Classification 
 Errors Data Quality Ground-Truth Quality Data Quality Classification 
 Errors Conditions
 of Application