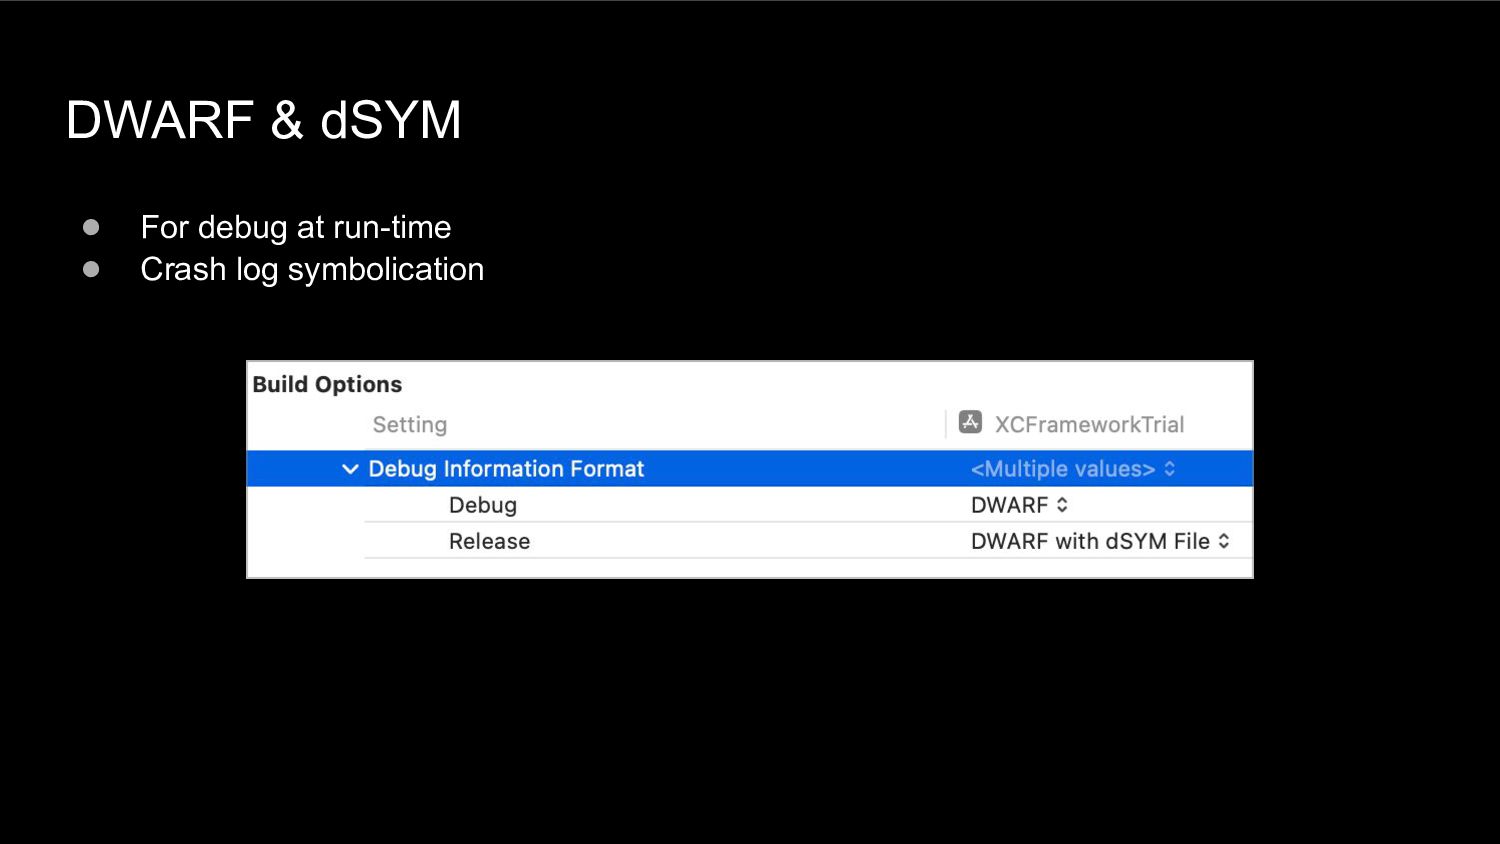
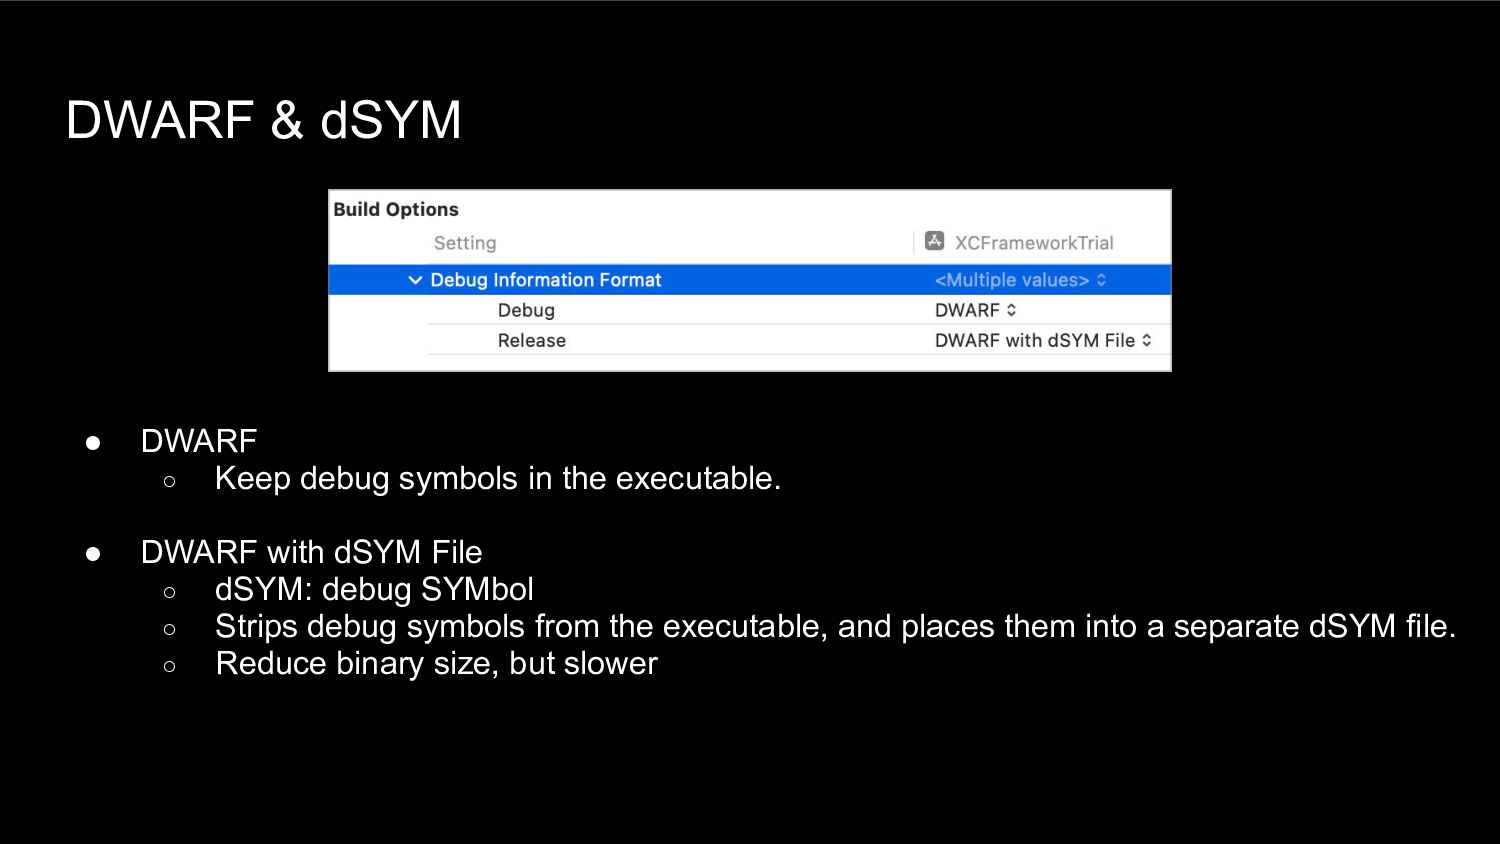
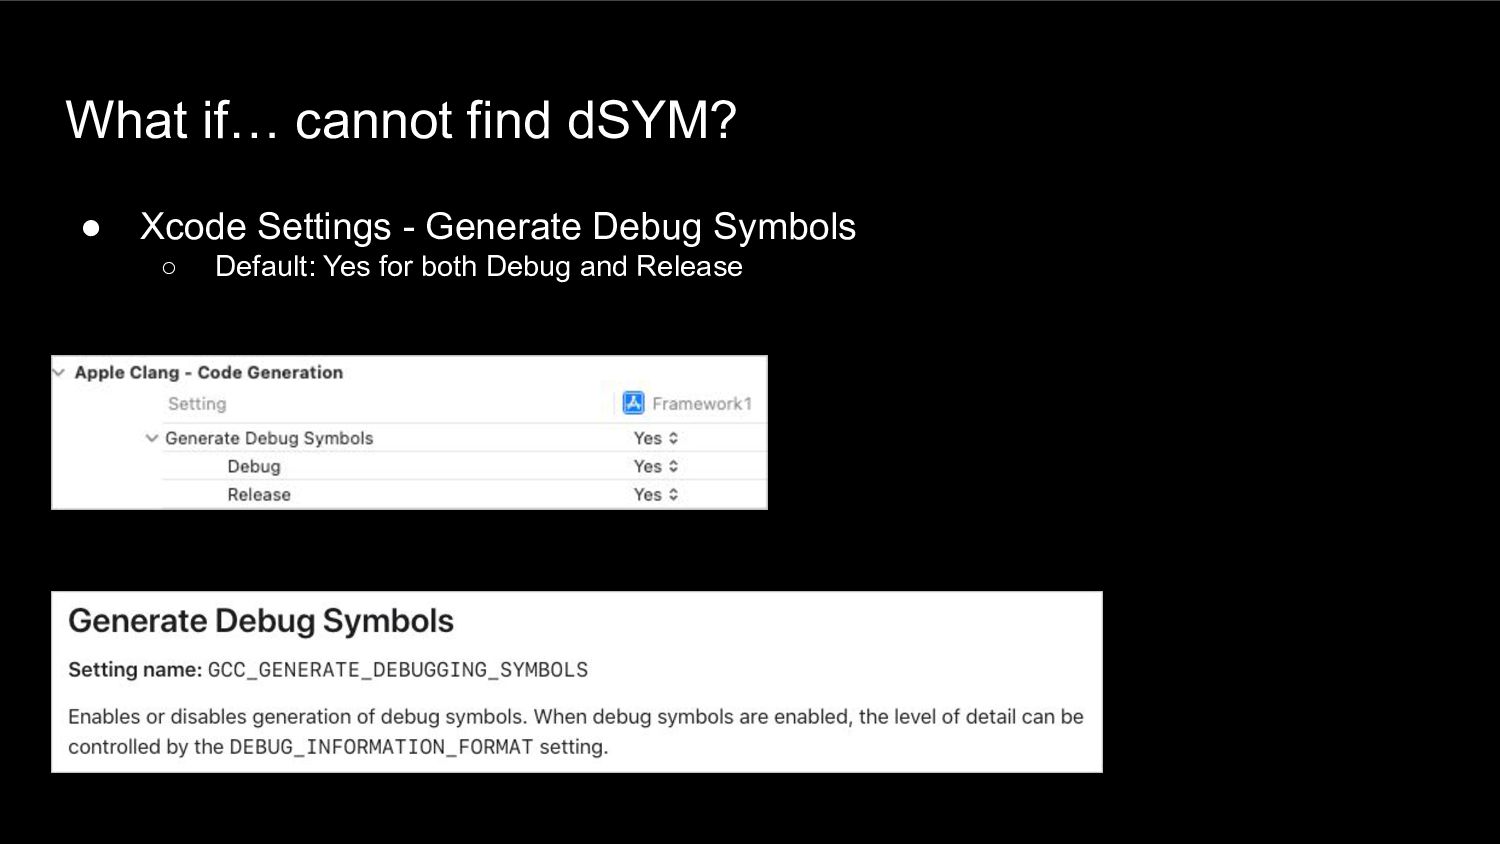
the executable. • DWARF with dSYM File ◦ dSYM: debug SYMbol ◦ Strips debug symbols from the executable, and places them into a separate dSYM file. ◦ Reduce binary size, but slower
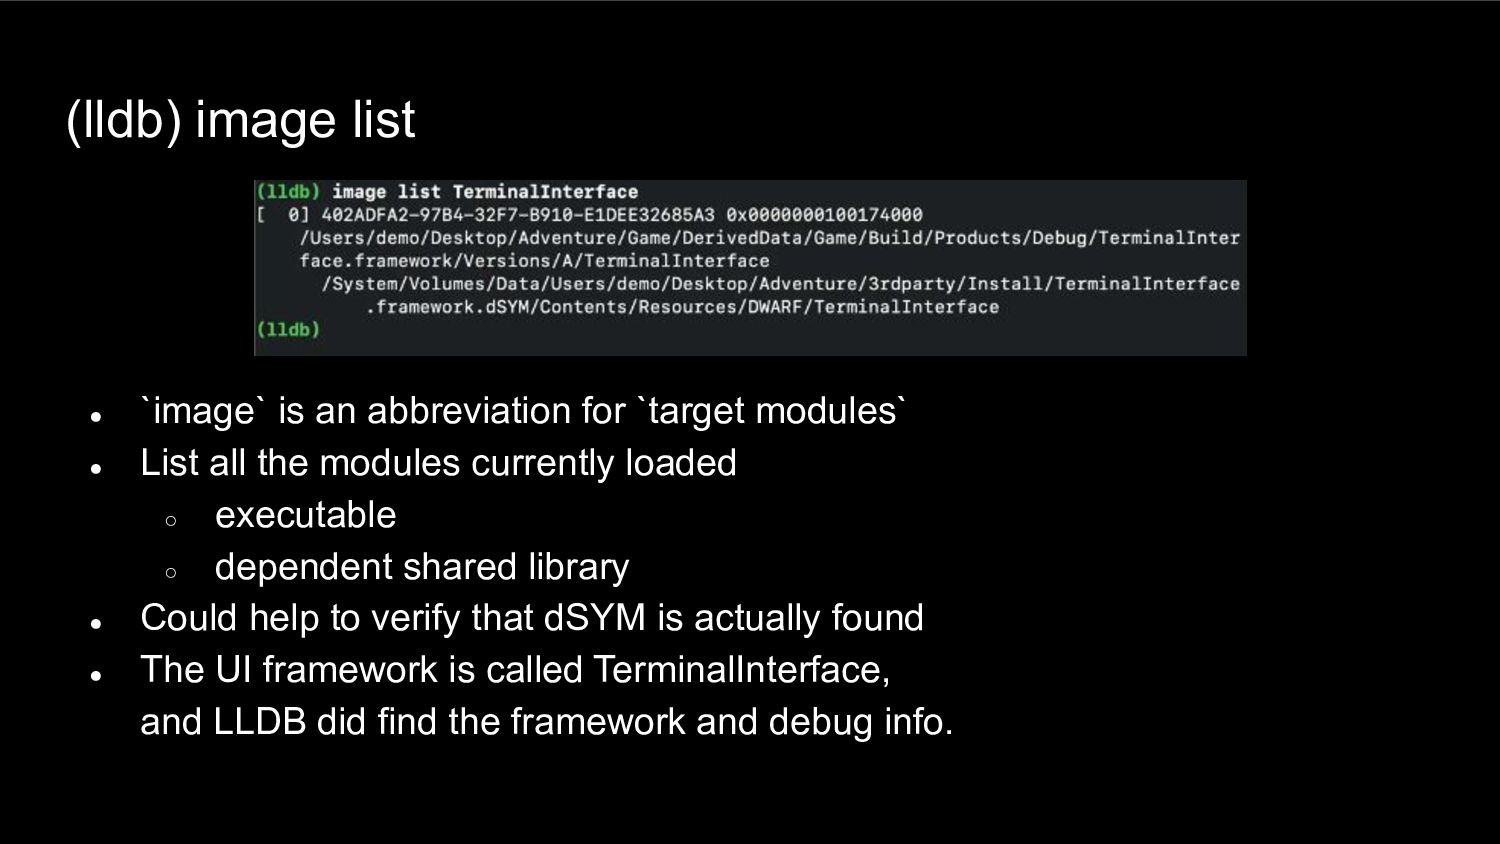
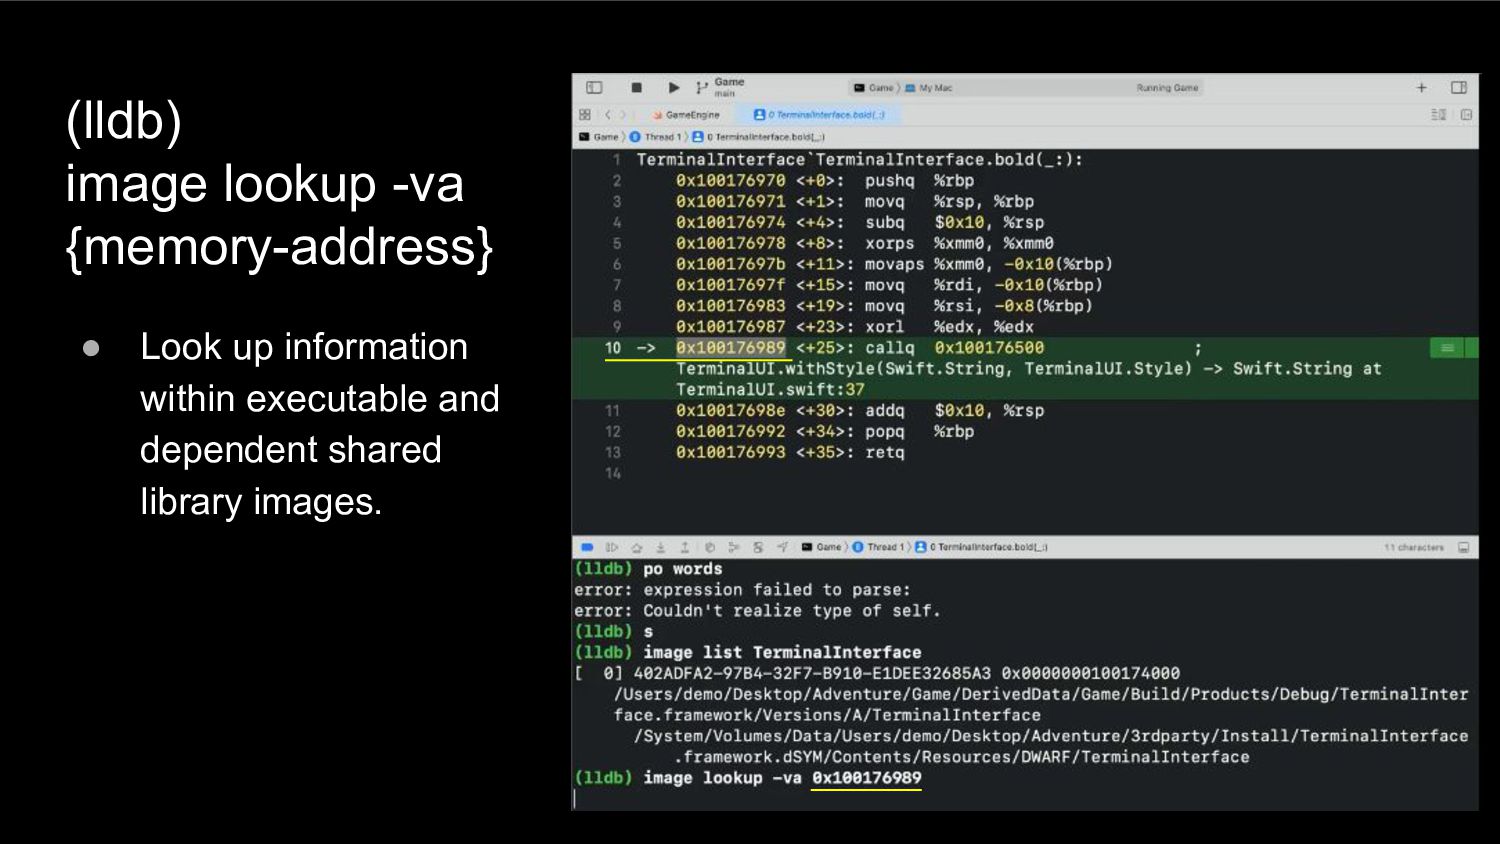
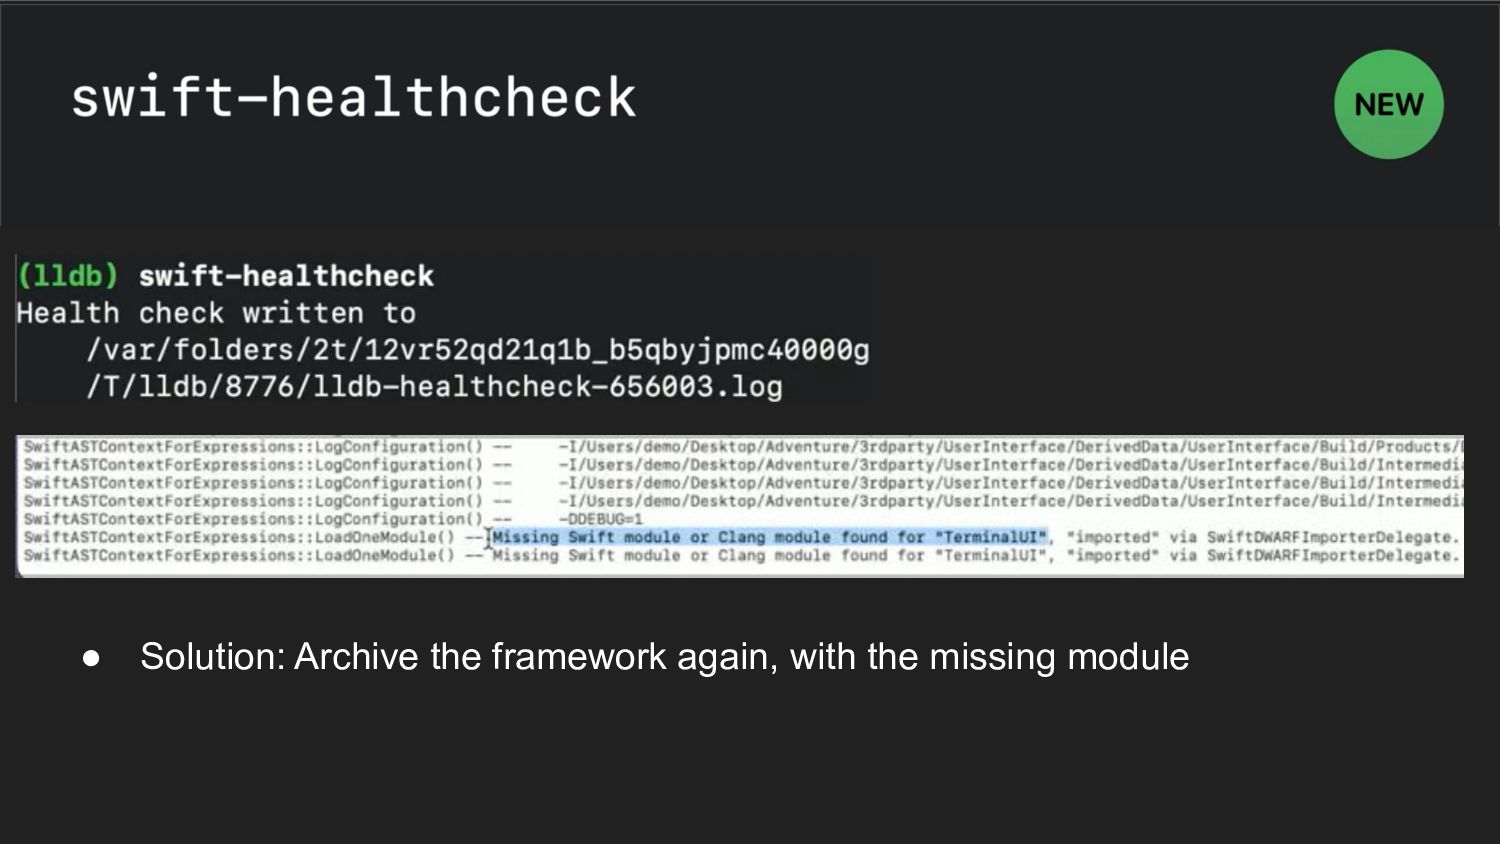
modules` • List all the modules currently loaded ◦ executable ◦ dependent shared library • Could help to verify that dSYM is actually found • The UI framework is called TerminalInterface, and LLDB did find the framework and debug info.
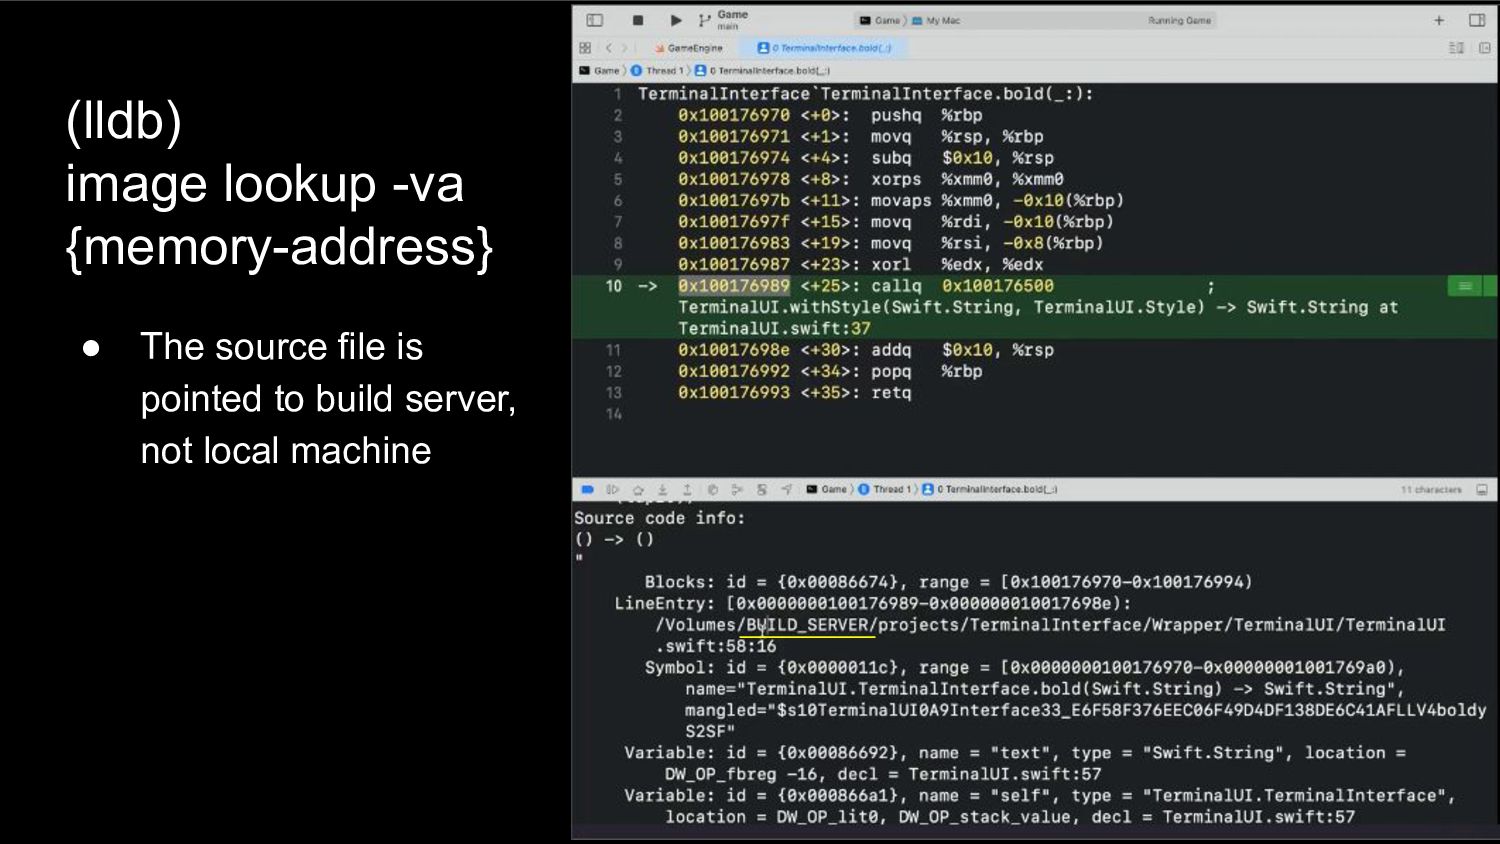
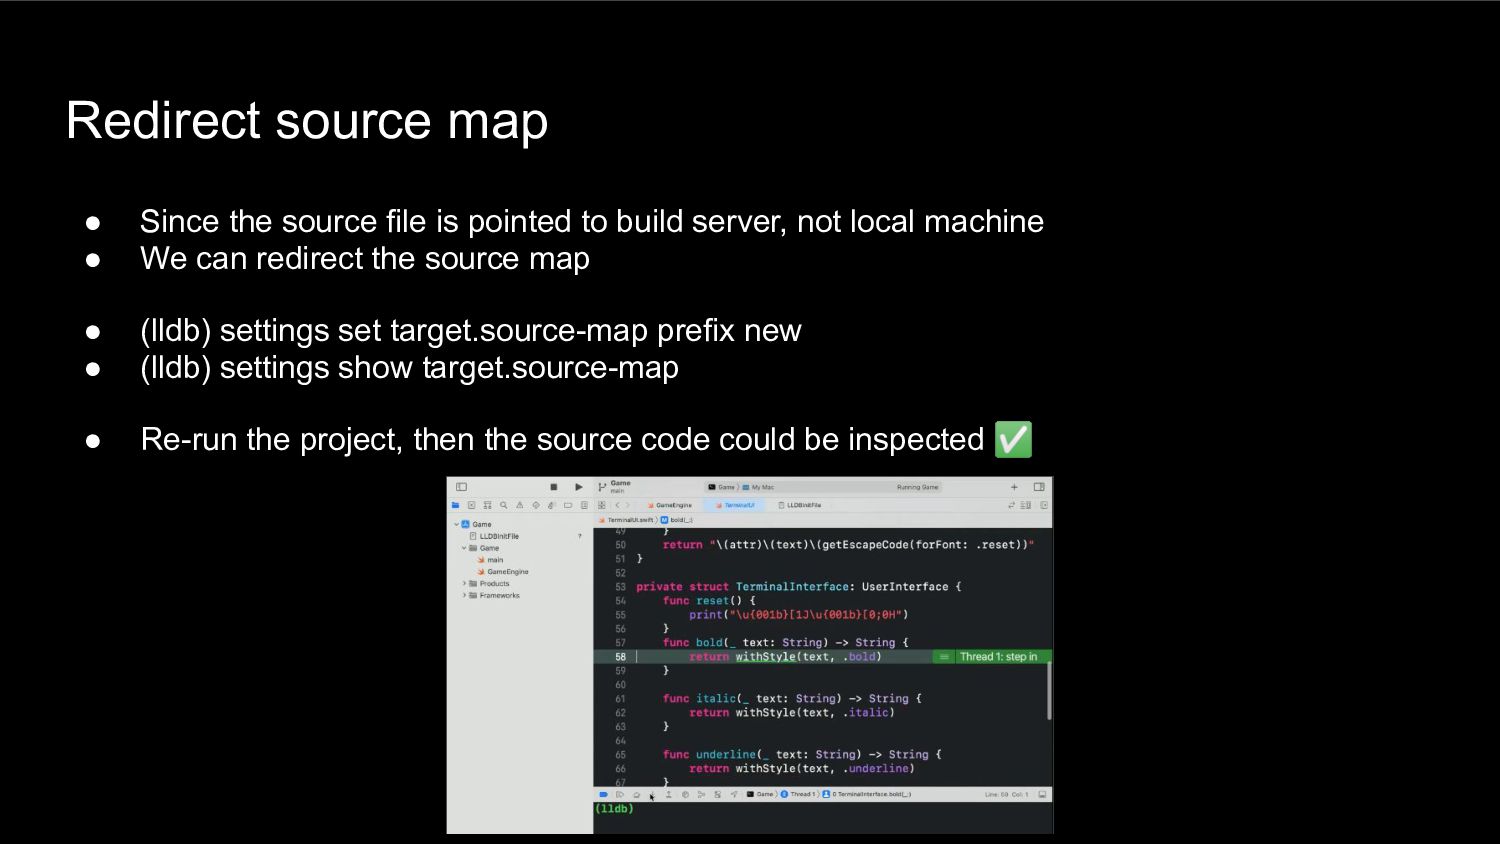
to build server, not local machine • We can redirect the source map • (lldb) settings set target.source-map prefix new • (lldb) settings show target.source-map • Re-run the project, then the source code could be inspected ✅
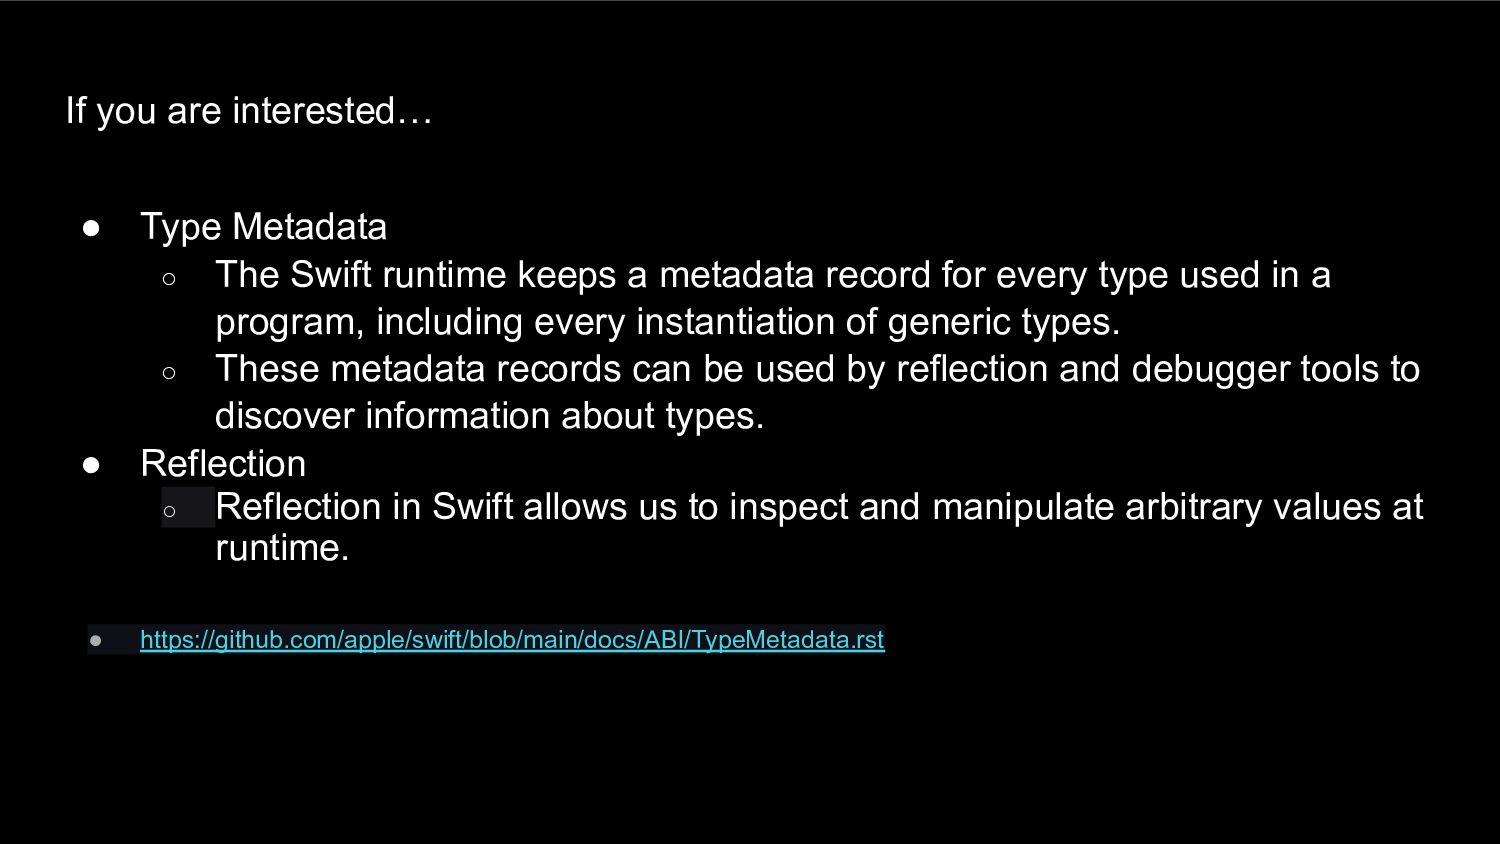
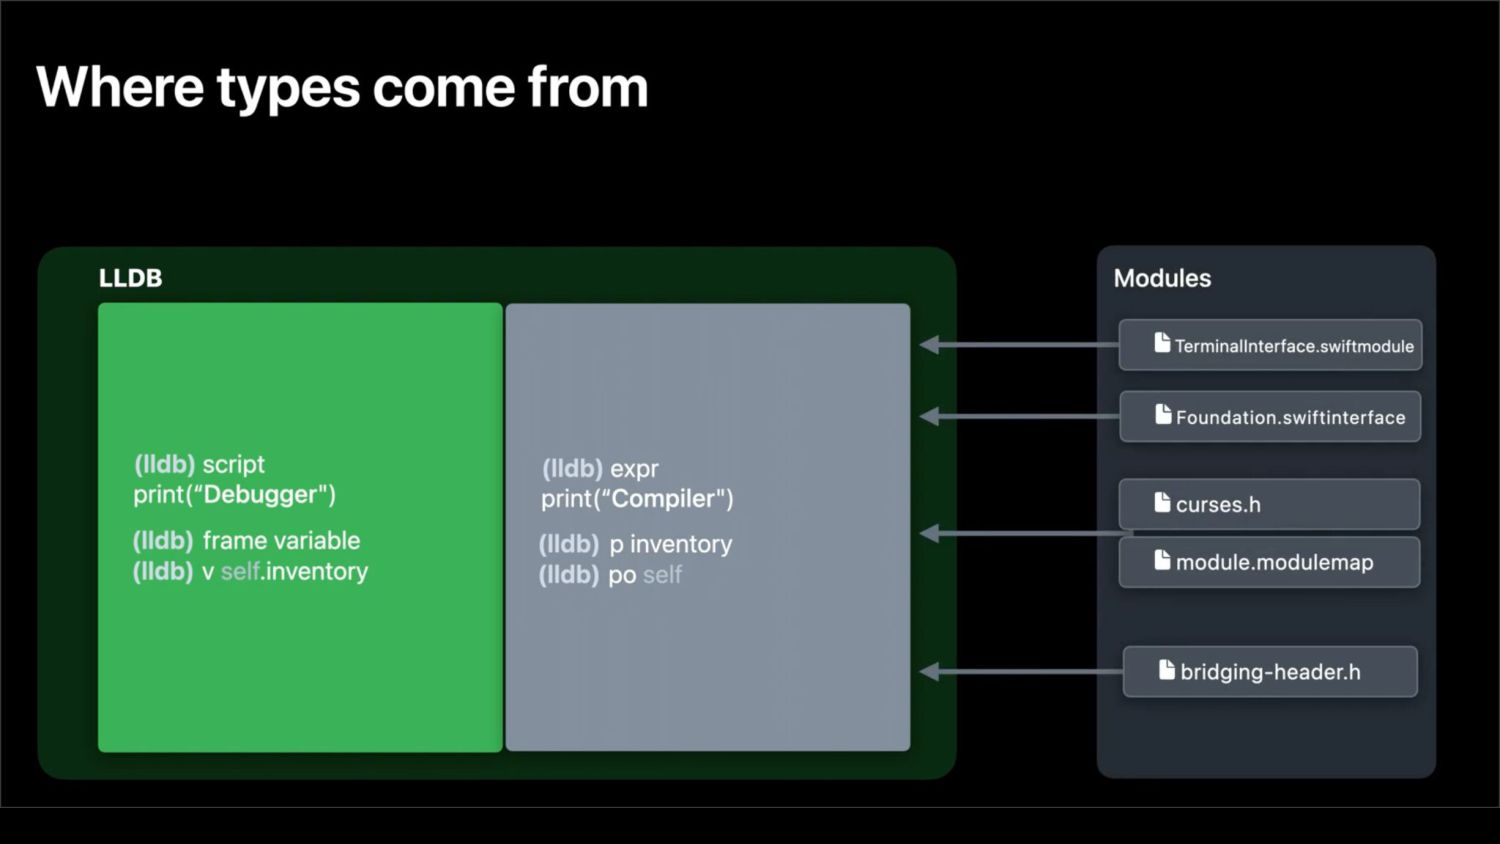
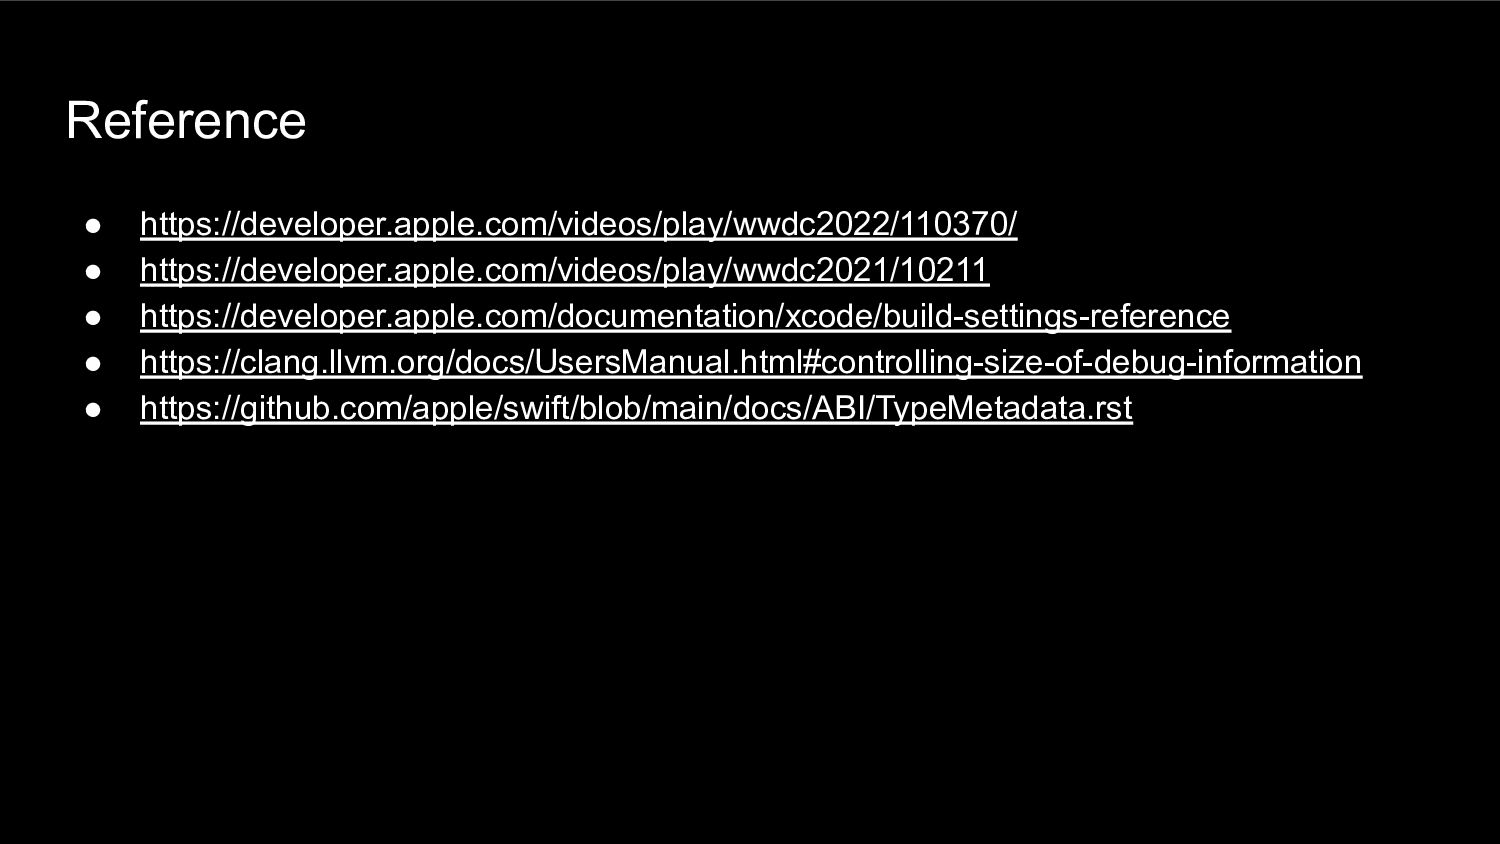
runtime keeps a metadata record for every type used in a program, including every instantiation of generic types. ◦ These metadata records can be used by reflection and debugger tools to discover information about types. • Reflection ◦ Reflection in Swift allows us to inspect and manipulate arbitrary values at runtime. • https://github.com/apple/swift/blob/main/docs/ABI/TypeMetadata.rst
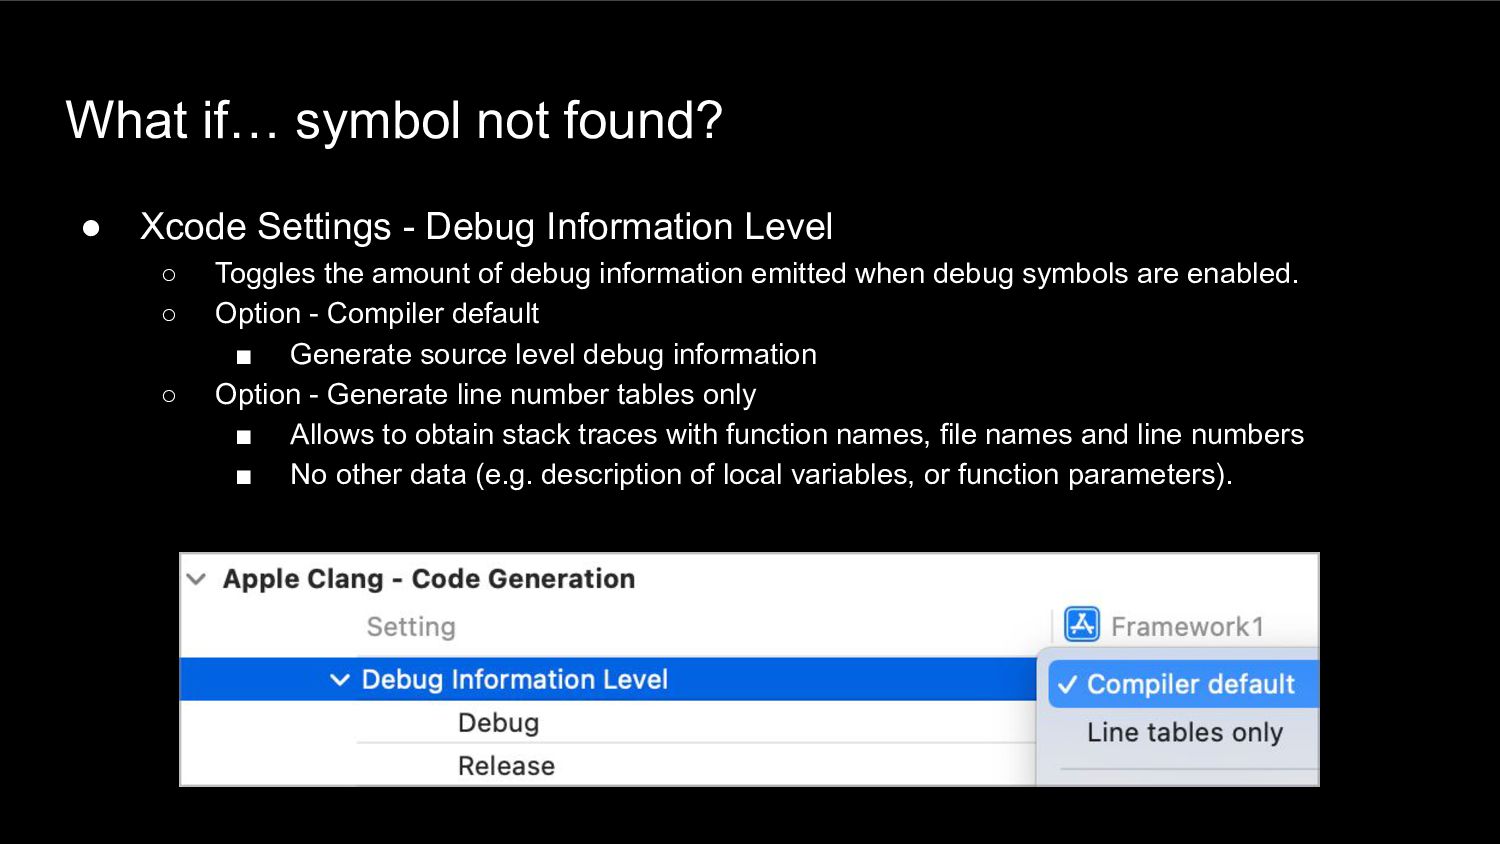
Information Level ◦ Toggles the amount of debug information emitted when debug symbols are enabled. ◦ Option - Compiler default ▪ Generate source level debug information ◦ Option - Generate line number tables only ▪ Allows to obtain stack traces with function names, file names and line numbers ▪ No other data (e.g. description of local variables, or function parameters).