Upgrade to Pro — share decks privately, control downloads, hide ads and more …

And the beats go on! - Devoxx BE 2016

Elastic Co
November 07, 2016

And the beats go on! - Devoxx BE 2016

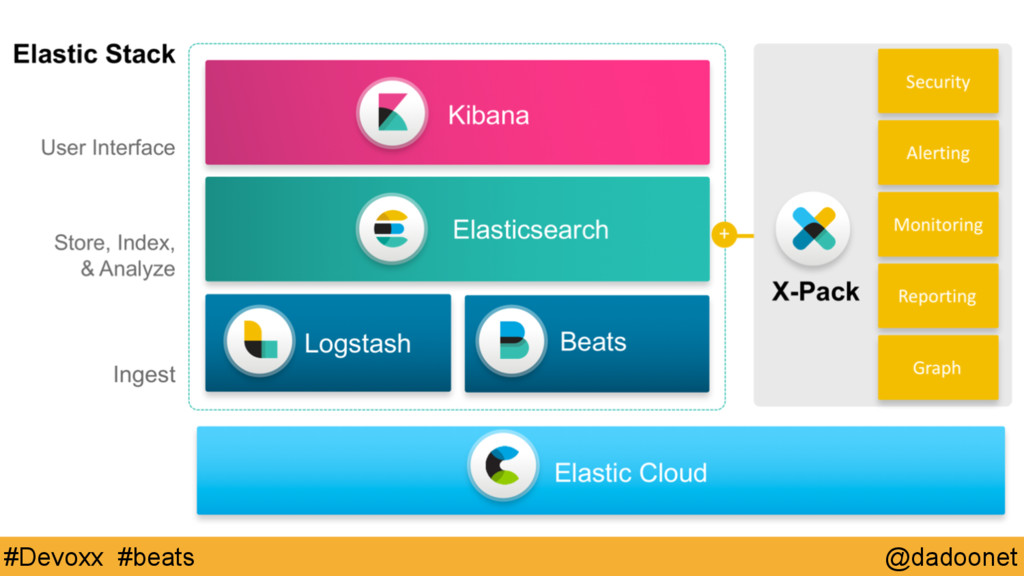
Come and meet the new data shippers for Elasticsearch:

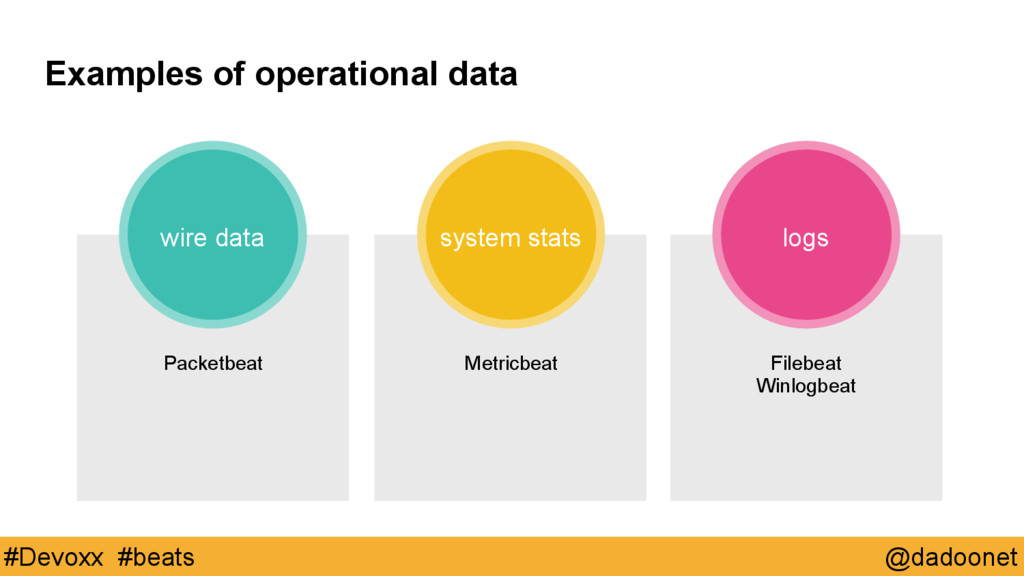
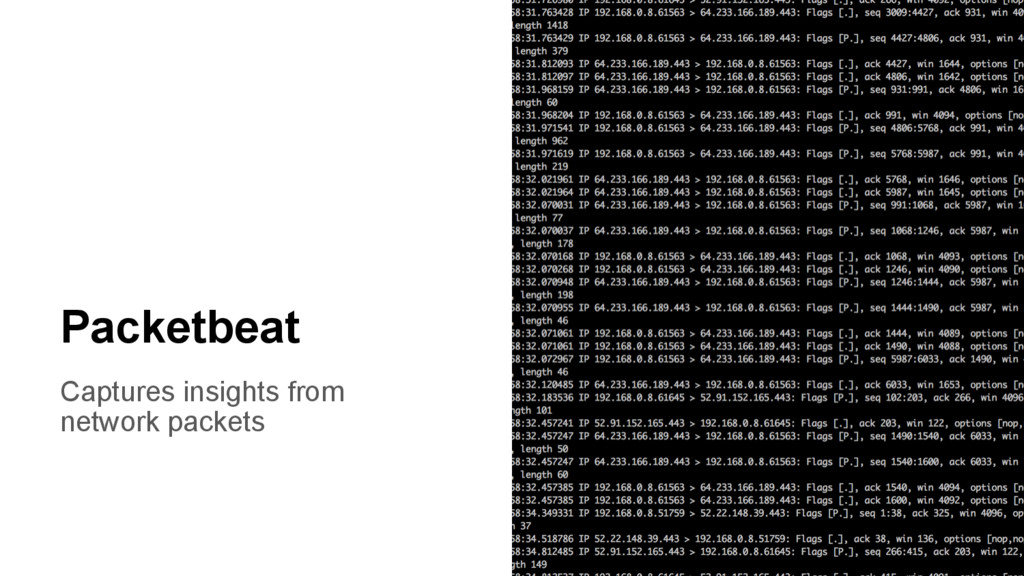
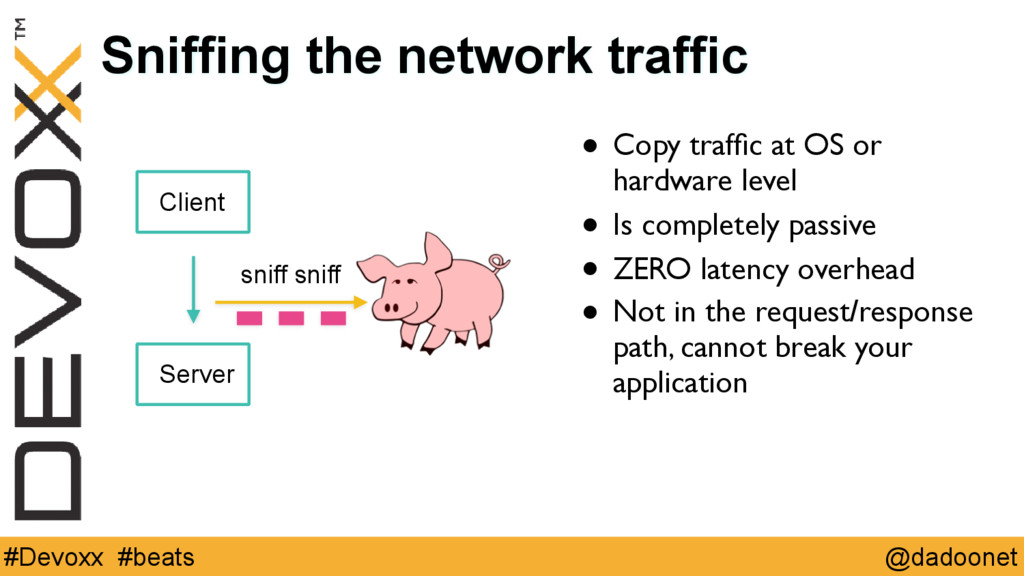
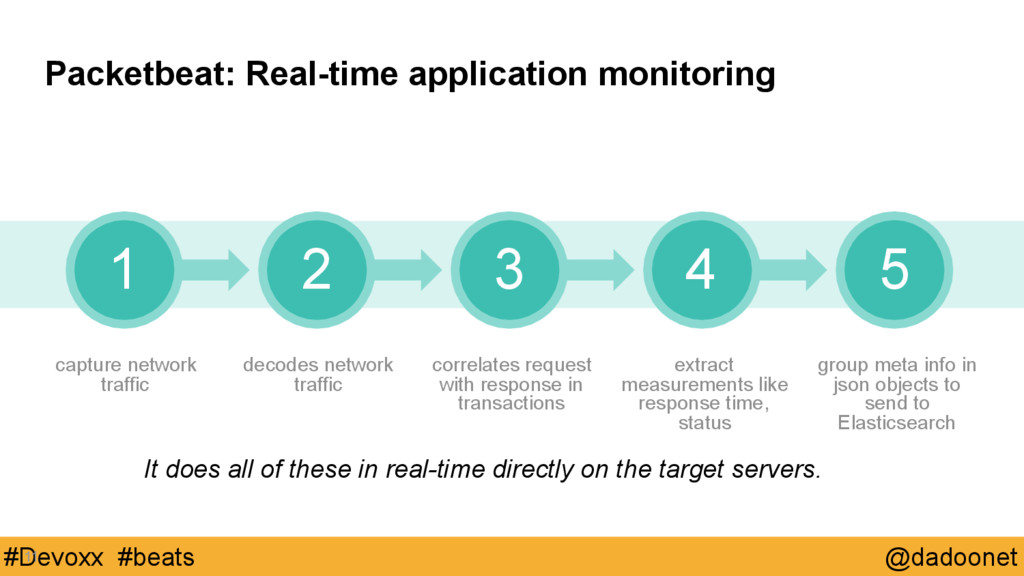
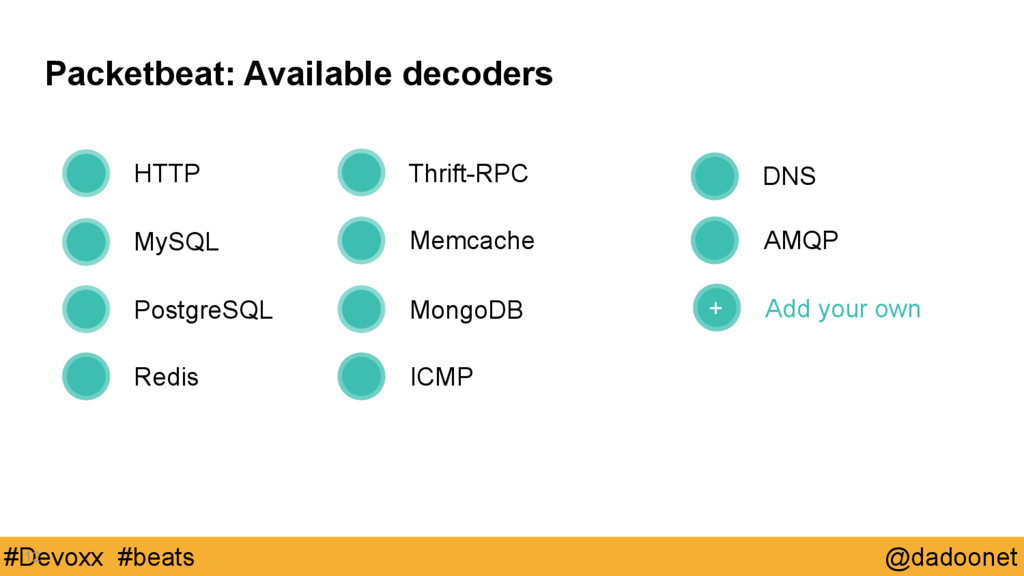
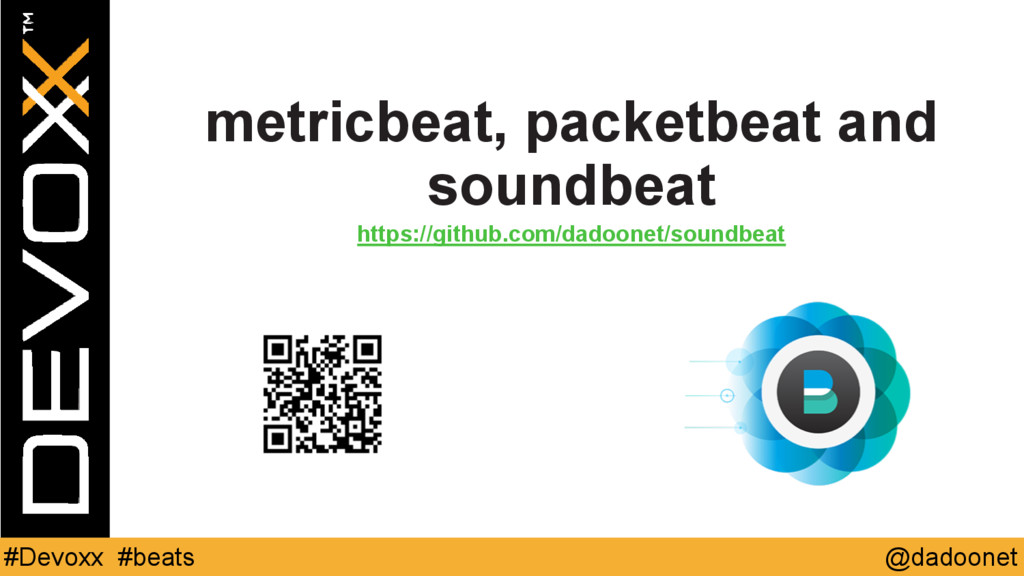
* Packetbeat: capture network packets
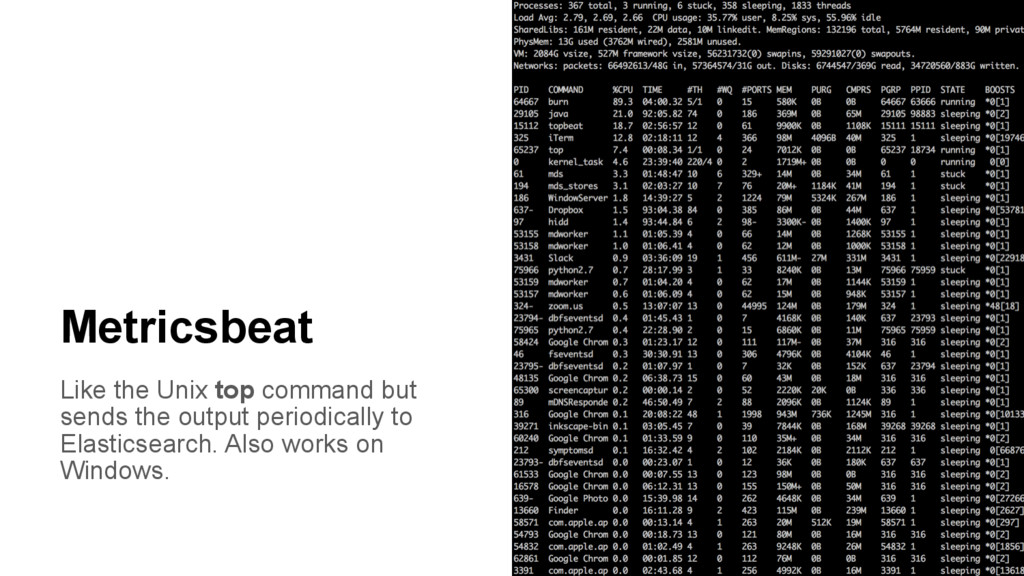
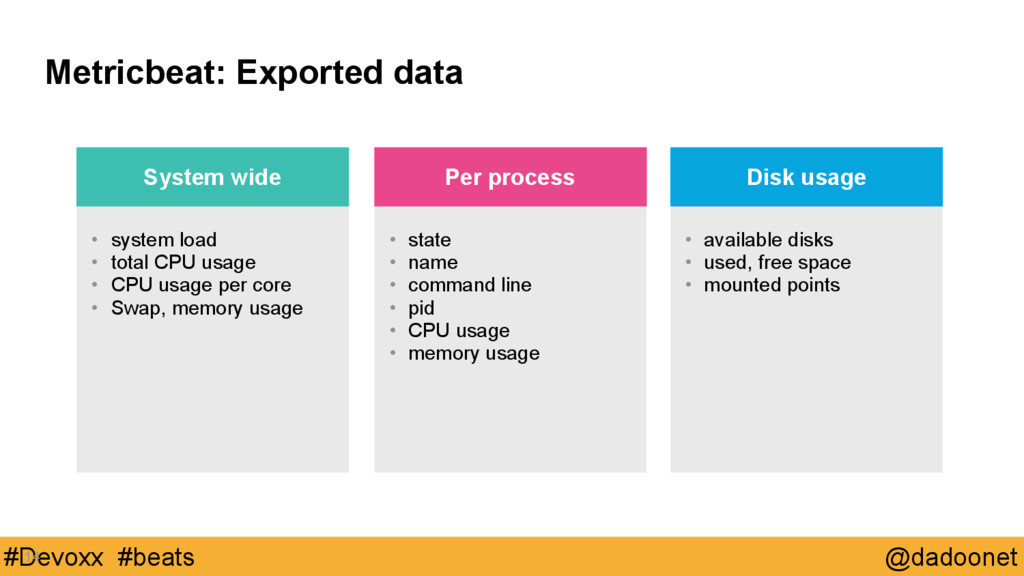
* Metricbeat: gather machine metrics
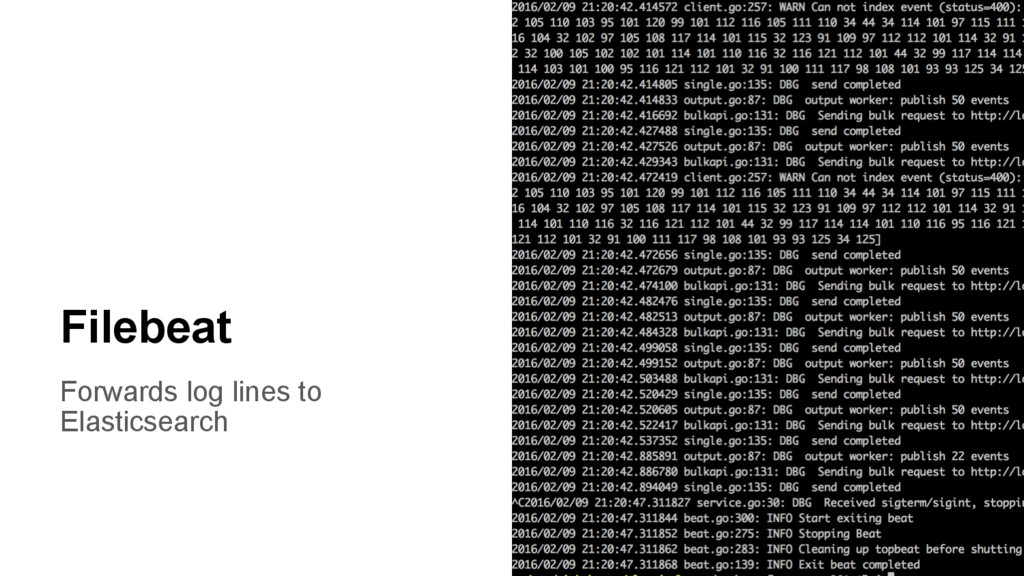
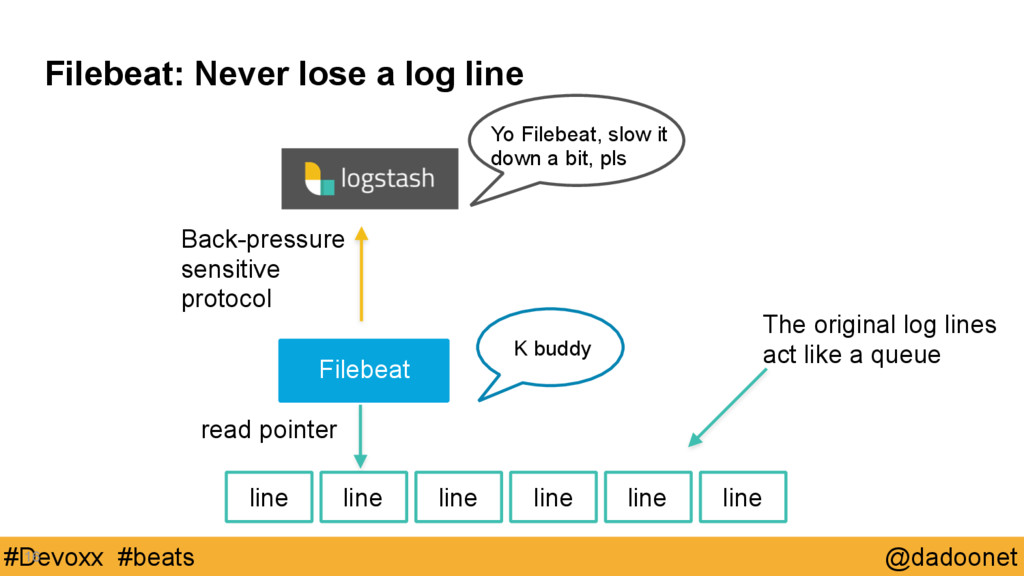
* Filebeat: stream your log files

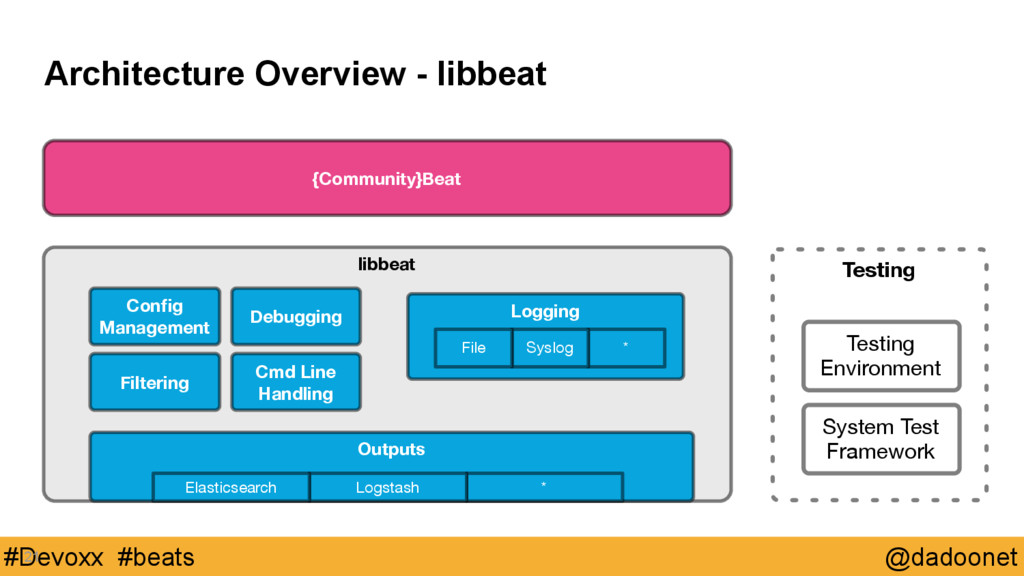
And how to build your own beat with Libbeat.

http://cfp.devoxx.be/2016/talk/TAM-4238/And_the_beats_go_on!

Elastic Co

November 07, 2016
Tweet

More Decks by Elastic Co

Other Decks in Programming

Transcript

  1. @dadoonet #Devoxx #beats The only Elasticsearch as a Service offering

    powered by the creators of the Elastic Stack • Always runs on the latest software • One-click to scale/upgrade with no downtime • Free Kibana and backups every 30 minutes • Dedicated, SLA-based support • Easily add X-Pack features: security (Shield), alerting (Watcher), and monitoring (Marvel) • Pricing starts at $45 a month
  2. @dadoonet #Devoxx #beats Beats are lightweight shippers that collect and

    ship all kinds of operational data to Elasticsearch
  3. @dadoonet #Devoxx #beats Examples of operational data wire data system

    stats logs Packetbeat Metricbeat Filebeat Winlogbeat
  4. @dadoonet #Devoxx #beats Sniffing the network traffic Client Server sniff

    sniff • Copy traffic at OS or hardware level • Is completely passive • ZERO latency overhead • Not in the request/response path, cannot break your application
  5. @dadoonet #Devoxx #beats Packetbeat: Real-time application monitoring 11 1 2

    3 4 capture network traffic decodes network traffic correlates request with response in transactions extract measurements like response time, status 5 group meta info in json objects to send to Elasticsearch It does all of these in real-time directly on the target servers.
  6. @dadoonet #Devoxx #beats Packetbeat: Available decoders 12 HTTP MySQL PostgreSQL

    MongoDB Memcache ICMP + Add your own Thrift-RPC DNS Redis AMQP
  7. Like the Unix top command but sends the output periodically

    to Elasticsearch. Also works on Windows. Metricsbeat
  8. @dadoonet #Devoxx #beats Metricbeat: Exported data 14 • system load

    • total CPU usage • CPU usage per core • Swap, memory usage System wide • state • name • command line • pid • CPU usage • memory usage Per process • available disks • used, free space • mounted points Disk usage
  9. @dadoonet #Devoxx #beats Filebeat: Never lose a log line 16

    line line line line line read pointer Filebeat Back-pressure sensitive protocol Yo Filebeat, slow it down a bit, pls K buddy line The original log lines act like a queue
  10. @dadoonet #Devoxx #beats Filebeat: Parse logs with Logstash Parse logs

    with Logstash 17 • Filebeat sends out unparsed log lines • Use filters from Logstash to parse the log lines • Flexible, with conditionals & custom filters • Forward data to other systems using the Logstash output plugins Filebeat Other systems
  11. @dadoonet #Devoxx #beats Filebeat: Parse logs with Ingest Node Parse

    logs with Ingest node in Elasticsearch 18 • Filebeat sends out unparsed log lines directly to Elasticsearch • Use Ingest Node processors (grok, geoip…) to parse the log lines • Easier to setup Filebeat 5.0
  12. @dadoonet #Devoxx #beats Beats Platform Explore & Visualize Search &

    Analyze Enrich & Transport Optional libbeat {Community} Beats Elastic Beats Collect, Parse & Ship
  13. @dadoonet #Devoxx #beats Architecture Overview - libbeat 21 {Community}Beat libbeat

    Outputs * Logstash Elasticsearch Config Management Debugging Logging * Syslog File Cmd Line Handling Filtering Testing Testing Environment System Test Framework