support efficiency Integrate disparate data sources into a curated single pane of glass Massively parallelize investigation Codify tribal knowledge into rules and models “E Pluribus Unum” From many monitors, one view of performance Slice across many dimensions – customer behavior, network flows, hardware load – to pinpoint failure source Couple machine learning models with analyst expertise for automated root cause analysis and remediation
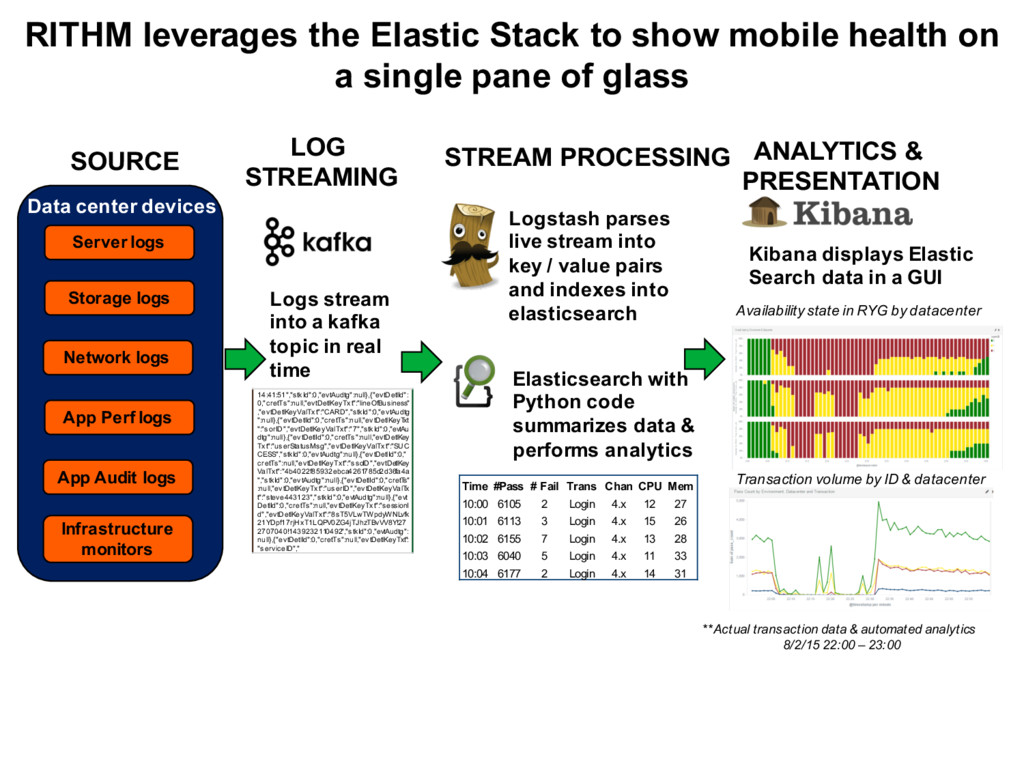
a single pane of glass LOG STREAMING SOURCE STREAM PROCESSING ANALYTICS & PRESENTATION Logstash parses live stream into key / value pairs and indexes into elasticsearch 14:41:51","stkId":0,"evtAudtg":null},{"evtDetlId": 0,"cretTs":null,"evtDetlKeyTxt":"lineOfBusiness" ,"evtDetlKeyValTxt":"CARD","stkId":0,"evtAudtg ":null},{"evtDetlId":0,"cretTs":null,"evtDetlKeyT xt ":"sorID","evtDetlKeyValTxt":"7","stkId":0,"evtAu dtg":null},{"evtDetlId":0,"cretTs":null,"evtDetlKey Txt":"userStatusMsg","evtDetlKeyValTxt":"SUC CESS","stkId":0,"evtAudtg":null},{"evtDetlId":0," cretTs":null,"evtDetlKeyTxt":"ssoID","evtDetlKey ValTxt":"4b4022f85932ebca4261785d2d36fa4a ","stkId":0,"evtAudtg":null},{"evtDetlId":0,"cretT s" :null,"evtDetlKeyTxt":"userID","evtDetlKeyValT x t":"steve443123","stkId":0,"evtAudtg":null},{"evt DetlId":0,"cretTs":null,"evtDetlKeyTxt":"sessionI d","evtDetlKeyValTxt":"8sT5VLwTWpdyWNLvfk 21YDpf17rjHxT1LQPV0ZG4jTJhzTBvVV8Y!27 2707040!1439232110492","stkId":0,"evtAudtg": null},{"evtDetlId":0,"cretTs":null,"evtDetlKeyTxt": "serviceID"," Logs stream into a kafka topic in real time Elasticsearch with Python code summarizes data & performs analytics Time #Pass # Fail Trans Chan CPU Mem 10:00 6105 2 Login 4.x 12 27 10:01 6113 3 Login 4.x 15 26 10:02 6155 7 Login 4.x 13 28 10:03 6040 5 Login 4.x 11 33 10:04 6177 2 Login 4.x 14 31 Kibana displays Elastic Search data in a GUI **Actual transaction data & automated analytics 8/2/15 22:00 – 23:00 Availability state in RYG by datacenter Transaction volume by ID & datacenter Data center devices Server logs App Perf logs Storage logs Network logs App Audit logs Infrastructure monitors
infrastructure response • Tri-state information in RYG format • Hierarchical framework: Datacenter – Environment – Transaction • Overall state based on key metrics – Txn volatility and Error rates
logs into logical aggregates, RITHM gives you to the context to pinpoint the problem • Successful high volume transactions hiding failing low-volume transactions • Large scale failure appearing as many individual small failures • Many point metrics without context • Volume neutral stacked bar charts reflecting each transaction’s state • Transaction states grouped in logical aggregates (DC, ENV, etc.) • Logical “Red, Yellow, Green” state description based on current data and history RITHM addresses the key challenges with making an actionable enterprise dashboard
failed and failing transactions – 2 metrics: Raw measures and State – 2 dimensions: Error rate and Transaction volume RITHM Detects high error rates for BankStatements in both datacenters RITHM finds transaction volatility for Login, Bank Acct Details, Card Acct Details, Credit Tracker and Transfer-Schedule
are 2 major challenges to correct estimation Customer usage patterns Failure state volatility • Transaction volumes vary significantly by time of day, day of week, whether or not a holiday, etc. • It can also just be a ‘weird day’ • Need to discount data when in failing state; it is a poor estimator of volumes during normal conditions You need an adaptable algorithm to adjust set points and confidence intervals in real time
score tells you what state you’re in >Tgy >Tyr <Try <Tyg Select ‘alpha’ from RYG state Update mean & standard deviation estimate w/ current alpha Compute z-score from data, mean and standard deviation Collect current data Change state if z-score exceeds thresholds, T Initialize: Current mean & standard deviation estimate, and RYG state RITHM determines the current state from both its scoring metric and previous state