Upgrade to Pro — share decks privately, control downloads, hide ads and more …

COVEA Elastic{ON} Day

Elastic Co
January 20, 2017

COVEA Elastic{ON} Day

Elastic Co

January 20, 2017
Tweet

More Decks by Elastic Co

Other Decks in Technology

Transcript

  1. 4 X-Pack Single install Extensions for the Elastic Stack Subscription

    pricing Security Alerting Monitoring Reporting Graph
  2. 6 Elasticsearch Heart of the Elastic Stack Distributed, Scalable High-availability

    Multi-tenancy Developer Friendly Real-time, Full-text Search Aggregations
  3. 7 Kibana Window into the Elastic Stack Visualize and analyze

    Geospatial Customize and Share Reports Graph Exploration UX to secure and manage the Elastic Stack Build Custom Apps
  4. 8

  5. 9

  6. 10 Beats Lightweight data shippers Ship data from the source

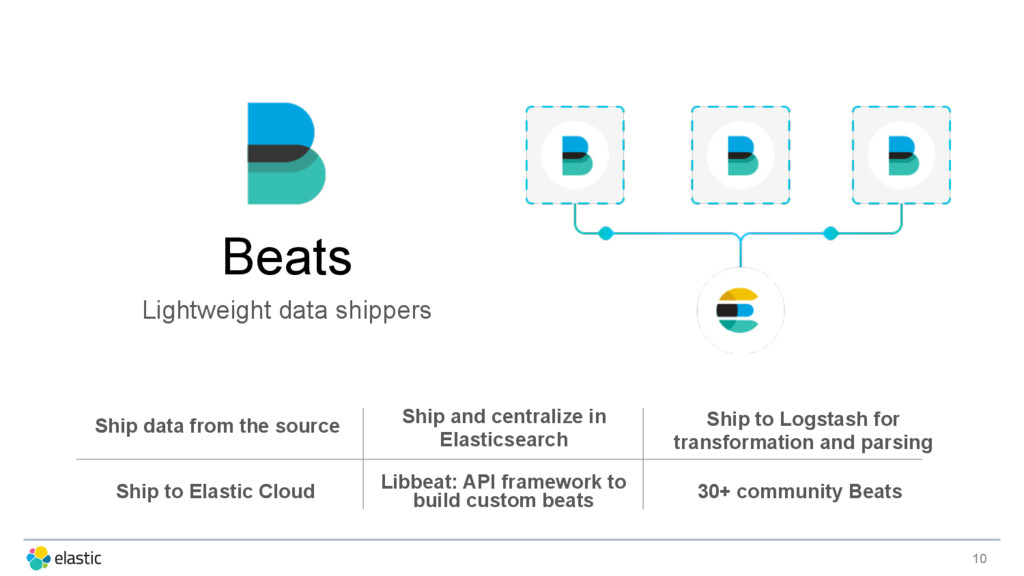
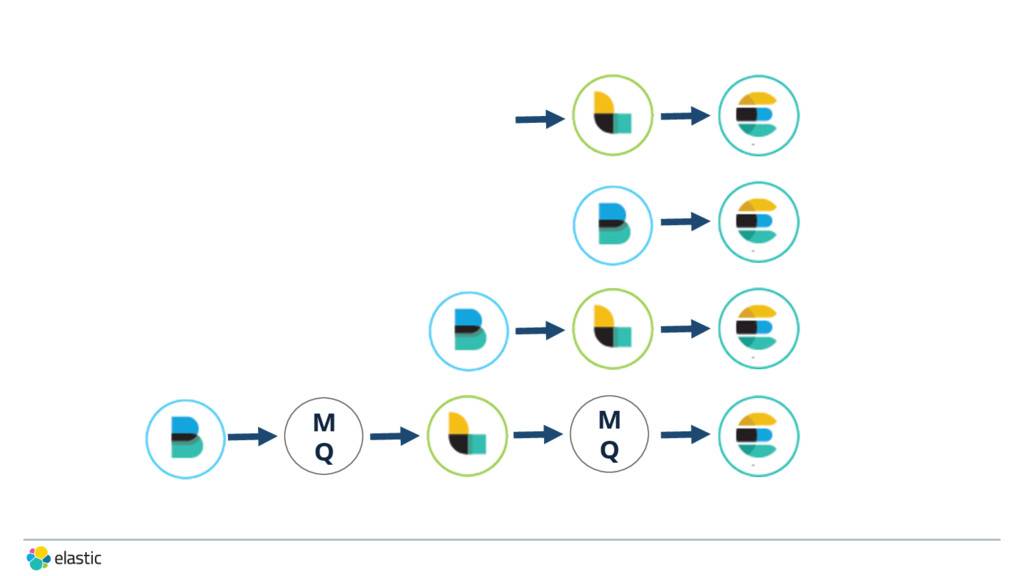
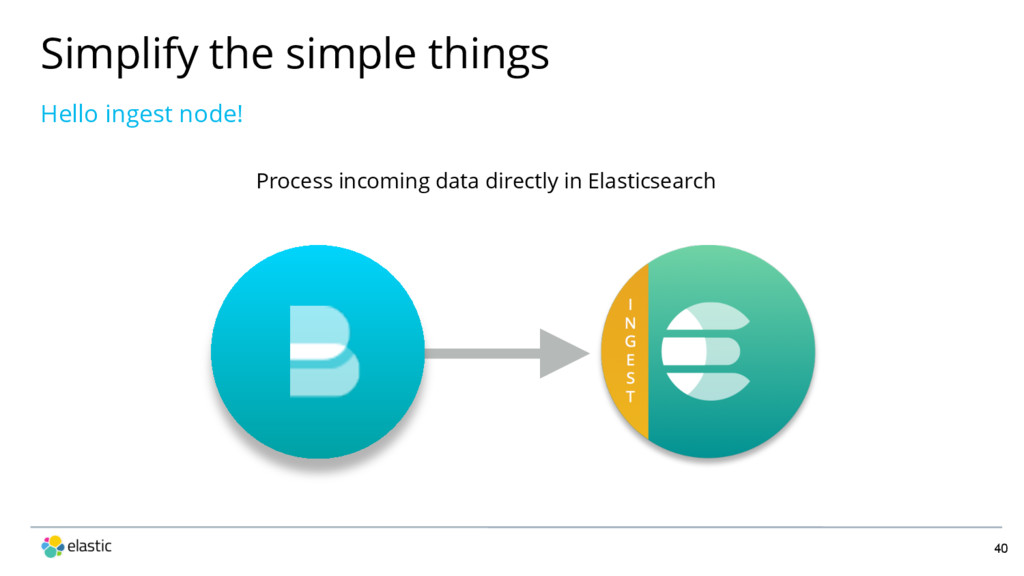
    Ship and centralize in Elasticsearch Ship to Logstash for transformation and parsing Ship to Elastic Cloud Libbeat: API framework to build custom beats 30+ community Beats
  7. 11 FILEBEAT Log Files METRICBEAT Metrics PACKETBEAT Network Data WINGLOGBEAT

    Window Events More than 30 community Beats and growing … Apachebeat, dockbeat, httpbeat, mysqlbeat, nginxbeat, redis beats, twitterbeat, and more
  8. 12

  9. 13 Logstash Data processing pipeline Ingest data of all shapes,

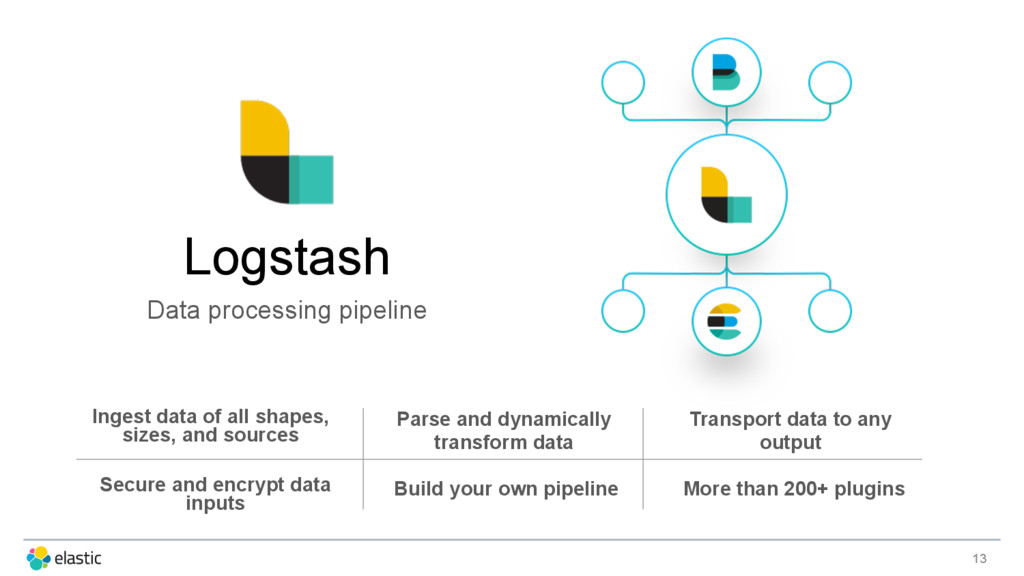
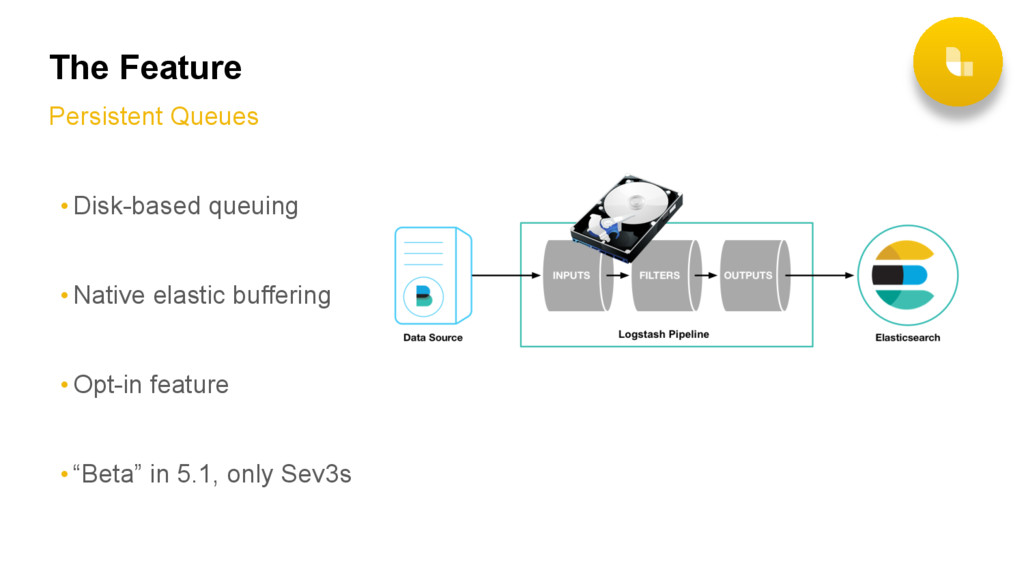
    sizes, and sources Parse and dynamically transform data Transport data to any output Secure and encrypt data inputs Build your own pipeline More than 200+ plugins
  10. 14 ES-Hadoop Elasticsearch for Hadoop Two-way connector Index Hadoop data

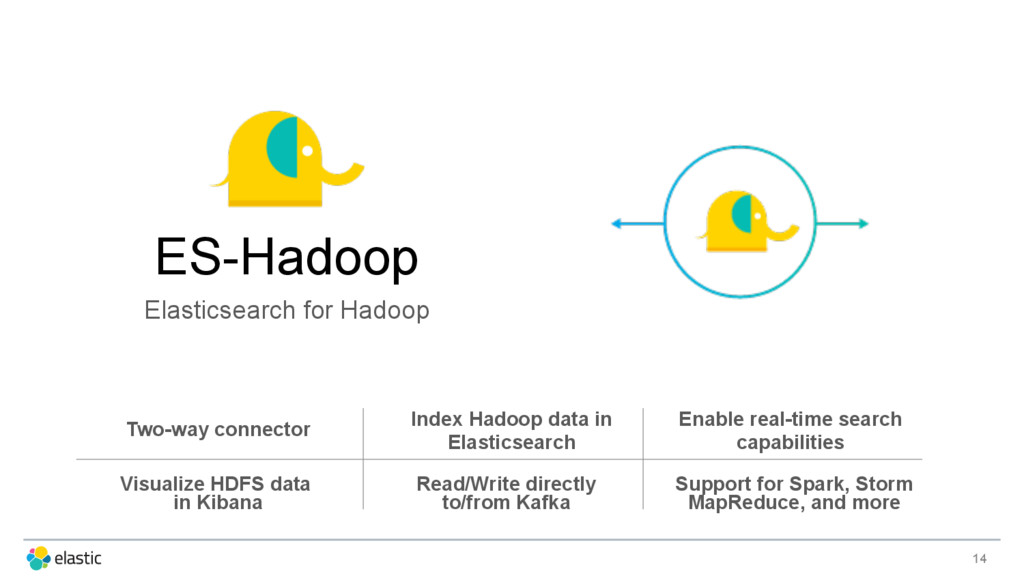
    in Elasticsearch Enable real-time search capabilities Visualize HDFS data in Kibana Read/Write directly to/from Kafka Support for Spark, Storm MapReduce, and more
  11. 16 X-Pack Extensions for the Elastic Stack Security Alerting Monitoring

    Reporting Graph Analytics Single Install, included in Elastic Subscription
  12. 17 X-Pack Security •  Username and password •  Integrate with

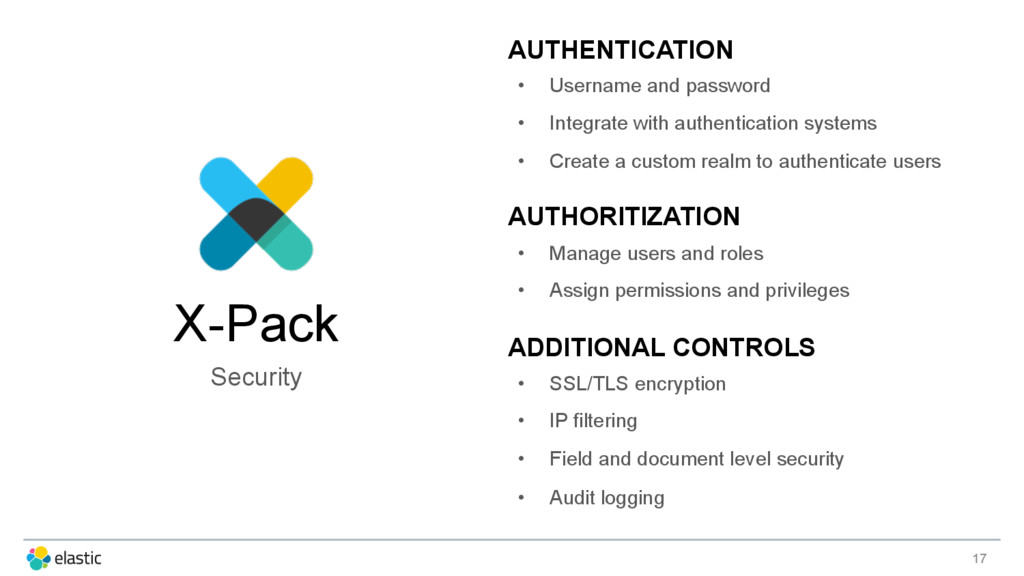
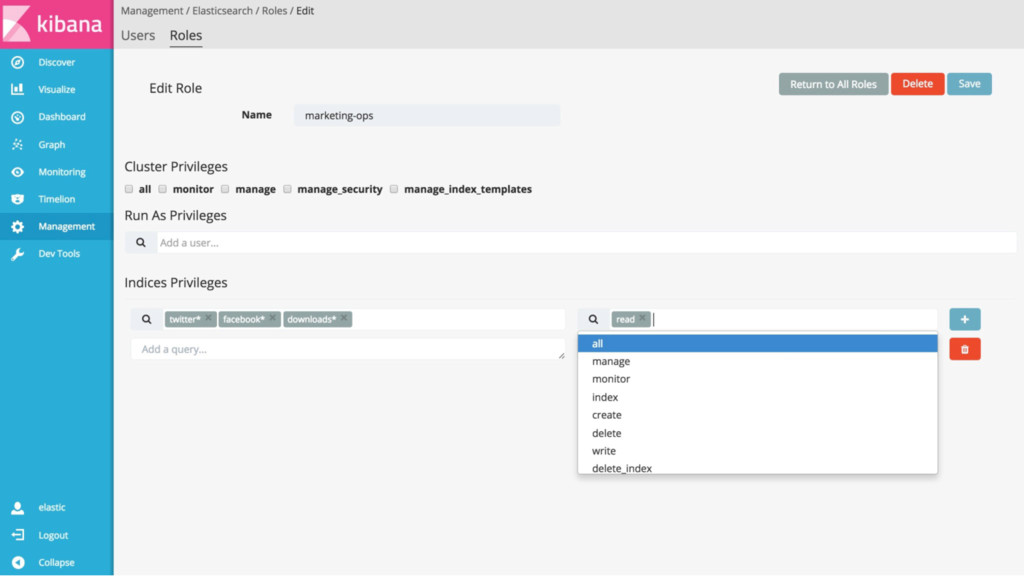
    authentication systems •  Create a custom realm to authenticate users AUTHENTICATION •  Manage users and roles •  Assign permissions and privileges AUTHORITIZATION •  SSL/TLS encryption •  IP filtering •  Field and document level security •  Audit logging ADDITIONAL CONTROLS
  13. 18

  14. 19 X-Pack Alerting •  Create Watches to detect changes in

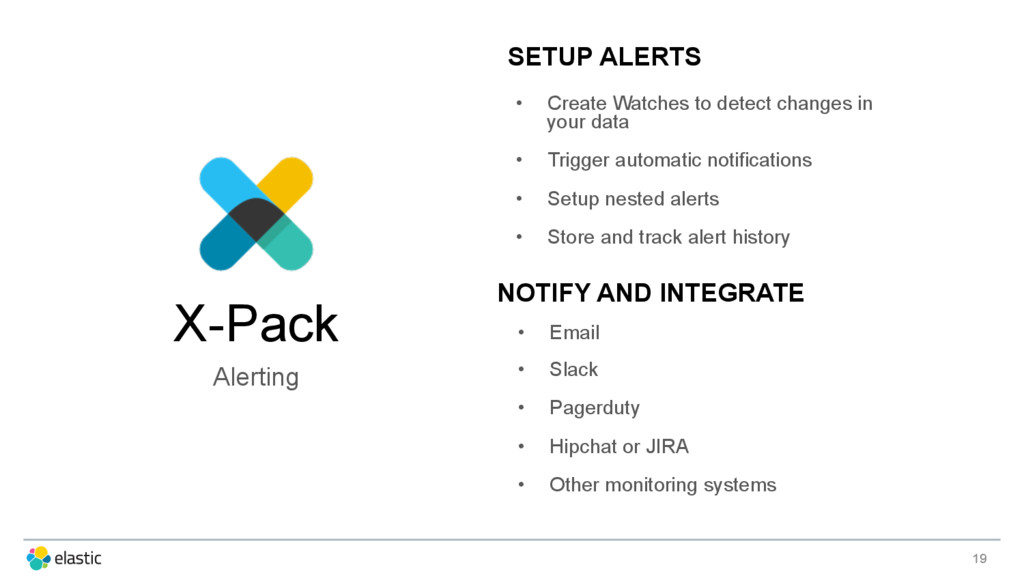
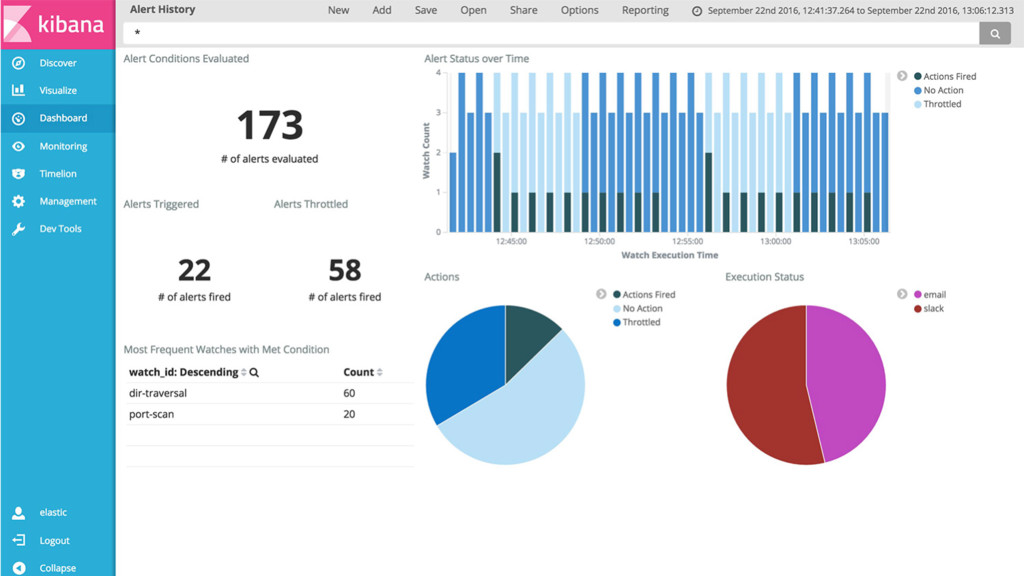
    your data •  Trigger automatic notifications •  Setup nested alerts •  Store and track alert history SETUP ALERTS NOTIFY AND INTEGRATE •  Email •  Slack •  Pagerduty •  Hipchat or JIRA •  Other monitoring systems
  15. 20

  16. 21 X-Pack Monitoring •  Prebuilt Kibana dashboards to monitor the

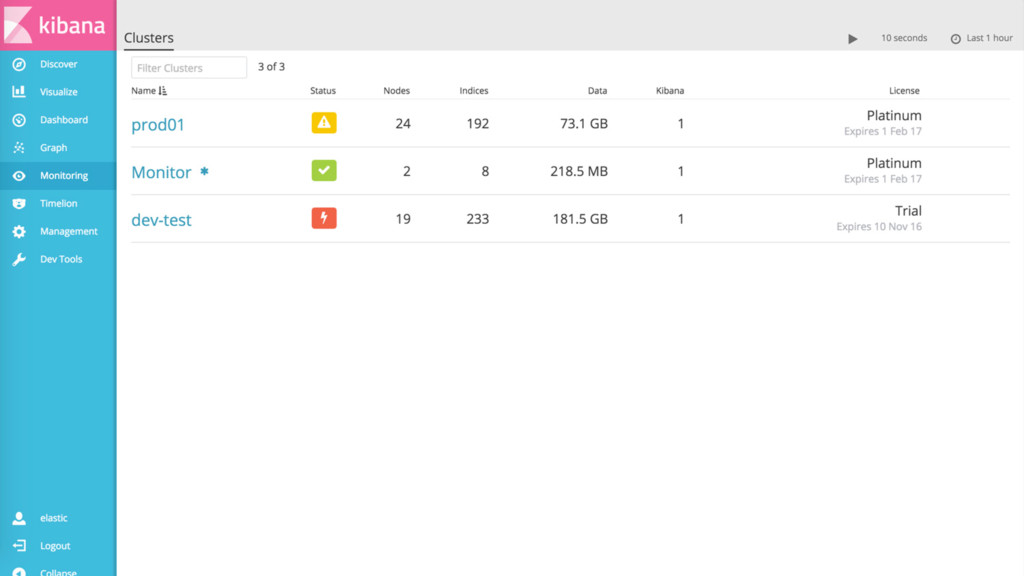
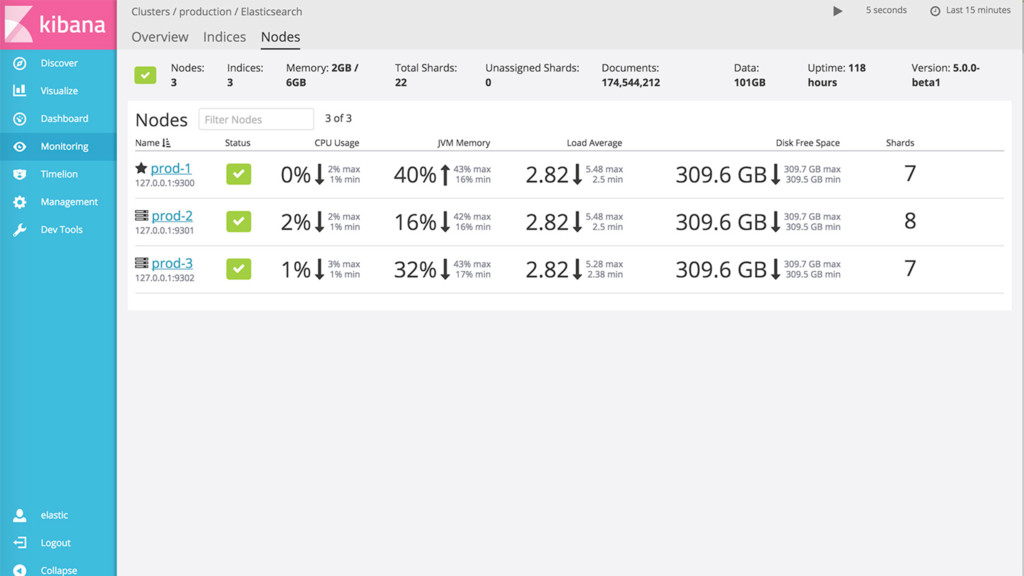
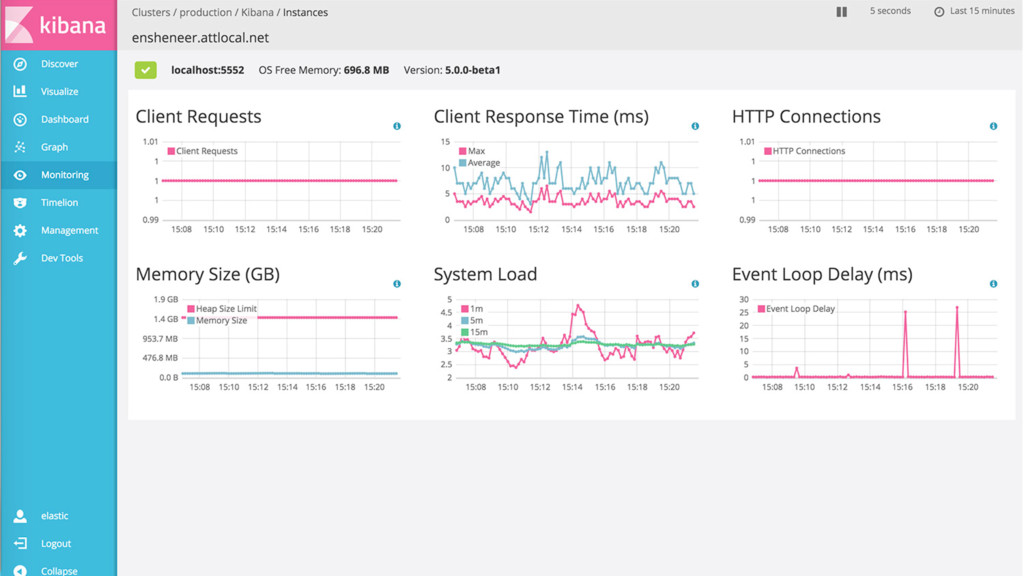
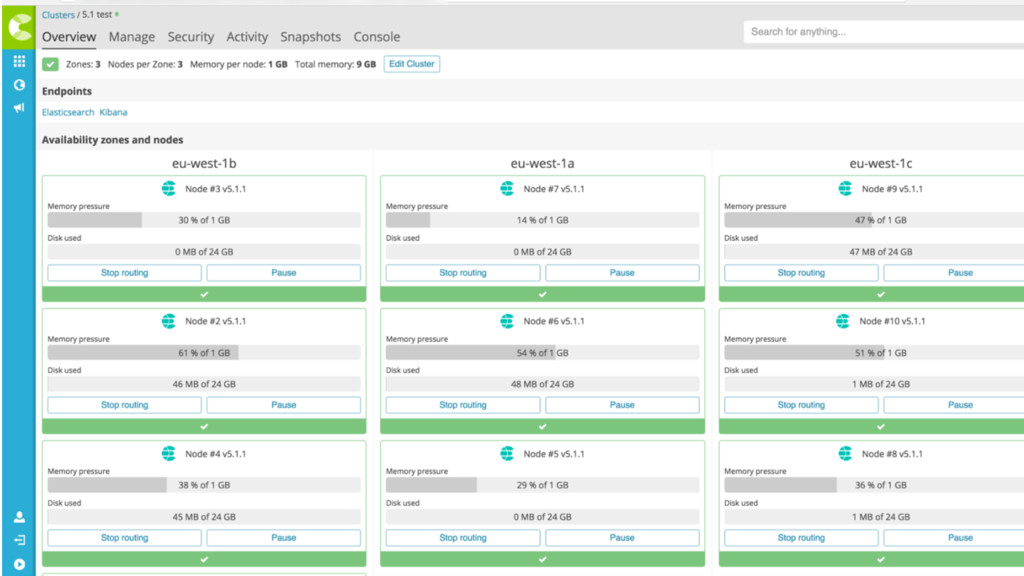
    performance of the Elastic Stack •  Get vital statistics at various levels -- cluster, node, and indices MONITOR CLUSTER HEALTH OPTIMIZE CLUSTER PERFORMANCE •  Multicluster support to compare health and performance of multiple clusters •  Analyze historical or real-time data for root cause analyses •  Utilize analyses to proactively optimize and improve cluster performance •  Configure data retention policy
  17. 22

  18. 23

  19. 24

  20. 25 X-Pack Reporting •  Email recurring status updates daily, weekly,

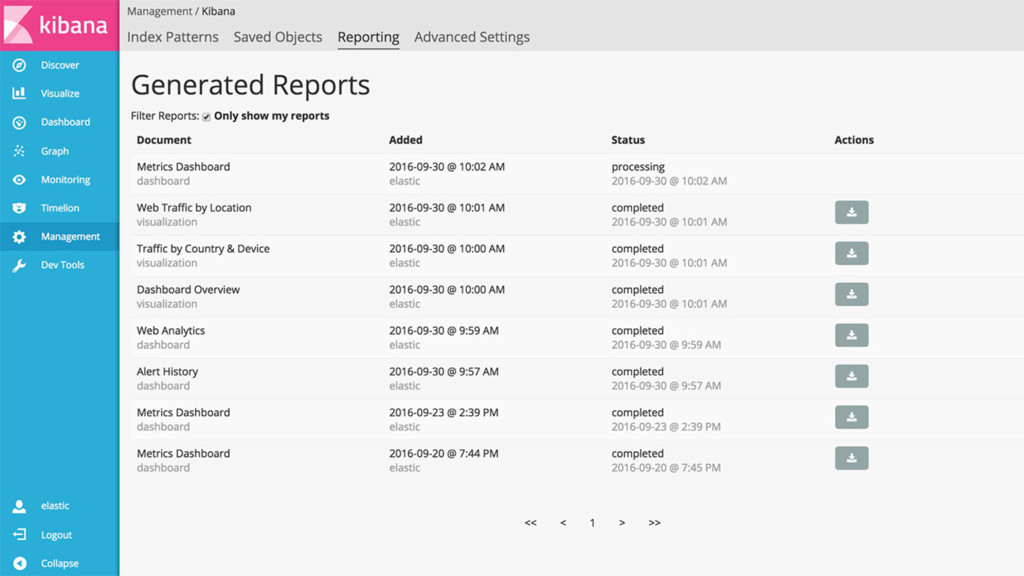
    monthly, etc. •  Combine reporting with X-Pack alerting capabilities to trigger conditional reports AUTOMATE SCHEDULING SHARE AND COLLABORATE •  Export any Kibana visualization or dashboard •  Print-optimized and PDF formatted •  Download and share past reports
  21. 26

  22. 27 X-Pack Graph •  Uses relevance capabilities of Elasticsearch • 

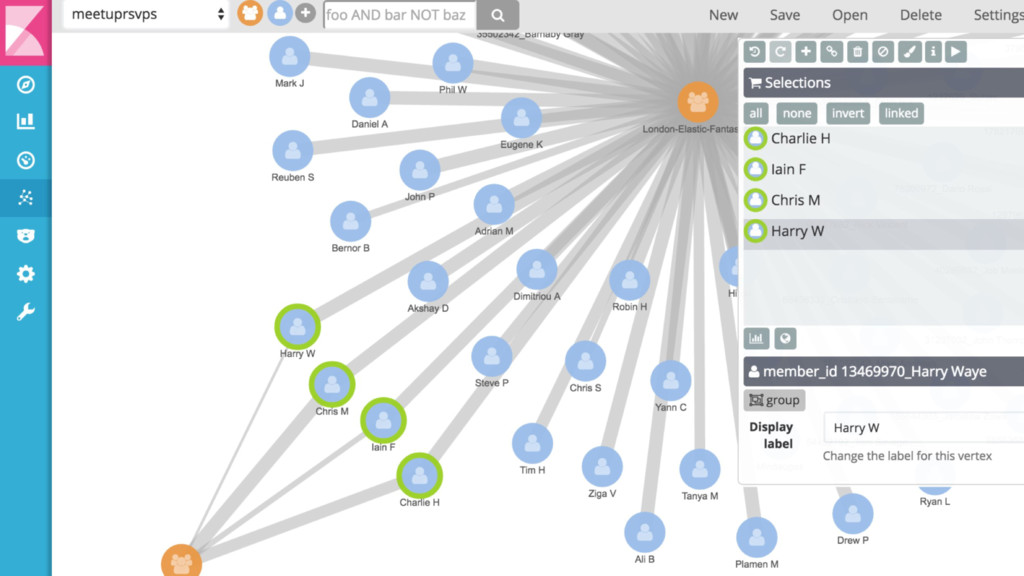
    Discover linkages and connections •  Leverage API and UI-drive tool A NEW WAY TO EXPLORE DATA EXTEND TO NEW USE CASES •  Fraud discovery •  Recommendations •  Cyber security •  Behavioral analyses
  23. 28

  24. 30 Elastic Cloud Enterprise Provision and manage multiple Elastic Stack

    environments; Expose logging as a service to your entire organization Public beta; Expected GA Q1 2017
  25. 31

  26. 32

  27. 33

  28. 34 Prelert Behavioral analytics and unsupervised machine learning •  Automatically

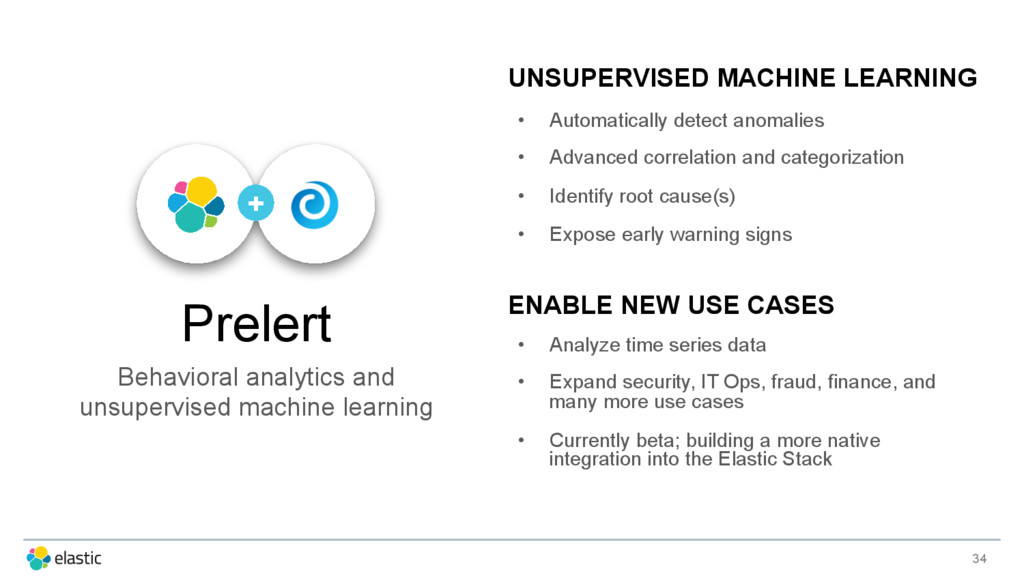
    detect anomalies •  Advanced correlation and categorization •  Identify root cause(s) •  Expose early warning signs UNSUPERVISED MACHINE LEARNING ENABLE NEW USE CASES •  Analyze time series data •  Expand security, IT Ops, fraud, finance, and many more use cases •  Currently beta; building a more native integration into the Elastic Stack
  29. 35

  30. Logstash parsing example 3 Source 2016-07-11T23:56:42.000+00:00 INFO [MyApplication.Transaction.Manager]:Starting transaction for

    session -464410bf-37bf-475a-afc0-498e0199f008 grok %{TIMESTAMP_ISO8601:timestamp} %{LOGLEVEL:log-level} \[%{DATA:class}\]:%{GREEDYDATA:message} Result JSON { "message" => "Starting transaction for session -464410bf-37bf-475a-afc0-498e0199f008", 
 "timestamp" => "2016-07-11T23:56:42.000+00:00", "log-level" => "INFO", 
 "class" => "MyApplication.Transaction.Manager » }
  31. More formats, more inputs 41 •  Packetbeat •  Count and

    bytes on the TCP/IP layer not application layer •  Metricbeat - new Beat! •  Collect metrics from systems and services
  32. Metricbeat •  Goodbye, Topbeat! •  Modularized collection, simple configuration • 

    System module ← Uses code from Topbeat, and is on by default
  33. More formats, more inputs 43 •  New Plugins •  Kinesis

    input, Protobuf codec, IPv6 Support with GeoIP2 •  Plugin Generator •  Developers can generate new plugins in seconds
  34. Elastic <3 Kafka 44 •  Logstash now supports Kafka 0.10

    •  Includes Basic Auth & SSL/TLS •  New Kafka output for all Beats •  No more double Logstash
  35. More filters / enrichment 45 •  New filter plugins in

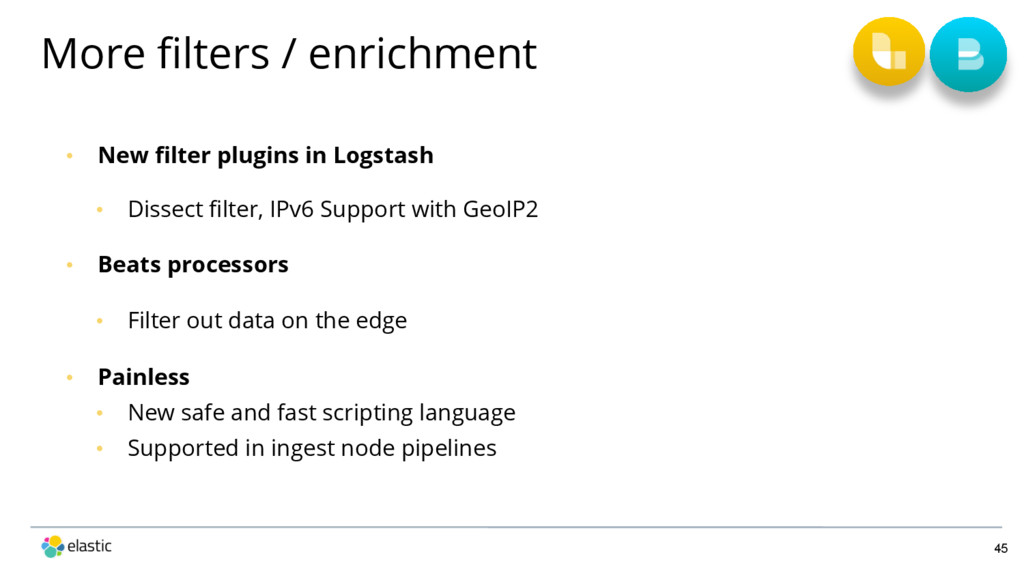
    Logstash •  Dissect filter, IPv6 Support with GeoIP2 •  Beats processors •  Filter out data on the edge •  Painless •  New safe and fast scripting language •  Supported in ingest node pipelines
  36. Performance ++ 46 •  New Java Event •  20%+ increase

    in overall pipeline performance •  Rewrite of Beats input (in Logstash) •  50% performance boost ingesting from Beats
  37. 47 •  rolls over an alias based on age or

    size (# docs) Logs-0001 Logs-0002 Logs-0003 1000 docs 800 docs 0 docs Logs (alias) Better manage time-based indices Rollover API
  38. Better manage time-based indices 48 Shard 1 Compressed Shard 2

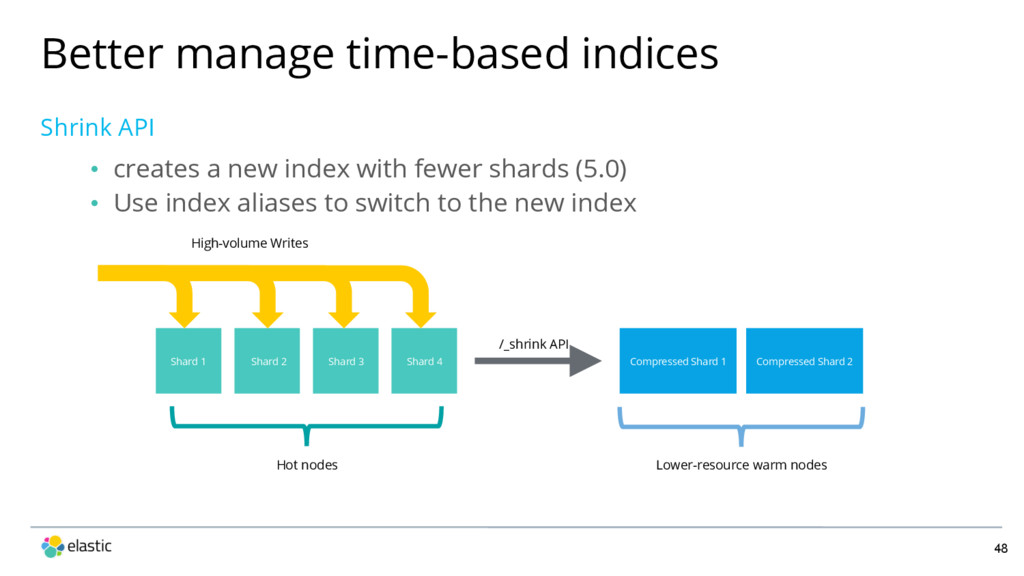
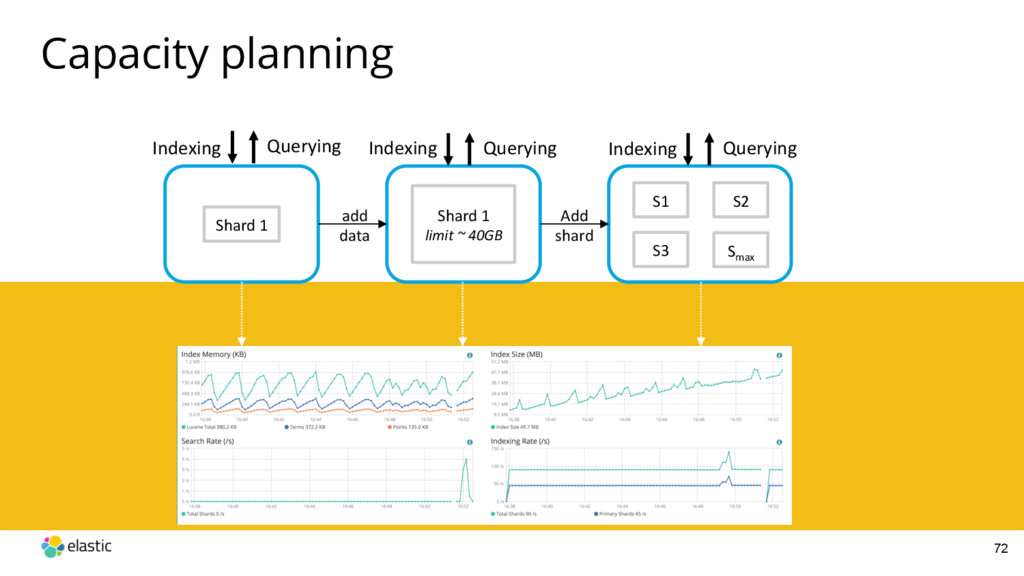
    /_shrink API High-volume Writes Hot nodes Lower-resource warm nodes Compressed Shard 1 Shard 2 Shard 3 Shard 4 •  creates a new index with fewer shards (5.0) •  Use index aliases to switch to the new index Shrink API
  39. Better manage time-based indices 49 •  Automatically archive and restore

    indices •  Simplified YAML-based configuration •  New actions and filters Curator 4.0
  40. Better support for Numbers •  BKD Trees •  Lower heap

    usage •  IPv6 Support •  Scaled / Half float 50 Faster & reduced memory/disk for many use cases
  41. Improved Aggregation Performance 52 Elasticsearch “instant aggregations” via shard query

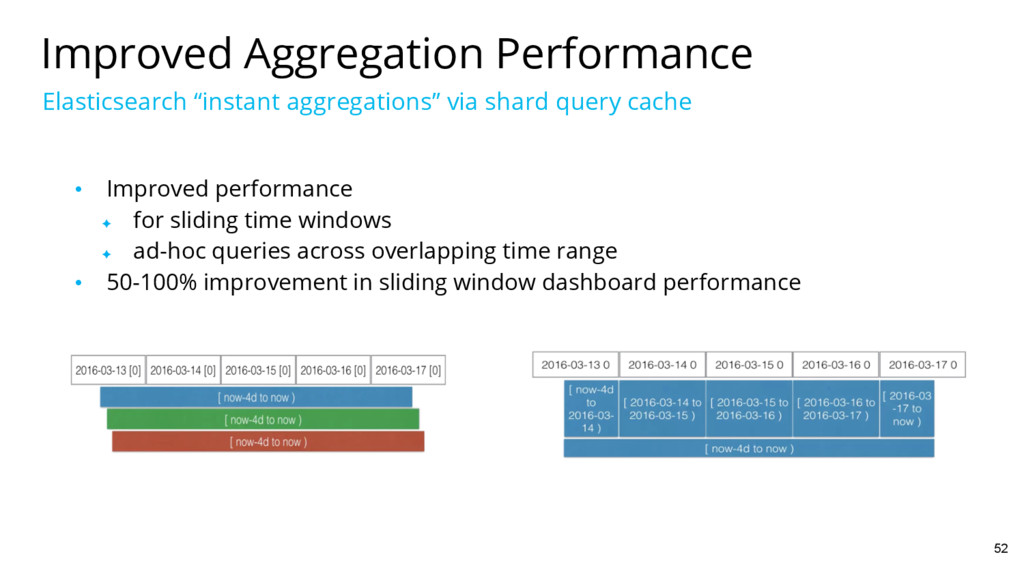
    cache •  Improved performance ✦  for sliding time windows ✦  ad-hoc queries across overlapping time range •  50-100% improvement in sliding window dashboard performance
  42. Goodbye Black Box! 53 •  Logstash Monitoring API •  Node

    Info •  Node Stats •  Plugins •  Hot Threads •  Log4j2 internal logging •  Debug active pipelines •  Component level granularity
  43. Kibana is the window into the Elastic Stack 54 Monitoring

    now includes Kibana monitoring * requires X-Pack
  44. Kibana is the window into the Elastic Stack 55 UI

    to manage users and roles * requires X-Pack
  45. Alerting Enhancements 56 •  Chained Inputs ✦  Run multiple inputs

    serially •  Condition per Action ✦  E.g. Slack message if outage for 5 minutes. SMS messages if outage for 30 minutes { "input" : { "chain" : { "inputs" : [ { "first" : { "simple" : { "path" : "/_search" } } }, { "second" : { "http" : { "request" : { "host" : "localhost", "port" : 9200, "path" : "{{ctx.payload.first.path}}" } } } } ] } } ... }
  46. Ressources considerations 57 •  CPU ✦  Indexing, searching, highlighting • 

    I/O ✦  Indexing, searching, merging •  Memory ✦  Aggregation, indices •  Network ✦  Relocation, Snapshot & Restore
  47. Recommended hardware 58 •  Master nodes ✦  2 - 4

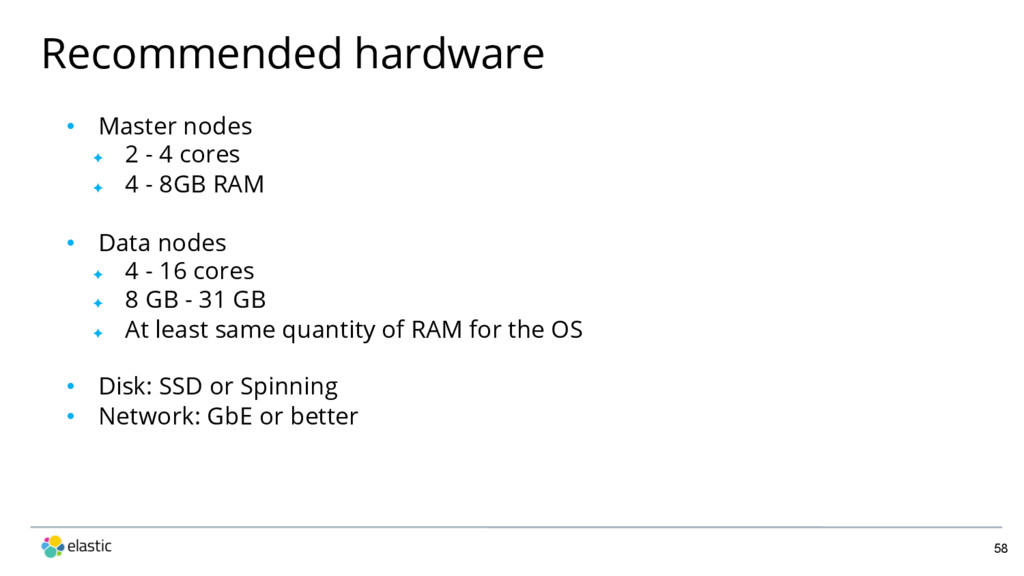
    cores ✦  4 - 8GB RAM •  Data nodes ✦  4 - 16 cores ✦  8 GB - 31 GB ✦  At least same quantity of RAM for the OS •  Disk: SSD or Spinning •  Network: GbE or better
  48. The Pain Persistent Queues • Logstash was not resilient across instance

    failures • No delivery guarantees • Needed external queuing layer to handle ingest spikes
  49. The Benefits Persistent Queues • Protection against in-flight data loss (durability)

    ‒ At-least-once delivery guarantees ‒ Configurable durability • Handle ingest spikes • Simplified ingestion architecture for logging use cases
  50. Durability Persistent Queues In-flight data is durable across: • Instance failures

    • Machine restarts • Shut downs Sequential writes, periodic fsyncs • Inputs à FS cache à fsync to disk
  51. At-Least-Once Delivery Persistent Queues • Data can be duplicated, but not

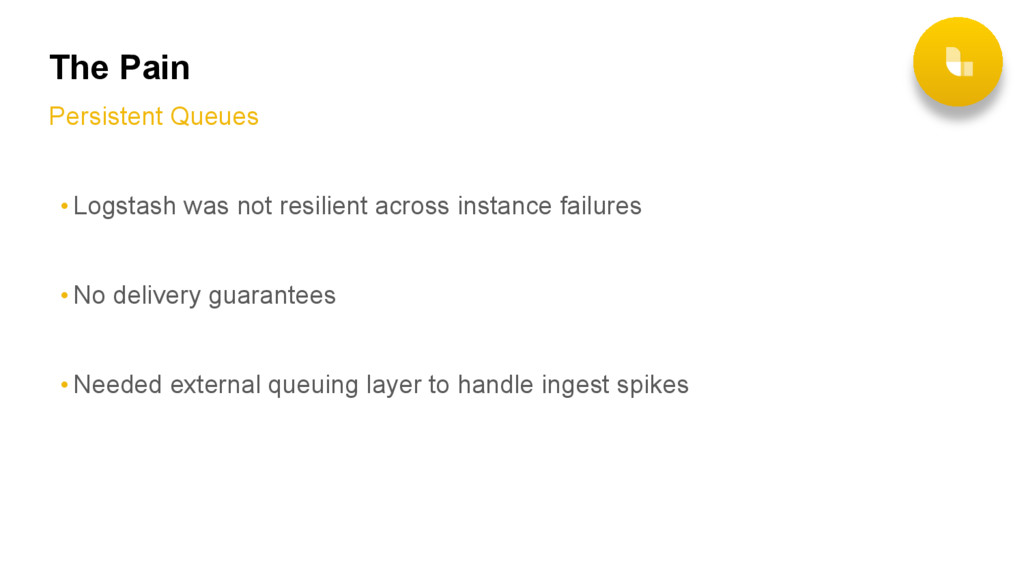
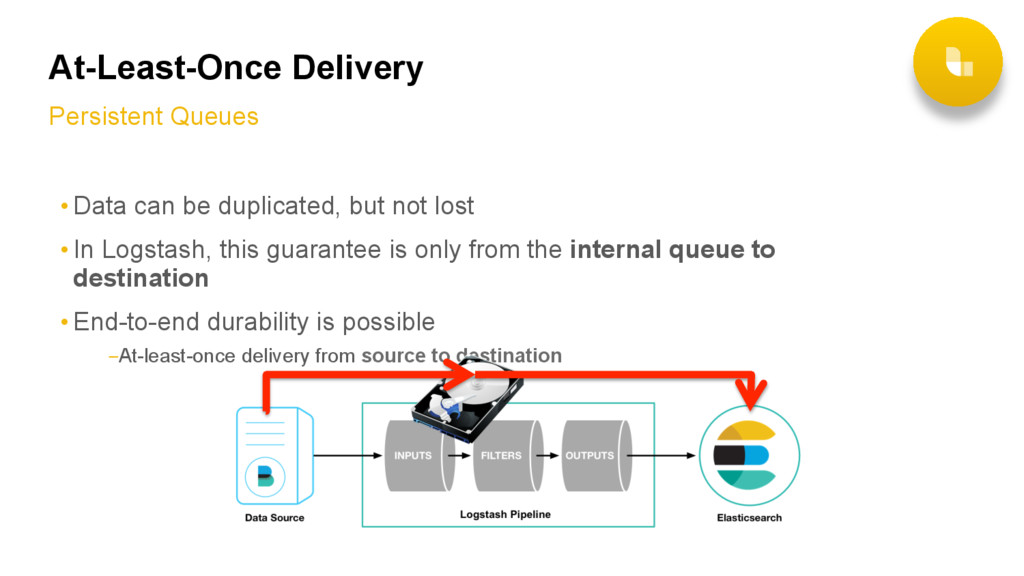
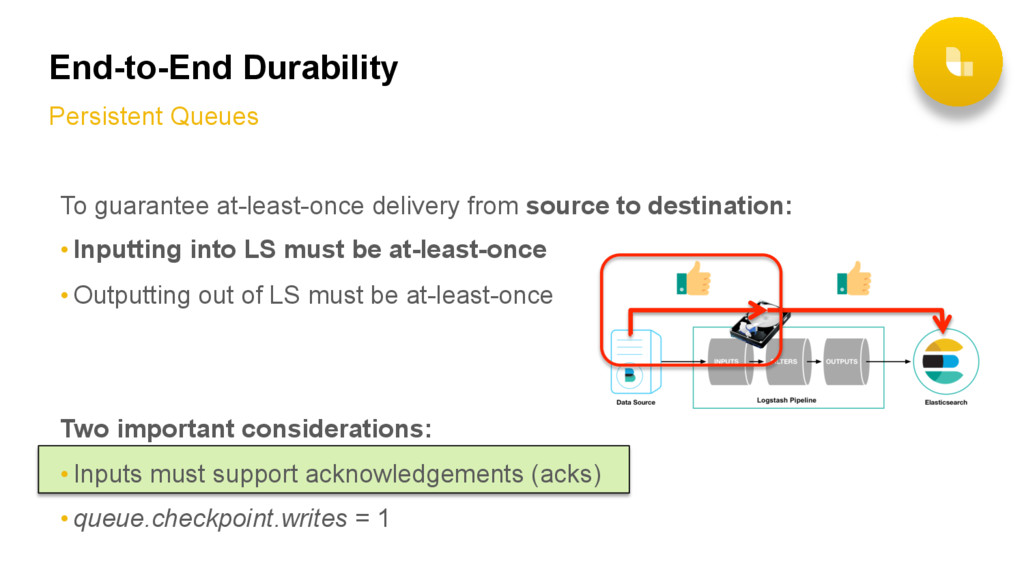
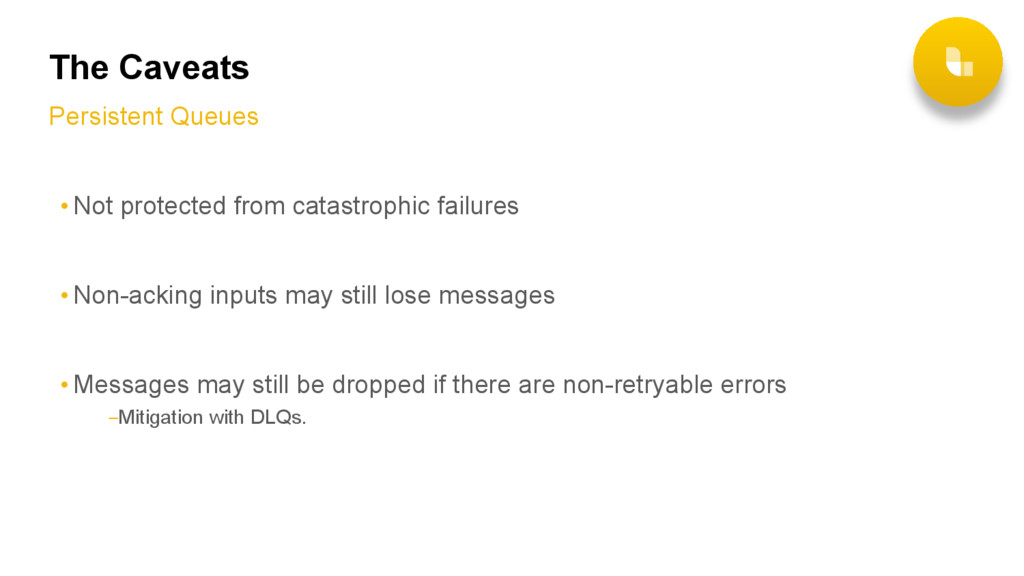
    lost • In Logstash, this guarantee is only from the internal queue to destination • End-to-end durability is possible ‒ At-least-once delivery from source to destination
  52. End-to-End Durability Persistent Queues To guarantee at-least-once delivery from source

    to destination: • Inputting into LS must be at-least-once • Outputting out of LS must be at-least-once Two important considerations: • Inputs must support acknowledgements (acks) • queue.checkpoint.writes = 1
  53. End-to-End Durability Persistent Queues Inputs that ack: • Beats (only Filebeat

    / Winlogbeat) • Kafka • RabbitMQ • HTTP • Others…
  54. Elastic Queuing Persistent Queues • Handle ingestion spikes natively with variable

    length queuing • Configure by max events or max byte size • Customers upgrading should be aware of settings and hardware disk size available
  55. The Caveats Persistent Queues • Not protected from catastrophic failures • Non-acking

    inputs may still lose messages • Messages may still be dropped if there are non-retryable errors ‒ Mitigation with DLQs.
  56. Capacity planning 72 Shard 1 Shard 1 limit ~ 40GB

    S2 Smax S1 S3 Indexing Querying Indexing Querying Indexing Querying add data Add shard
  57. v1.7 v2.4 v5.x 1.x Lucene 4 1.x Lucene 4 2.x

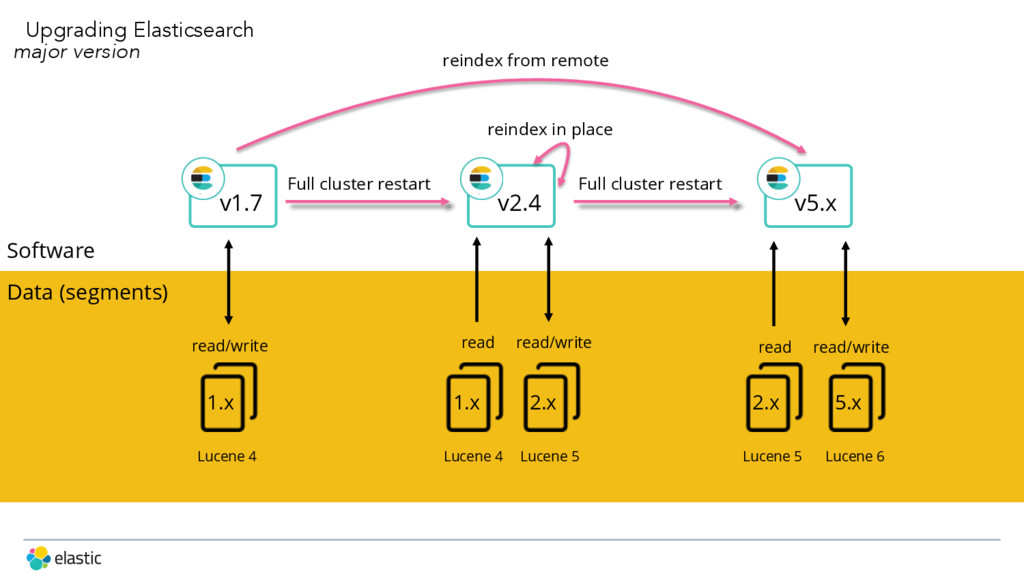
    Lucene 5 2.x Lucene 5 5.x Lucene 6 read/write read read/write read read/write Full cluster restart Full cluster restart reindex from remote reindex in place Data (segments) Software Upgrading Elasticsearch major version
  58. Resources: Upgrading to 5.0 75 •  Webinar - Upgrade your

    Elastic Stack to 5.0 (Nov 29) •  Documentation - see cross-stack upgrade guide •  Elastic Support & Services
  59. Customer 360 view 78 •  Swiss Life is a major

    player in insurance and wealth management •  Swiss Life France: company-wide strategic project Digital Foundation •  Digitize its system architecture across all of its web and mobile-enabled portals and applications •  The Vision 360 project: customer information. •  10 customer records
  60. Customer 360 view 79 •  Difficulties ✦  make data consistently

    accessible to different audiences ✦  private and business clients, sales people, insurance brokers, and customer service representatives.
  61. Customer 360 view 80 • support for real-time queries across data:

    ๏  customer records, contract data, market segmentation data, and pension and insurance scoring information • Single point of exposure for all kind of customers data ๏  MySwissLife customer website and mobile application • Information is propagated to the index in less than 10 seconds • Speed and reliability are therefore critical
  62. Customer 360 view 81 •  “visibility restrictions” ✦  sales people

    can access and view data for their own territory •  Allow the control of access to sensitive and certain customer data •  Multi-cluster monitoring •  Approximately 23 million documents •  Two indices: Client-oriented & Contract-oriented