Upgrade to Pro — share decks privately, control downloads, hide ads and more …

Elastic{ON} Tour 2018 Munich : Ingest

Elastic Co
February 01, 2018

Elastic{ON} Tour 2018 Munich : Ingest

Elastic{ON} Tour Munich - February 1, 2018

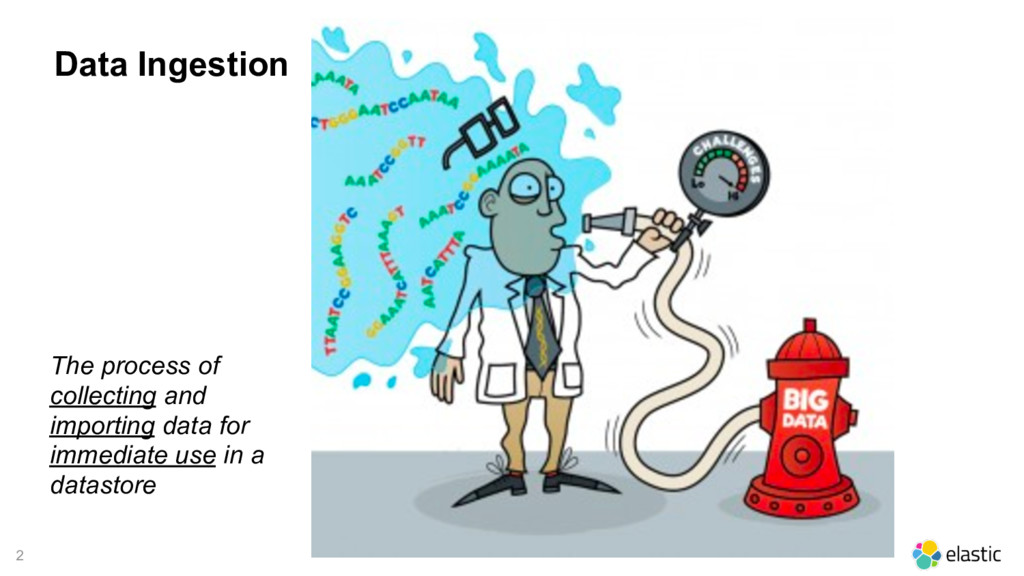
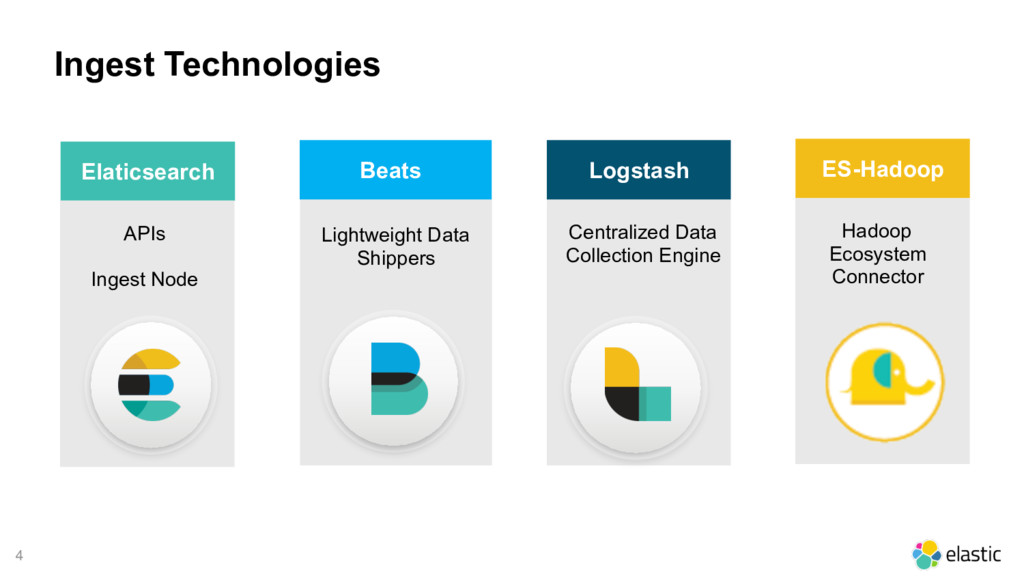
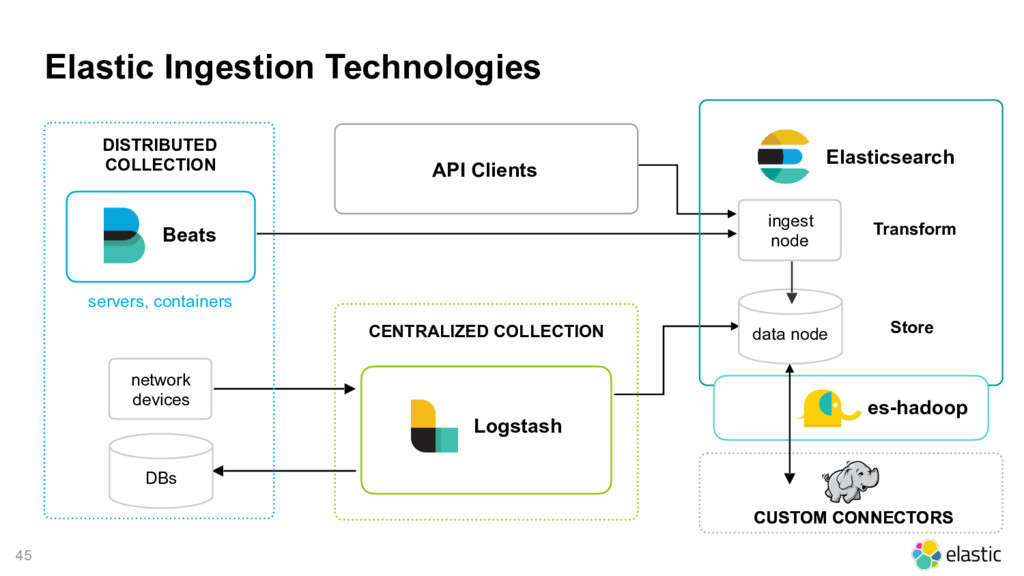
Walk through all things ingest for Logstash 5.x, from dead letter and persistent queues to the Grok Debugger and new monitoring APIs. Then get caught up on new lightweight data shipper additions like Heartbeat and Metricbeat, as well as new modules that simplify the getting started process.

Monica Sabru | Beats Team Lead | Elastic

Elastic Co

February 01, 2018
Tweet

More Decks by Elastic Co

Other Decks in Technology

Transcript

  1. 4 Ingest Technologies Lightweight Data Shippers Beats Centralized Data Collection

    Engine Logstash Hadoop Ecosystem Connector ES-Hadoop APIs Ingest Node Elaticsearch
  2. 8 Elastic Ingestion Technologies network devices DB data CENTRALIZED COLLECTION

    Logstash DISTRIBUTED COLLECTION Beats servers, containers Elasticsearch Transform Store ingest node data node Flows JDBC
  3. Elastic Ingestion Technologies CENTRALIZED COLLECTION Logstash Elasticsearch Transform Store ingest

    node data node 11 network devices DISTRIBUTED COLLECTION Beats servers, containers
  4. 12 Easy migration between ingest technologies Ingest Node to Logstash

    conversion tool Elasticsearch ingest node Logstash ingest node
  5. 14 Use Cases Common Log Formats System Web Servers Queues

    Turnkey Monitoring Infrastructure Containers Databases Application tracing Node.js Python Coming: RUM,Ruby Logging Metrics APM SecOps Dashboards Audit Firewalls, IDS/IPS SIEM Augmentation Security
  6. 15 Modules: Data sources made easy • Collect specific type

    of data • Parse and enrich it • Default dashboards, alerts, ML jobs $ ./filebeat modules enable nginx $ vim modules.d/nginx.yml $ ./filebeat setup $ ./filebeat -e
  7. 17 Metricbeat modules (introduced in 5.0) Aerospike Apache Ceph Couchbase

    Docker Dropwizard Elasticsearch Golang Graphite HAProxy HTTP Jolokia Kafka Kibana Kubernetes Memcached MongoDB MySQL Nginx PHP_FPM PostgreSQL Prometheus RabbitMQ Redis System vSphere Windows ZooKeeper
  8. 20 metricbeat.autodiscover: providers: - type: docker templates: - condition: equals.docker.container.image:

    redis config: - module: redis metricsets: ["info", "keyspace"] hosts: "${data.host}:${data.port}" Autodiscovery (new in 6.1) Watch Docker events and react to changes
  9. 22 Logging Data Sources System • Linux / MacOS •

    Windows Events Containers • Docker (6.0) • Kubernetes (6.0) Infrastructure Applications Databases • MySQL • PostgreSQL (6.1) Queues • Kafka (6.1) • Redis (6.0) Web servers • Apache • Nginx Other • HAProxy* • Zookeeper* WINLOGBEAT FILEBEAT * Near-term roadmap
  10. 23 Metrics & Event Data Applications Datastores • MySQL •

    PostgreSQL • MongoDB • Couchbase • Aerospike (6.0) • Graphite (6.1) Web servers • Apache • Nginx Other • HAProxy • Zookeeper • Prometheus Queues • Kafka • Redis • RabbitMQ (6.0) Caches • Memcached (6.0) METRICBEAT Uptime • Heartbeat Custom apps • JMX/Jolokia • PHP-FPM • Golang (6.0) • Dropwizard (6.0) HEARTBEAT * Near-term roadmap LOGSTASH
  11. 24 Metrics & Event Data System • Linux • MacOS

    • Windows • Perfmon (6.0) • WMI* Infrastructure Cloud • AWS • GCP • Azure* • DigitalOcean …. Containers • Docker • Kubernetes (6.0) Virtualization • vSphere (6.0) PACKETBEAT METRICBEAT Network • Netflow (5.6) • Packets Storage • Ceph LOGSTASH * Near-term roadmap
  12. 25 Security Data Sources Security Activity SIEM Augmentation • ArcSight

    (5.6) • more* Audit • Auditd • Auditbeat (6.0) Systems • File Access • SSH logins • Sudo attempts Applications • Connections • Users Network • IPs / GeoIP • DNS Packets • Netflow (5.6) • Firewalls* • IDS/IPS* FILEBEAT PACKETBEAT METRICBEAT LOGSTASH * Near-term roadmap
  13. 26 Auditbeat, alternative to auditd • Listen events from Linux

    Audit Framework • Group messages into a single event • Sidecar auditd or standalone • File Integrity Monitoring
  14. 27 APM (GA in 6.2) • Introducing application-level monitoring to

    the stack • Full stack monitoring • Open Source • Dedicated Kibana UI and customizable dashboards
  15. 28 Business Analytics Structured Activity Databases • JDBC input •

    JDBC filter SaaS services • Salesforce • Heroku • Github • Azure* LOGSTASH * Near-term roadmap Social media • Twitter
  16. 30 Monitoring & Management Logstash • Centralized monitoring (5.3) •

    Centralized management (6.0) Beats • Centralized monitoring (6.2) • Centralized management (7.0)
  17. Elastic Ingestion Technologies CUSTOM CONNECTORS CENTRALIZED COLLECTION Logstash API Clients

    CUSTOM CONNECTORS Elasticsearch Transform Store ingest node data node es-hadoop 45 network devices DBs DISTRIBUTED COLLECTION Beats servers, containers