Upgrade to Pro — share decks privately, control downloads, hide ads and more …

Kibana Visualizations Deep Dive

Kibana Visualizations Deep Dive

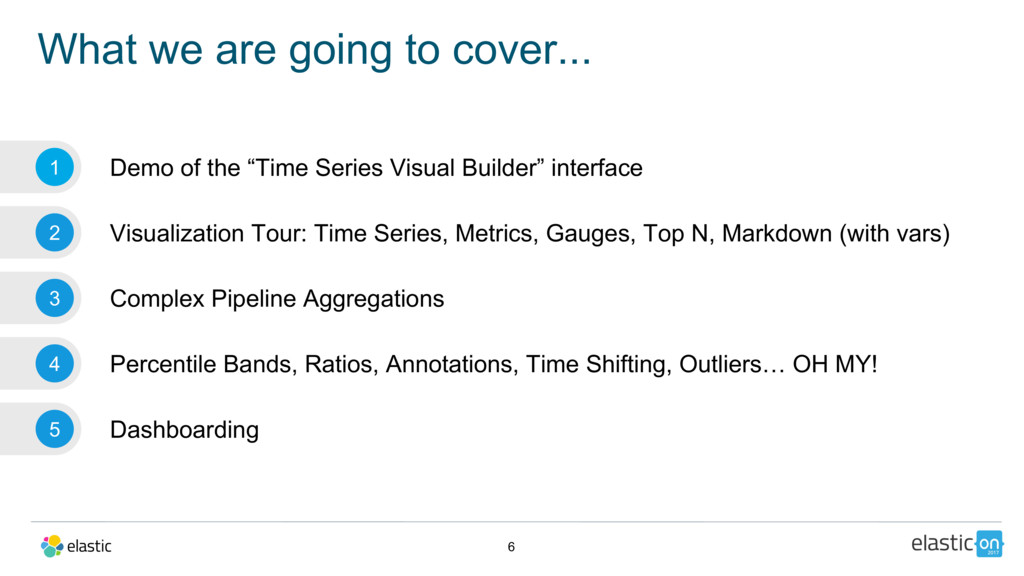
Get a detailed walkthrough of Tagcloud and Heatmap (new visualizations in Kibana 5.2), see what's coming with future geospatial visualizations, and learn about dedicated UIs for time series visualizations in Timlion and a new visual builder for pipeline aggregations.

Chris Cowan l Software Engineer l Elastic
Thomas Neirynck l Software Engineer l Elastic
Peter Pisiljar l Software Engineer l Elastic

Elastic Co

March 09, 2017
Tweet

More Decks by Elastic Co

Other Decks in Technology

Transcript

  1. Agenda 2 1 New and improved visualizations 2 Support for

    new aggregations 3 Visualizing time-series data 4 Geospatial visualizations 5 Future
  2. What we are going to cover... 6 1 Demo of

    the “Time Series Visual Builder” interface 2 Visualization Tour: Time Series, Metrics, Gauges, Top N, Markdown (with vars) 3 Complex Pipeline Aggregations 4 Percentile Bands, Ratios, Annotations, Time Shifting, Outliers… OH MY! 5 Dashboarding
  3. • Summer 2016, MapQuest shuts down map service • Elastic

    now hosts their own map service • Open street maps data • 18 levels with X-pack installed • Kibana discovers capabilities dynamically • Thank you Infra Team! New Tile Maps 9 5.2
  4. • similar to feature in Kibana 3 • color coded

    thematic maps (“choropleth maps”) • Possible to map ES-data that does not have a geo_* field (do “inner join”) DEMO • Ships with base map for World countries and USA States • Bring your own vector data! Vector Maps 1 0 Coming in 5.x
  5. • In short order ... • improved UX (scroll, pinch,

    touch support) • default support for geo-centroid aggregation DEMO • … followed by • allows maps to only request data from ES within the visible bounds • visualize 2 metrics on a single symbol: marker size and color represent a different metric Other map improvements 1 1 Coming in 5.x Marker placement
  6. • Full stack geo support • base-mapping with tiles.elastic.co •

    storage and search of geo-data with Elasticsearch • ETL with Logstash/Beats • visualize and explore with Kibana • Community involvement in the domain • we have the momentum to expand on this • FYI: Codepalousa 2017, June 8, Louisville, KY Future 13 Elastic stack as a Geographic Information System (GIS)
  7. • Let a 1000 UIs bloom: new user interfaces and

    visualization types • e.g. Timeseries and Timelion are examples of new UX to produce visualizations • “Unexpected apps” • Kibana for everyone — developers, technical, non-technical business users Future 14 Beyond 5.x
  8. • The Visualize app has significant community contributions • bug

    fixes/enhancements • community plugins • We like to see even more of this • ensures relative stability of interfaces/API • informs our road map Community 15 Contribute and extend
  9. 19 • axis position • axis mode • axis scale

    type • label configurations Multiple Y Axes - cont.
  10. 21 • combining charts • switching types back and forth

    • new stacking possibilities Multiple Chart Types
  11. 24 • two category axes (X and Y) • individual

    values contained in a matrix are represented as colors Heatmap Chart
  12. 26 • Try to keep your use of bullet slides

    to a minimum (Arial 35 pt) Be creative and think visually (Arial 35 pt) If you need to source something copy and paste the text box at the bottom left onto your page (Arial 35 pt) Tagcloud
  13. 31 • community PR • super powerful • opens up

    many doors This is a sample image Top Hits
  14. 32 • finally ! • parent pipeline aggs • sibling

    pipeline aggs This is a sample image Pipeline aggregations