Upgrade to Pro — share decks privately, control downloads, hide ads and more …

Security, Alerting, Monitoring, and More With the Elastic Stack

Elastic Co
February 18, 2016

Security, Alerting, Monitoring, and More With the Elastic Stack

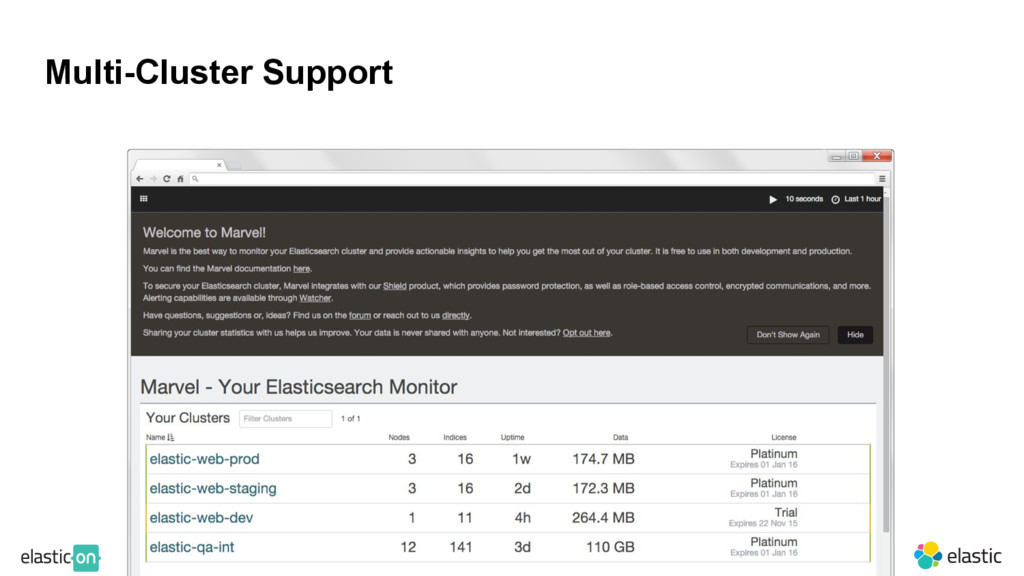
Elastic's Jay Modi, Alexander Reelsen, Joe Fleming, Tanguy Leroux, and Tim Sullivan present X-Pack — and all the cool features it brings to the Elastic Stack — at Elastic{ON}16 in San Francisco on February 18, 2016.

Elastic Co

February 18, 2016
Tweet

More Decks by Elastic Co

Other Decks in Technology

Transcript

  1. ‹#›
    Security, Alerting,
    Monitoring and More
    with the Elastic Stack

    View Slide

  2. Monitoring
    Tanguy Leroux
    Tim Sullivan
    @tlrx
    @timsullivanyeah
    All the Things

    View Slide

  3. ‹#›
    Logging and monitoring are at the
    heart of making sure your solutions
    are up and running to your
    expectations.
    - David Messina
    VP, Enterprise Marketing at Docker’s VP of Enterprise Marketing

    View Slide

  4. ‹#›
    And then Marvel 1.0
    Arrived
    First commercial plugin of Elastic!

    View Slide

  5. Cluster Pulse
    5

    View Slide

  6. ‹#›

    View Slide

  7. ‹#›

    View Slide

  8. ‹#›
    Monitoring for
    Elasticsearch 2.x
    Yes, we like to rename things :)

    View Slide

  9. Multi-Cluster Support
    9

    View Slide

  10. Cluster Overview at a Glance
    10

    View Slide

  11. Node Listing
    11

    View Slide

  12. ‹#›

    View Slide

  13. 19
    Kibana 5
    New design
    Issues
    Cross-Stack
    Monitoring

    View Slide

  14. ‹#›
    Spotlight Theater @ 4:40pm
    Monitoring Elasticsearch

    View Slide

  15. Security
    Don’t Hack Me Bro!
    Jay Modi @jaymode2001

    View Slide

  16. 16
    Security for the Elastic Stack
    • Username/password protection
    Simply 
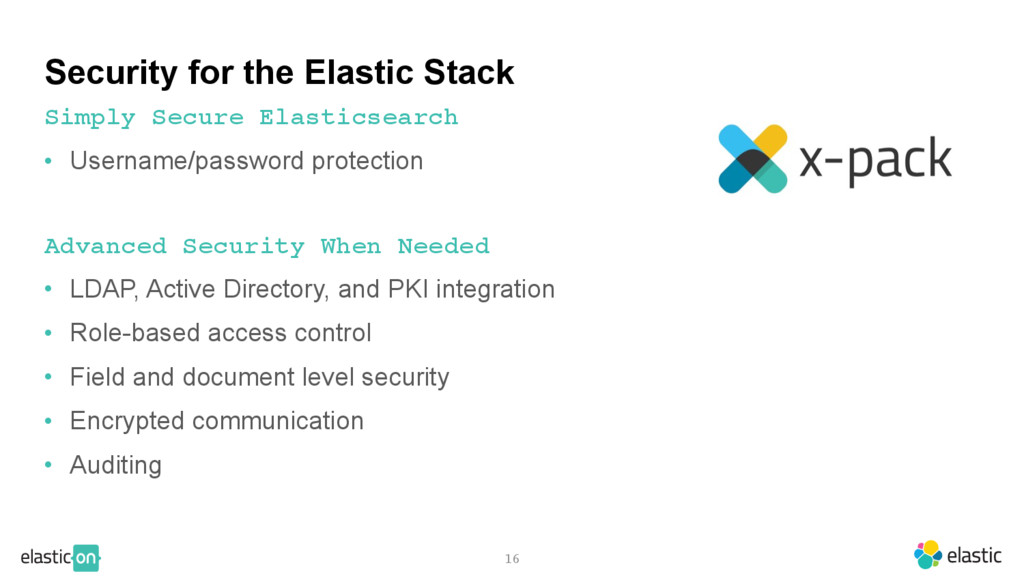
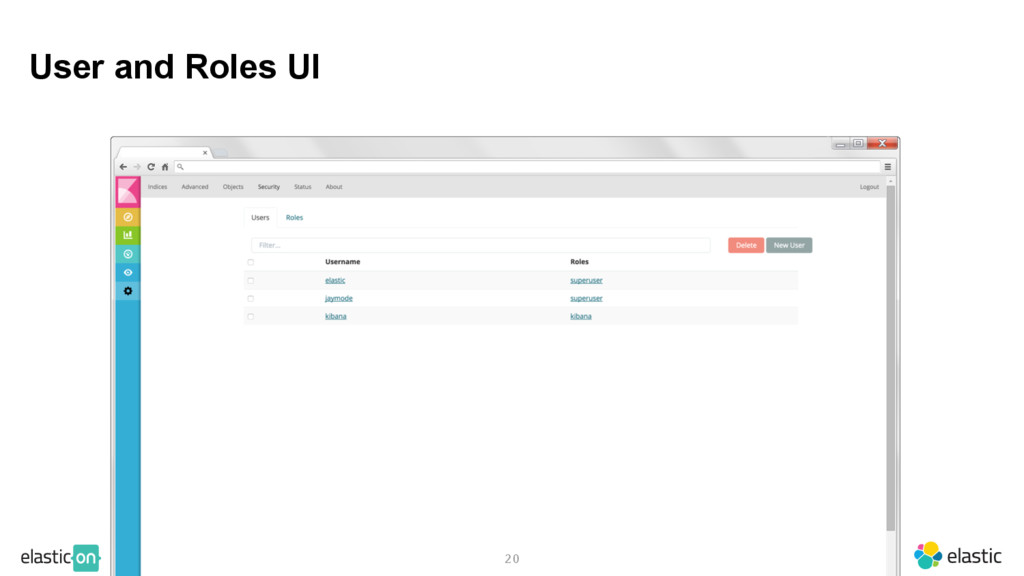
Secure Elasticsearch
    Advanced Security When Needed
    • LDAP, Active Directory, and PKI integration
    • Role-based access control
    • Field and document level security
    • Encrypted communication
    • Auditing

    View Slide

  17. Adding Users (now)
    Command Line Utility
    17
    $ bin/shield/esusers useradd jaymode -r admin
    Enter new password:
    Retype new password:

    View Slide

  18. Security APIs
    User and Role management
    18
    curl –XPUT localhost:9200/_shield/user/jaymode –d ‘
    {
    "roles" : ["engineering", "security"],
    "password" : "changeme"
    }’
    curl –XPUT localhost:9200/_shield/role/security –d ‘
    {
    "cluster": ["all"],
    "indices": [
    {
    "names": ".shield_audit_log-*",

    "privileges": ["all"]
    }
    ]
    }’

    View Slide

  19. Kibana Sessions and Login Screen
    19

    View Slide

  20. User and Roles UI
    20

    View Slide

  21. ‹#›
    Security Configuration API & UI

    View Slide

  22. ‹#›
    Kibana Security

    View Slide

  23. ‹#›
    Built In Users

    View Slide

  24. ‹#›
    Spotlight Theater @ 2:40pm
    Securing Elasticsearch

    View Slide

  25. Alerting
    Watch This!
    Alexander Reelsen @spinscale

    View Slide

  26. ‹#›
    Notify me on chat, if we have
    over 1000 orders per hour
    - The Startup CEO

    View Slide

  27. ‹#›
    Trigger an alert, when the
    same IP accesses all
    services in a certain interval
    - Your Admin

    View Slide

  28. ‹#›
    Email me when the product
    is back in stock!
    - Desperate Online Shopper

    View Slide

  29. ‹#›
    5% traffic increase in the last
    5 minutes.
    Ping folks on chat!
    - Your Loadbalancer

    View Slide

  30. ‹#›
    5% traffic increase in the last
    5 minutes at 2am.
    Pager time!
    - Not your SO

    View Slide

  31. ‹#›
    Can you predict the
    additional system resources
    for the next two weeks?
    - Every system architect ever

    View Slide

  32. 32
    A Watch consists of…
    • Trigger
    • Input
    • Condition
    • Actions
    • Metadata
    • Transformation

    View Slide

  33. {
    }
    33
    PUT /_watcher/watch/cluster_health

    View Slide

  34. {
    "trigger" : {
    "schedule" : { "interval" : "10s" }
    }
    }
    34
    PUT /_watcher/watch/cluster_health

    View Slide

  35. {
    "trigger" : {
    "schedule" : { "interval" : "10s" }
    },
    "input" : {
    "http" : {
    "request" : { "url" : "http://localhost:9200/_cluster/health" }
    }
    }
    }
    35
    PUT /_watcher/watch/cluster_health

    View Slide

  36. {
    "trigger" : {
    "schedule" : { "interval" : "10s" }
    },
    "input" : {
    "http" : {
    "request" : { "url" : "http://localhost:9200/_cluster/health" }
    }
    },
    "condition" : {
    "compare" : { "ctx.payload.status" : { "eq" : "red" } }
    }
    }
    36
    PUT /_watcher/watch/cluster_health

    View Slide

  37. {
    "trigger" : {
    "schedule" : { "interval" : "10s" }
    },
    "input" : {
    "http" : {
    "request" : { "url" : "http://localhost:9200/_cluster/health" }
    }
    },
    "condition" : {
    "compare" : { "ctx.payload.status" : { "eq" : "red" } }
    },
    "actions" : {
    "send_email" : {
    "email" : {
    "to" : "[email protected]",
    "subject" : "Cluster Status Warning",
    "body" : "Cluster status is RED"
    }
    }
    }
    }
    37
    PUT /_watcher/watch/cluster_health

    View Slide

  38. ‹#›
    Recap

    View Slide

  39. 2.0: Hipchat action
    39
    "actions" : {
    "notify-hipchat" : {
    "hipchat" : {
    "account" : "integration-account",
    "message" : {
    "body" : "@{{ctx.metadata.userOnDuty}} Encountered
    {{ctx.payload.hits.total}} errors in the last 5 minutes
    (facepalm)",
    "format" : "text",
    "color" : "red",
    "notify" : true
    }
    }
    }
    }

    View Slide

  40. 2.0: Slack action
    40
    "actions" : {
    "notify-slack" : {
    "slack" : {
    "message" : {
    "from" : "watcher",
    "to" : [ "#admins", "#errors" ] ,
    "text" : "Monitoring incident",
    "attachments" : [ {
    "text" : "@{{ctx.metadata.userOnDuty}} Encountered
    {{ctx.payload.hits.total}} errors in the last 5 minutes
    (facepalm)",
    "title" : "text",
    "color" : "danger" ] }
    ...

    View Slide

  41. 2.0: Activate/Deactivate REST API
    41
    PUT /_watcher/watch//_activate
    PUT /_watcher/watch//_deactivate

    View Slide

  42. 2.0: Array Compare
    42
    "condition": {
    "array_compare": {
    "ctx.payload.aggregations.top_tweeters.buckets" : {
    "path": "doc_count",
    "gte": {
    "value": 25,
    "quantifier": "some"
    }
    }
    }
    }

    View Slide

  43. 2.1: Chained inputs
    43
    "input" : {
    "chain": {
    "inputs": [
    {
    "first": { "simple" : { "path" : "/_search" } }
    },
    {
    "second": { "http" : { "request" : { … } } }
    }
    ]
    }
    }
    ...
    }

    View Slide

  44. 2.1: Chained inputs
    44
    {{ctx.payload.second.hits.total}}
    {{ctx.payload.first.path}}
    "input"
    "chain"
    "inputs"
    "first"
    "second"
    }
    }
    ...
    }

    View Slide

  45. 2.3: PagerDuty action
    45
    "actions" : {
    "notify-pagerduty" : {
    "pagerduty" : {
    "message" : {
    "description" : "Main system down, please check!
    Happened at {{ctx.execution_time}}",
    "client" : "/foo/bar/{{ctx.watch_id}}",
    "attach_payload" : true,
    "context" : [ {
    "type" : "response",
    "href" : "http://www.test.de/foo" }
    ]
    ...

    View Slide

  46. 2.3: External email attachments
    46
    "actions" : {
    "email_admin" : {
    "email" : {
    "to" : "[email protected]",
    "attachments" : {
    "my_id" : {
    "http" : {
    "request" : {
    "url" : "http://example.org/daily-report.pdf"
    }
    }
    }
    }
    }
    ...

    View Slide

  47. ‹#›
    What's next?

    View Slide

  48. ‹#›
    Curator

    View Slide

  49. ‹#›
    Watcher UI

    View Slide

  50. ‹#›
    Actions

    View Slide

  51. ‹#›
    Friday, Lunch area @ 11:00am
    BoF: Alerting & Notifications
    Share Your Watcher Stories

    View Slide

  52. Reporting
    Kibana For Your Inbox
    Joe Fleming @w33ble

    View Slide

  53. ‹#›
    I need this information.
    Can you send me a report?
    - Every Manager Ever

    View Slide

  54. 54

    View Slide

  55. 55

    View Slide

  56. ‹#›
    Network’s down.
    Meeting’s over.
    - No Manager Ever

    View Slide

  57. View Slide

  58. View Slide

  59. Delivery with Alerting
    59
    "actions" : {
    "email_admin" : {
    "email" : {
    "to" : "[email protected]",
    "attachments" : {
    "my_id" : {
    "http" : {
    "request" : {
    "url" : "http://example.org/daily-report.pdf"
    }
    }
    }
    }
    }
    ...

    View Slide

  60. ‹#›
    5.0 Alpha 1

    View Slide

  61. ‹#›
    Distributed Rendering

    View Slide

  62. ‹#›
    Administrative Control

    View Slide

  63. ‹#›
    Historical Archive

    View Slide

  64. ‹#›
    Spotlight Theater @ 3:40pm
    From Dashboard to PDF
    Generate Reports with the Elastic Stack

    View Slide

  65. 65

    View Slide

  66. ‹#›
    Monitoring Elasticsearch
    Securing Elasticsearch From Dashboard to PDF
    BoF: Alerting & Notifications
    Spotlight Theater: 2:40pm Spotlight Theater: 3:40pm
    Spotlight Theater: 4:40pm Lunch Area: Friday at 11:00am

    View Slide