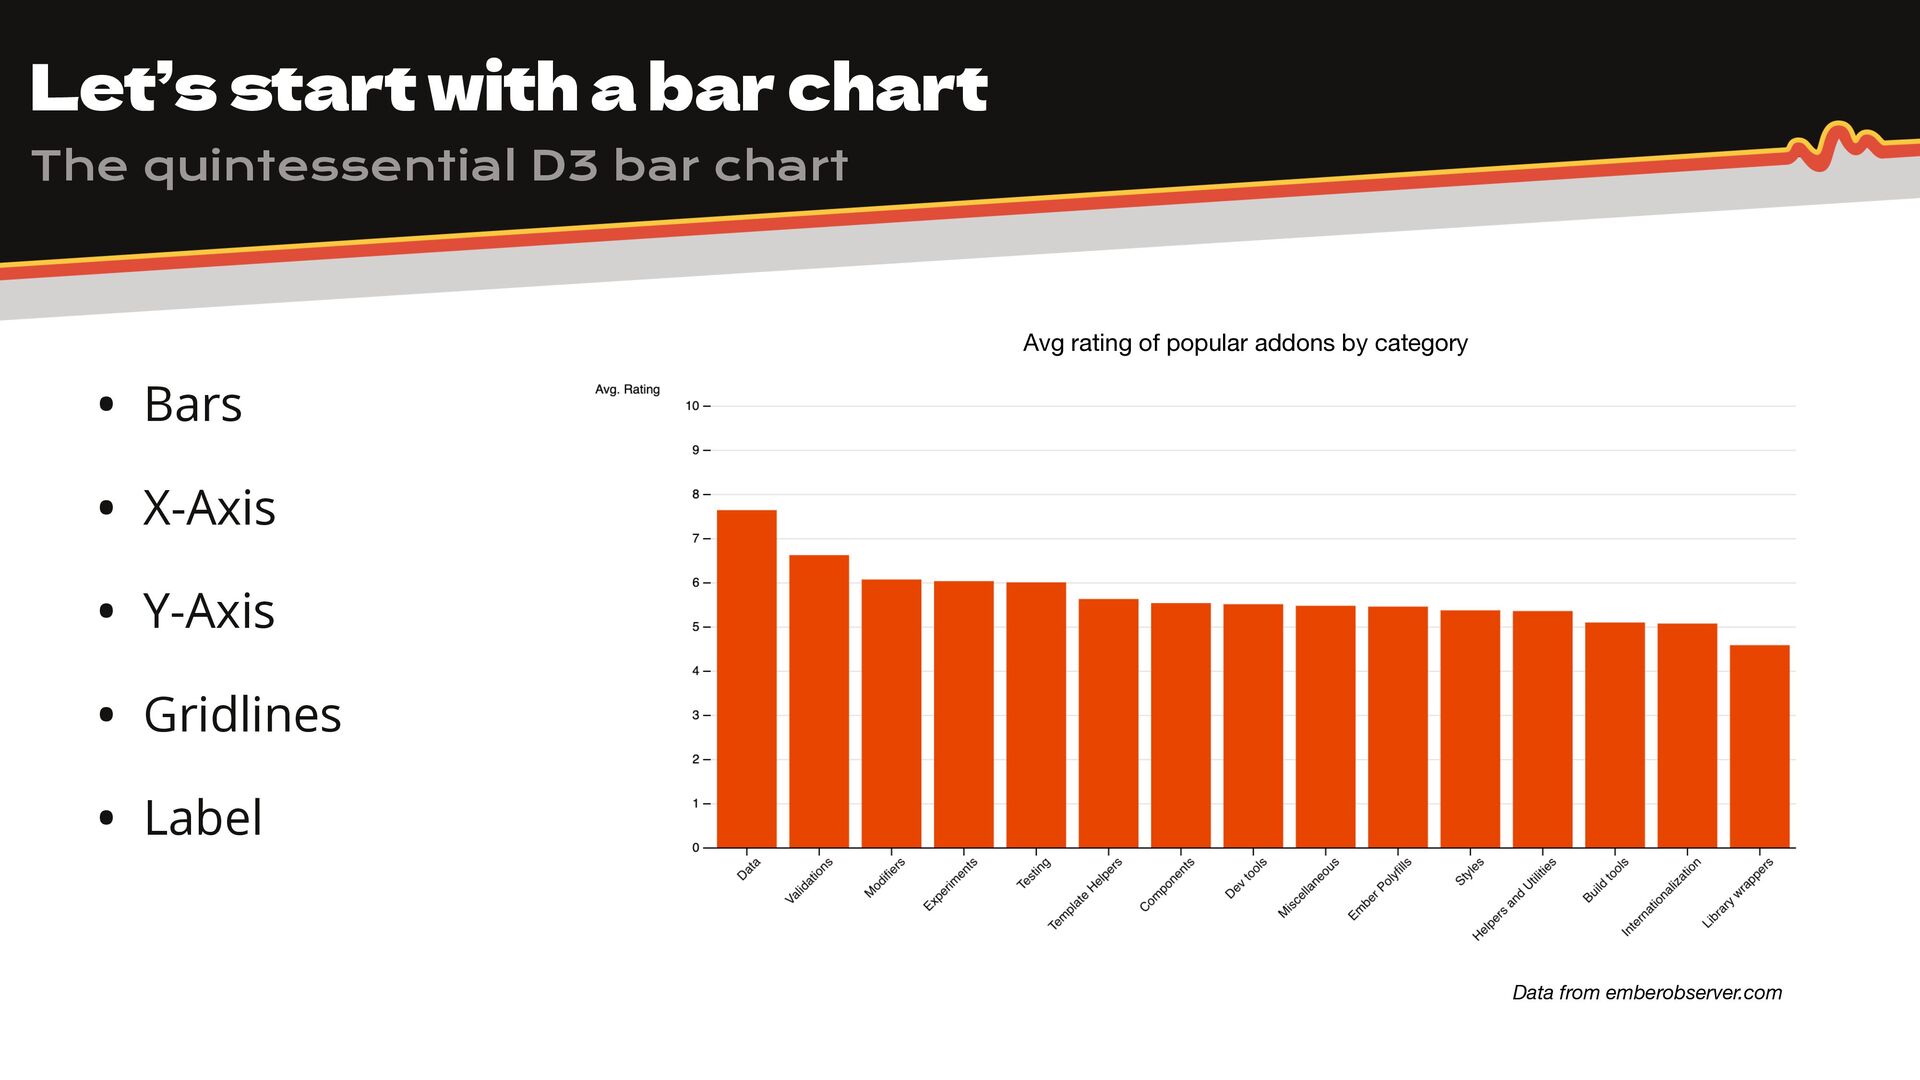
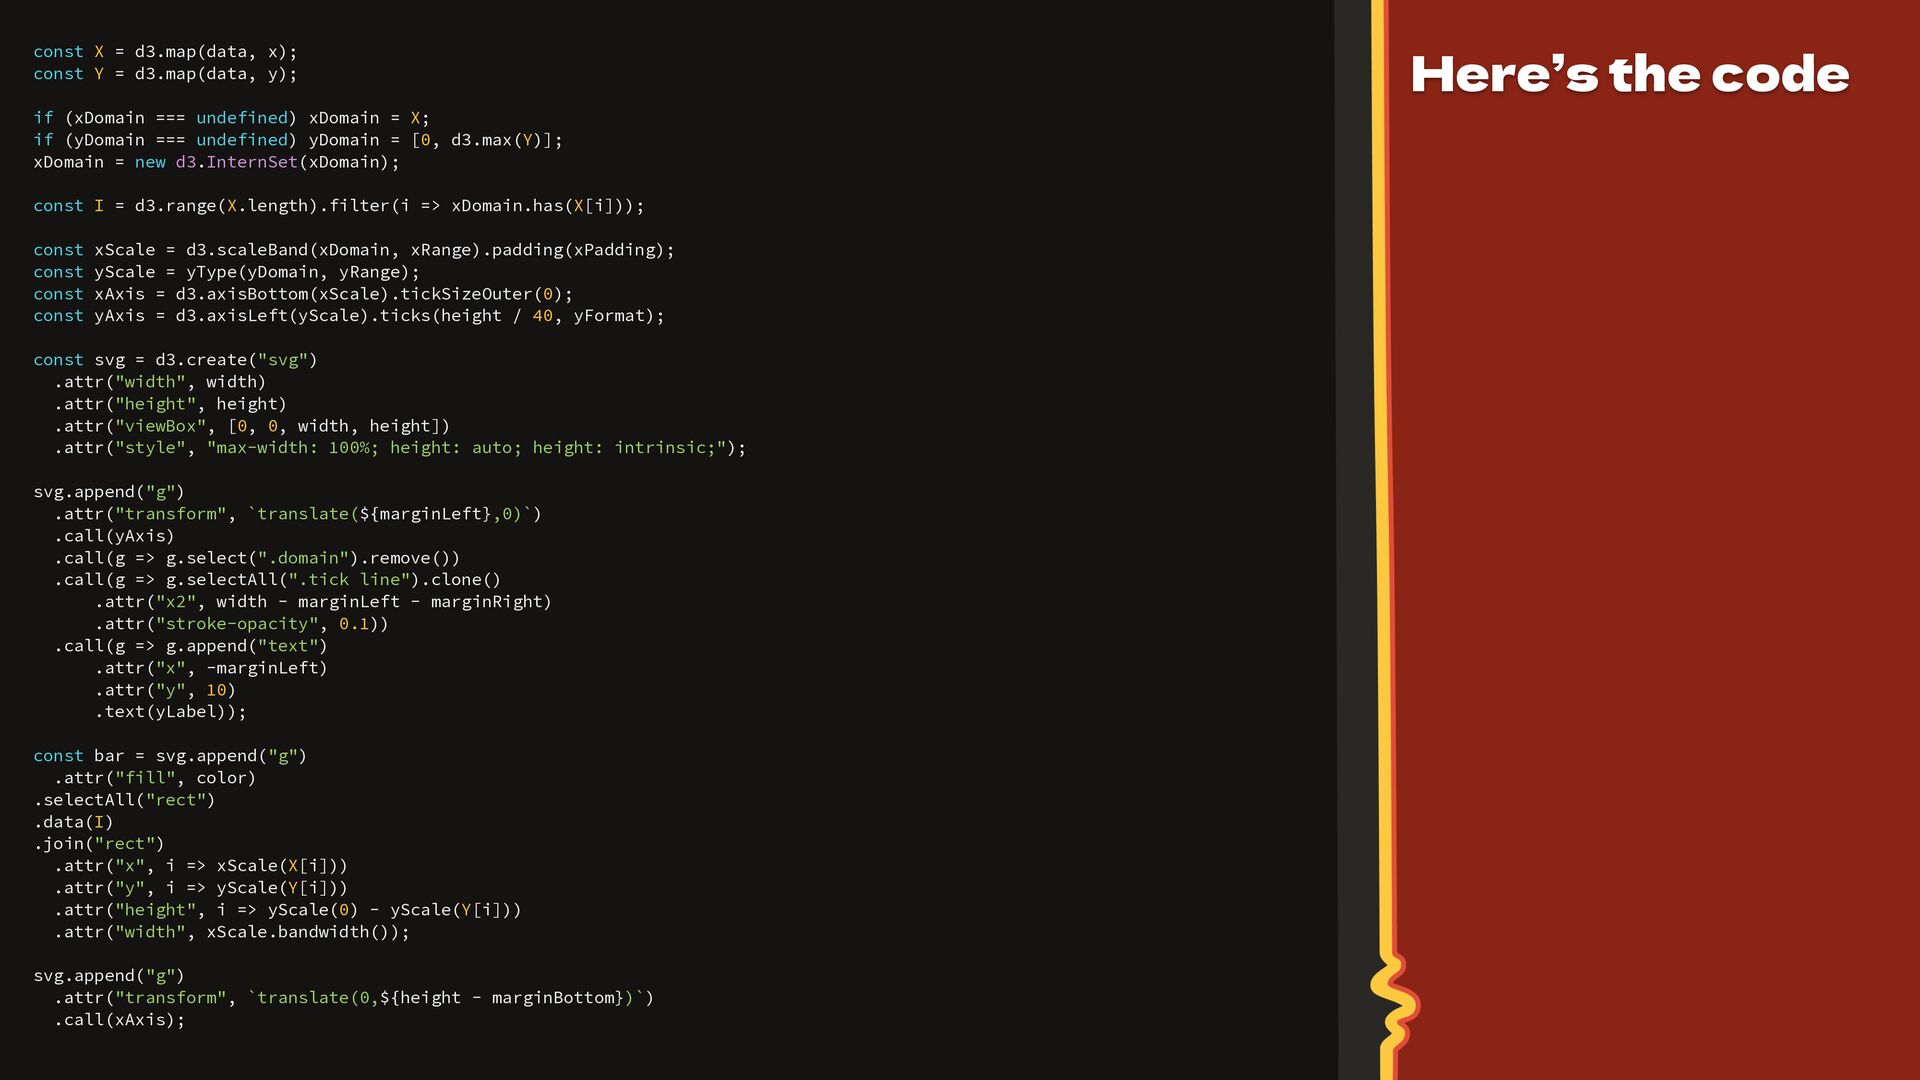
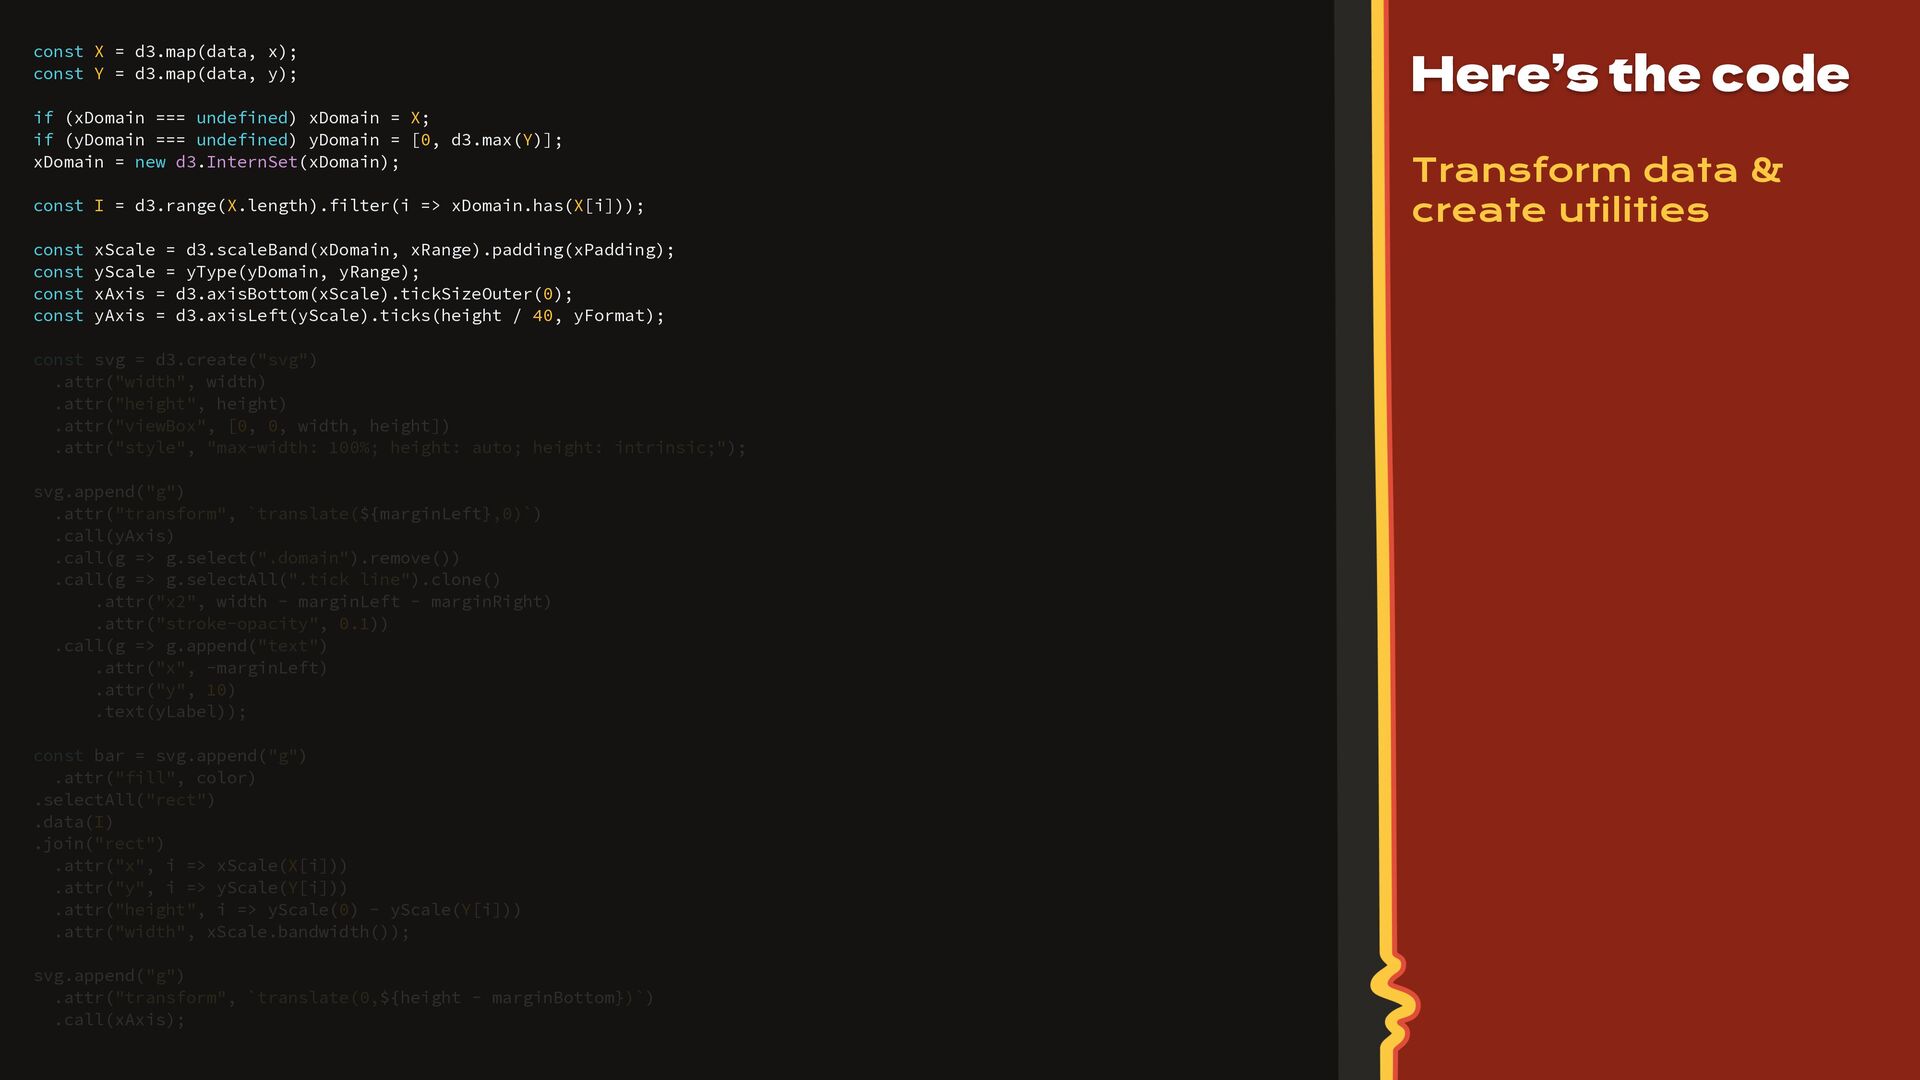
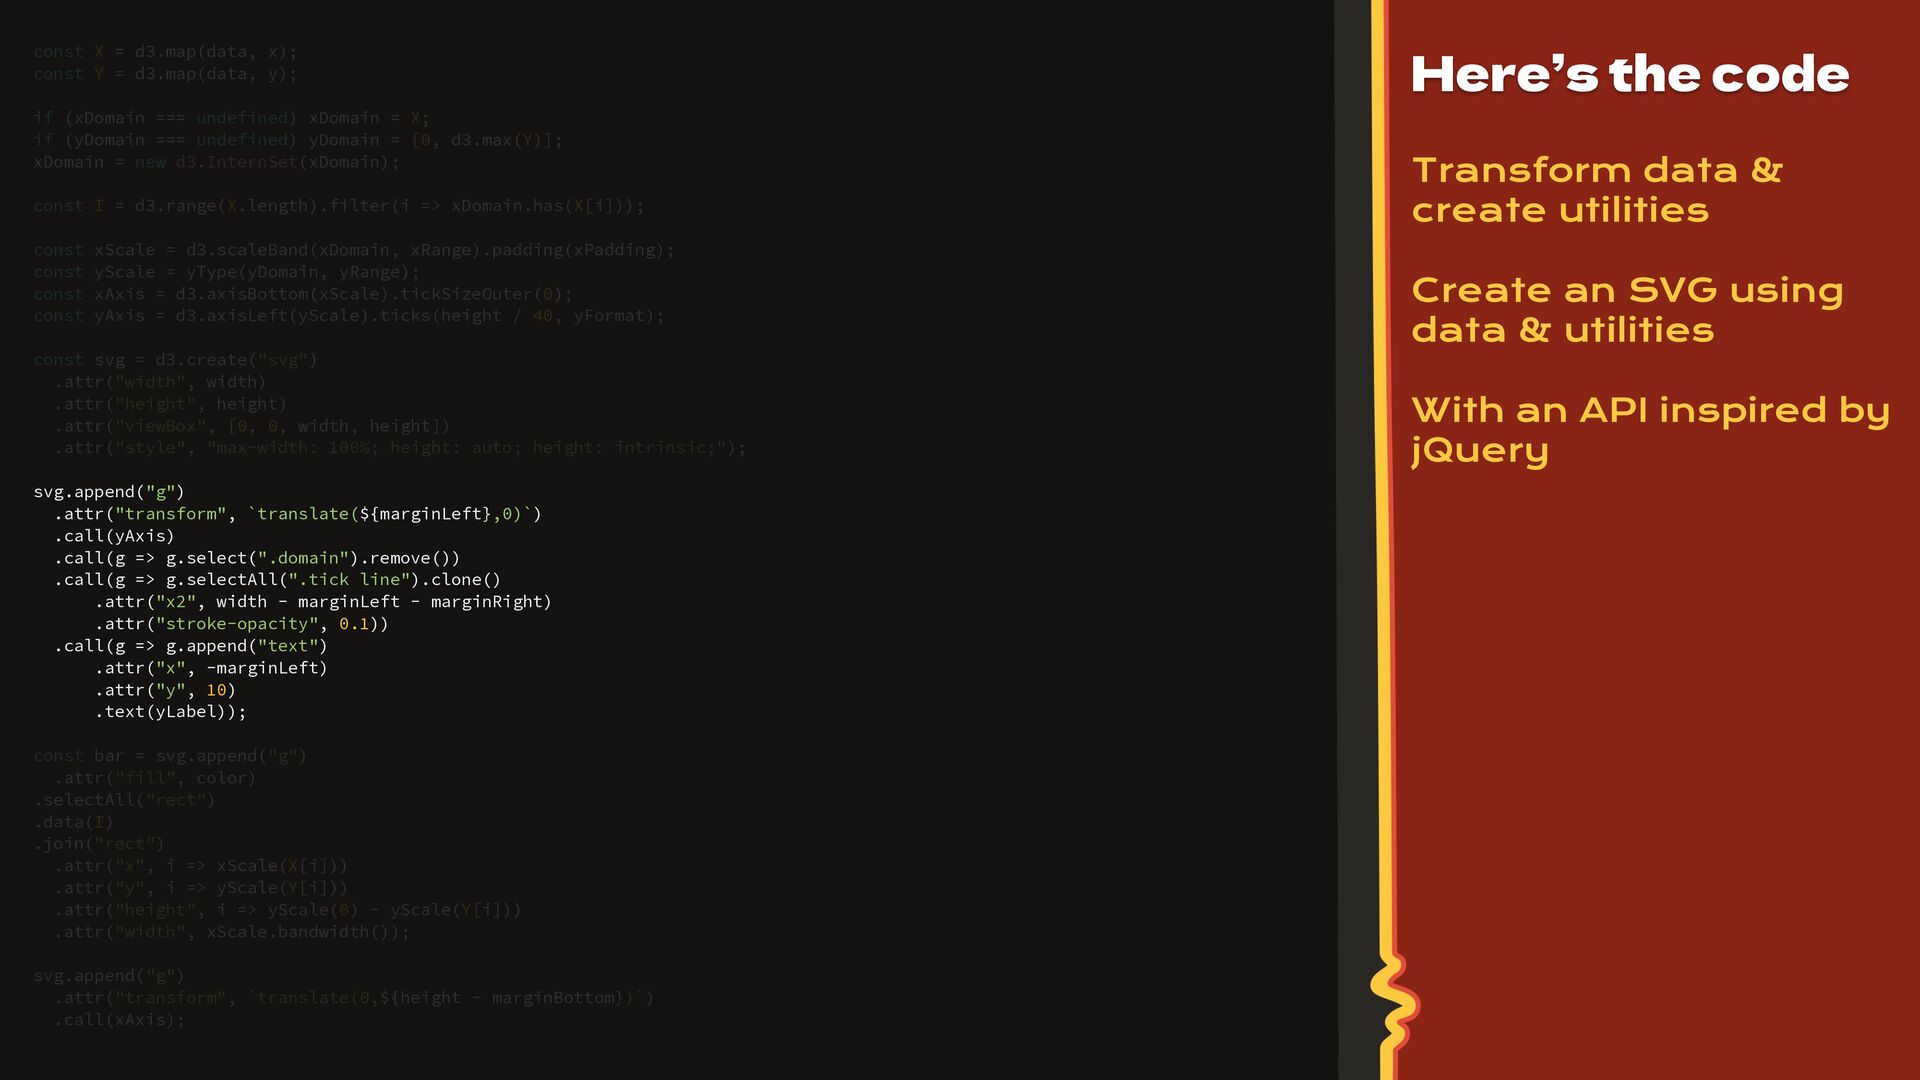
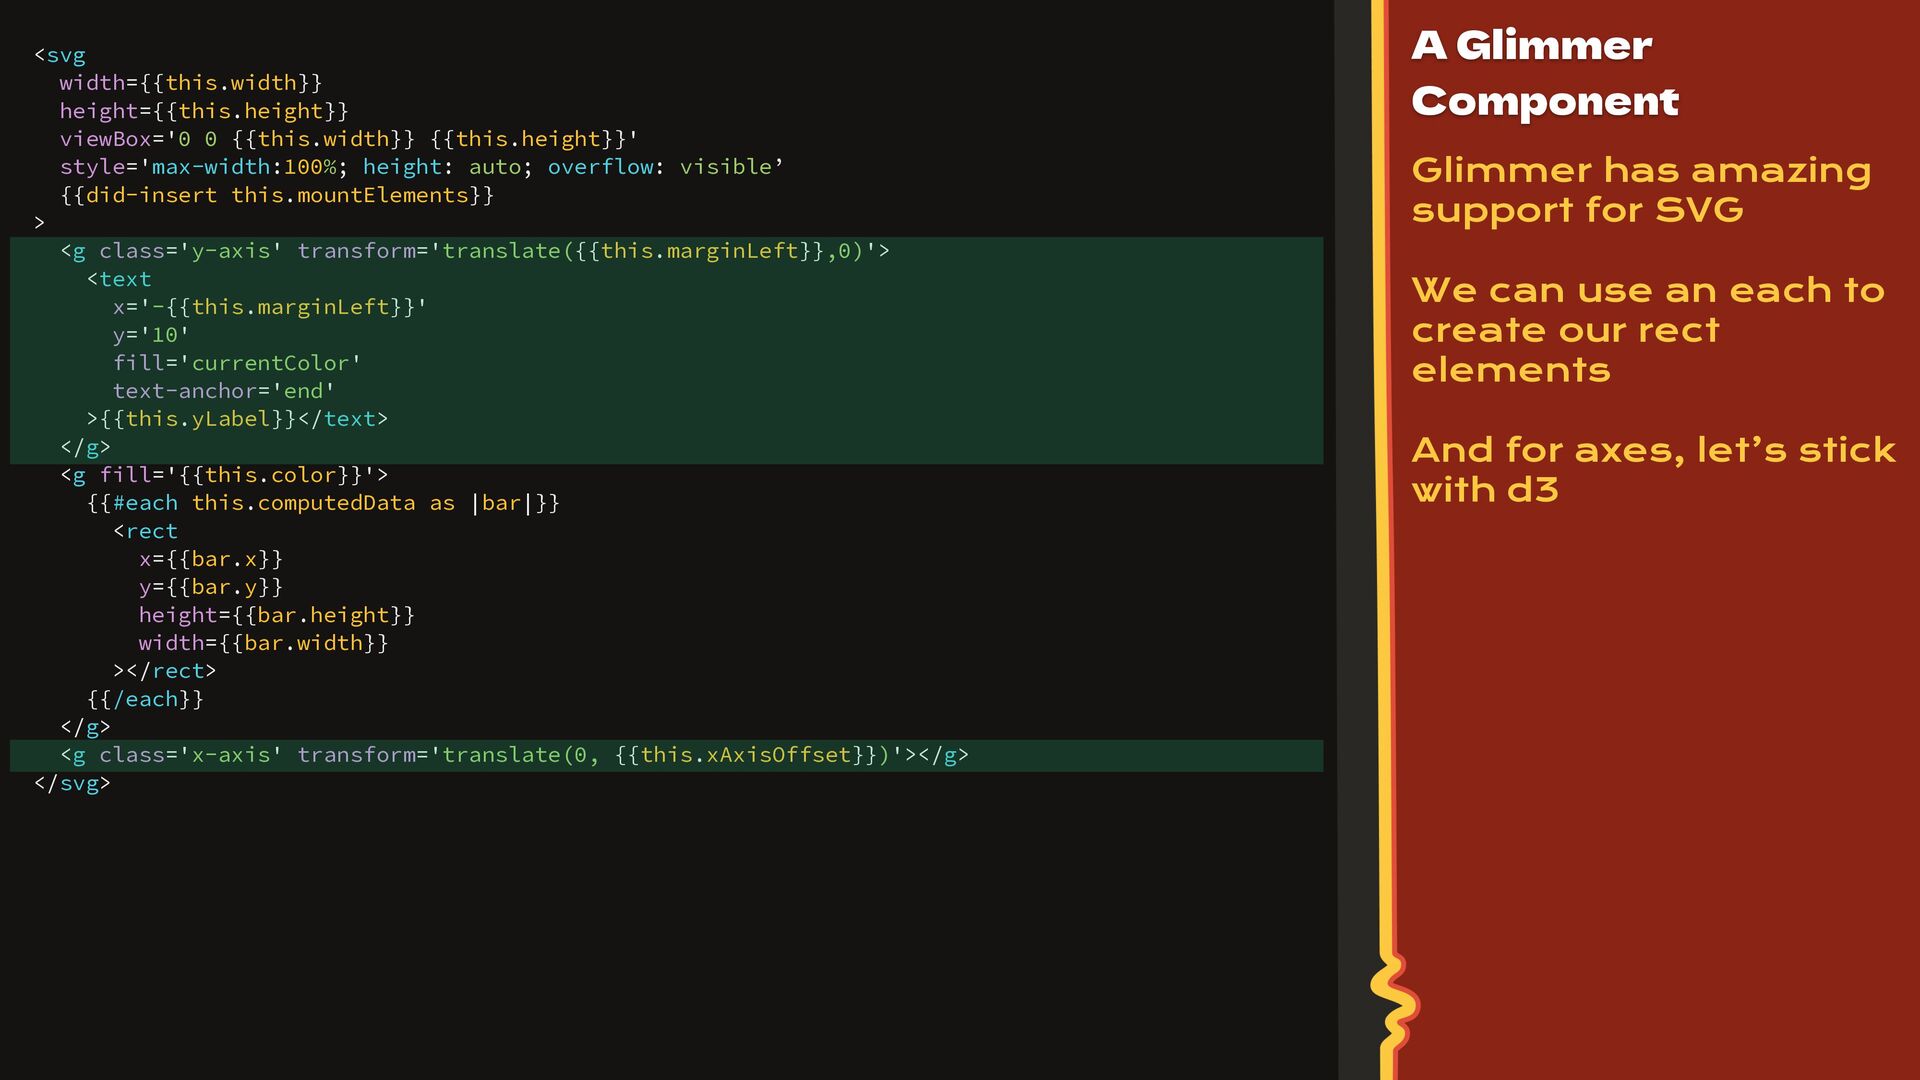
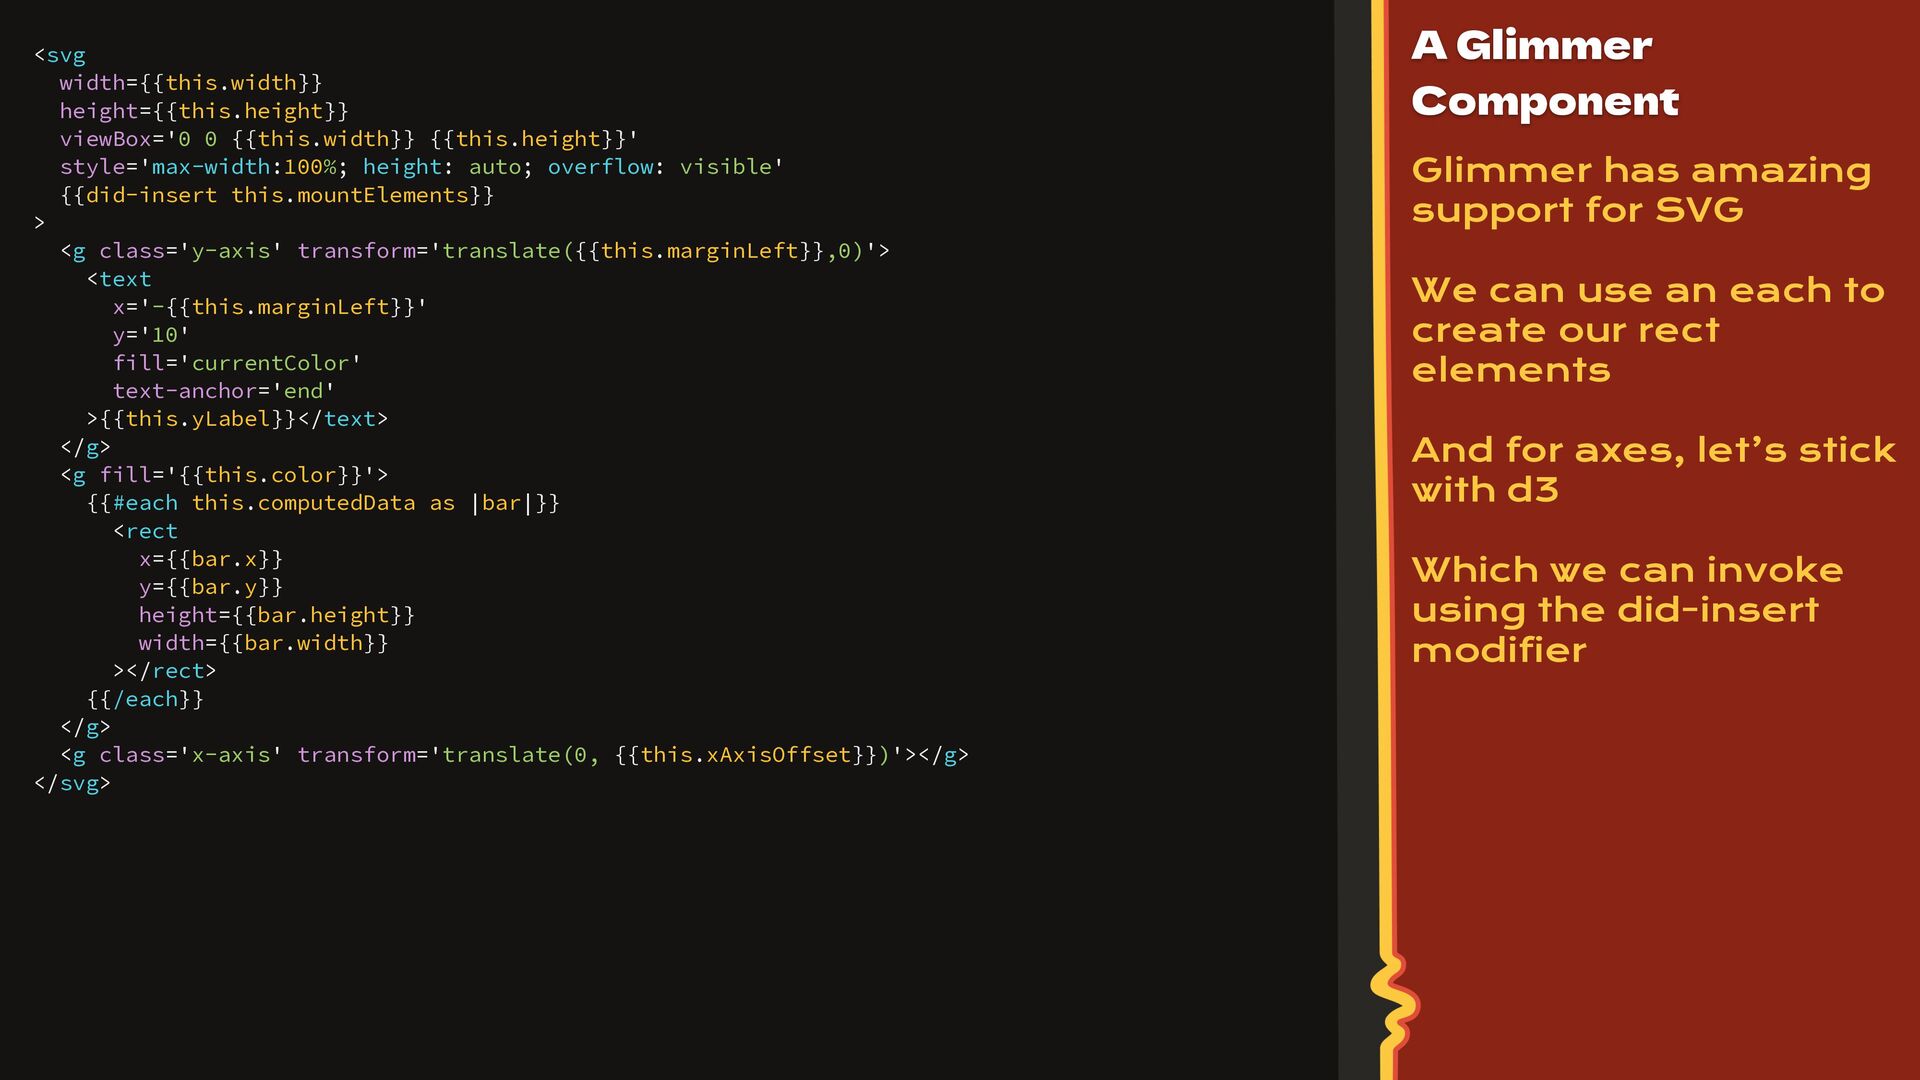
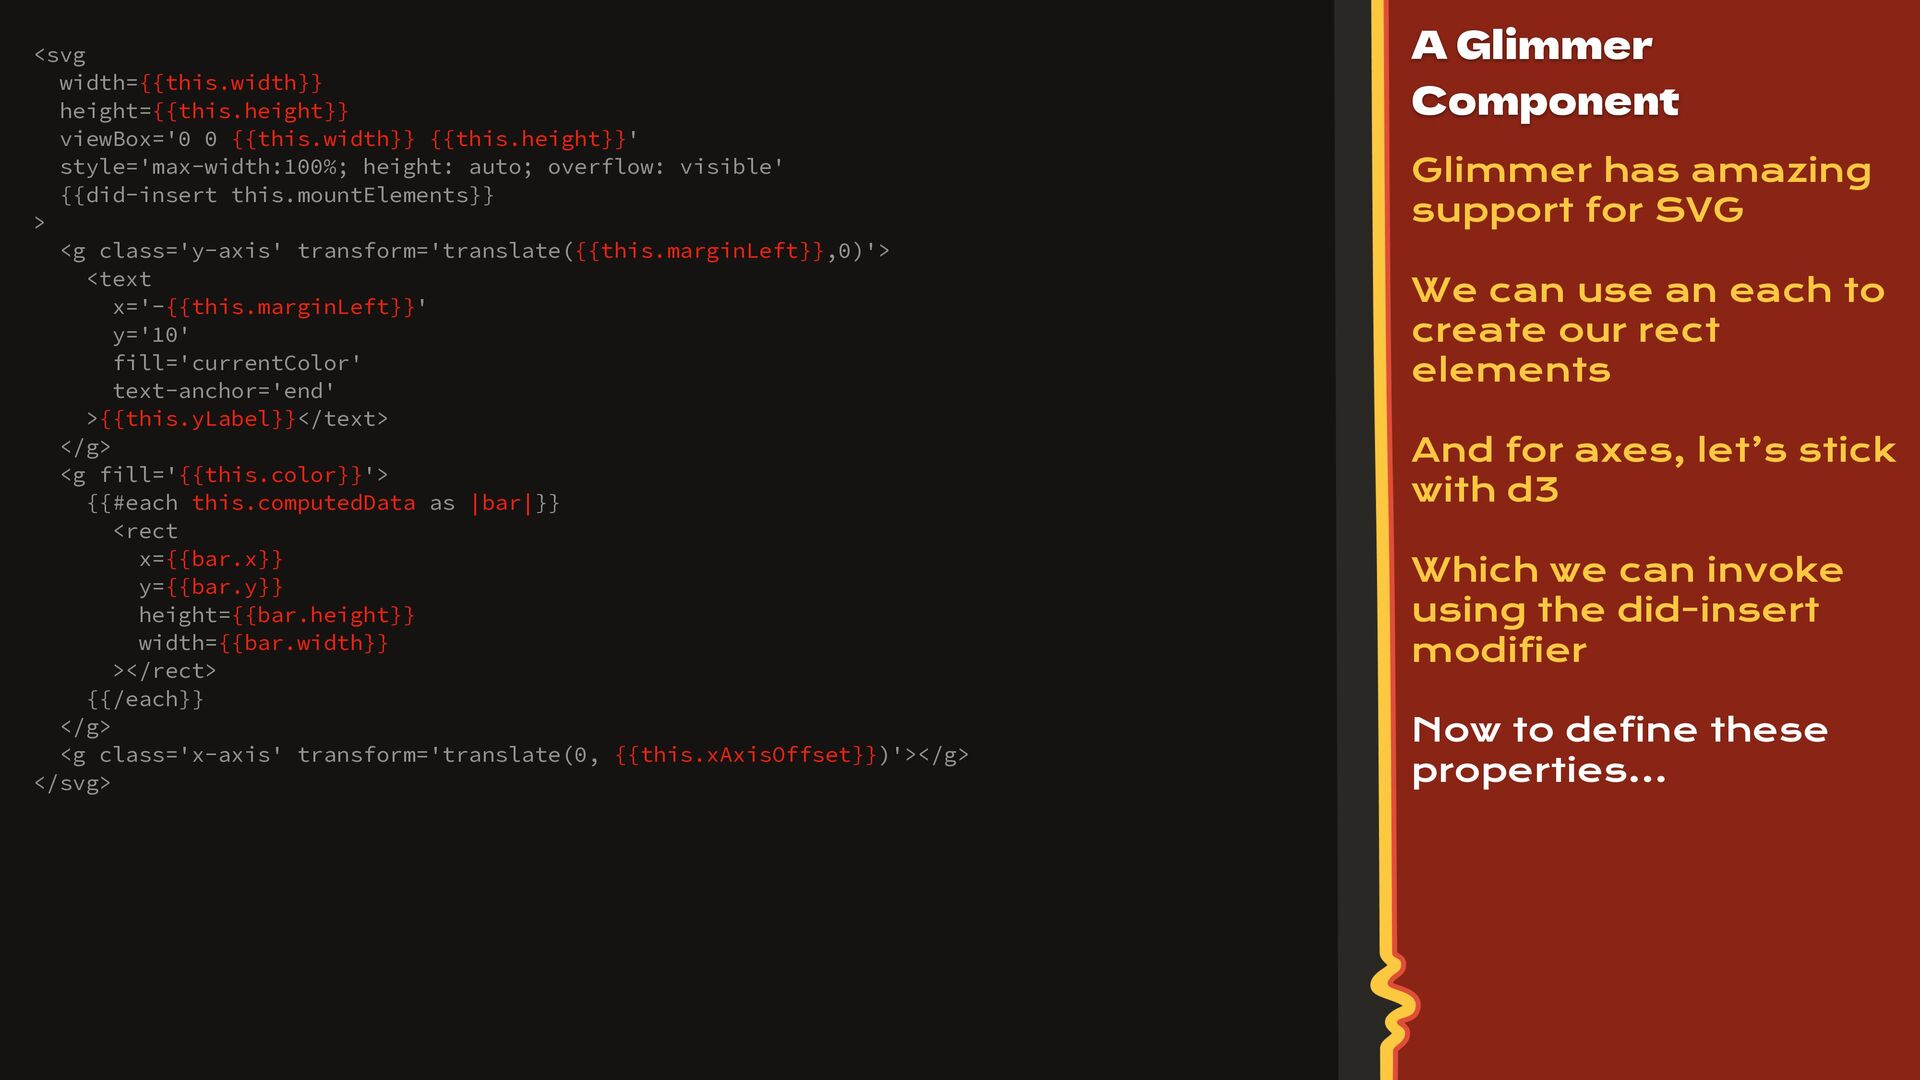
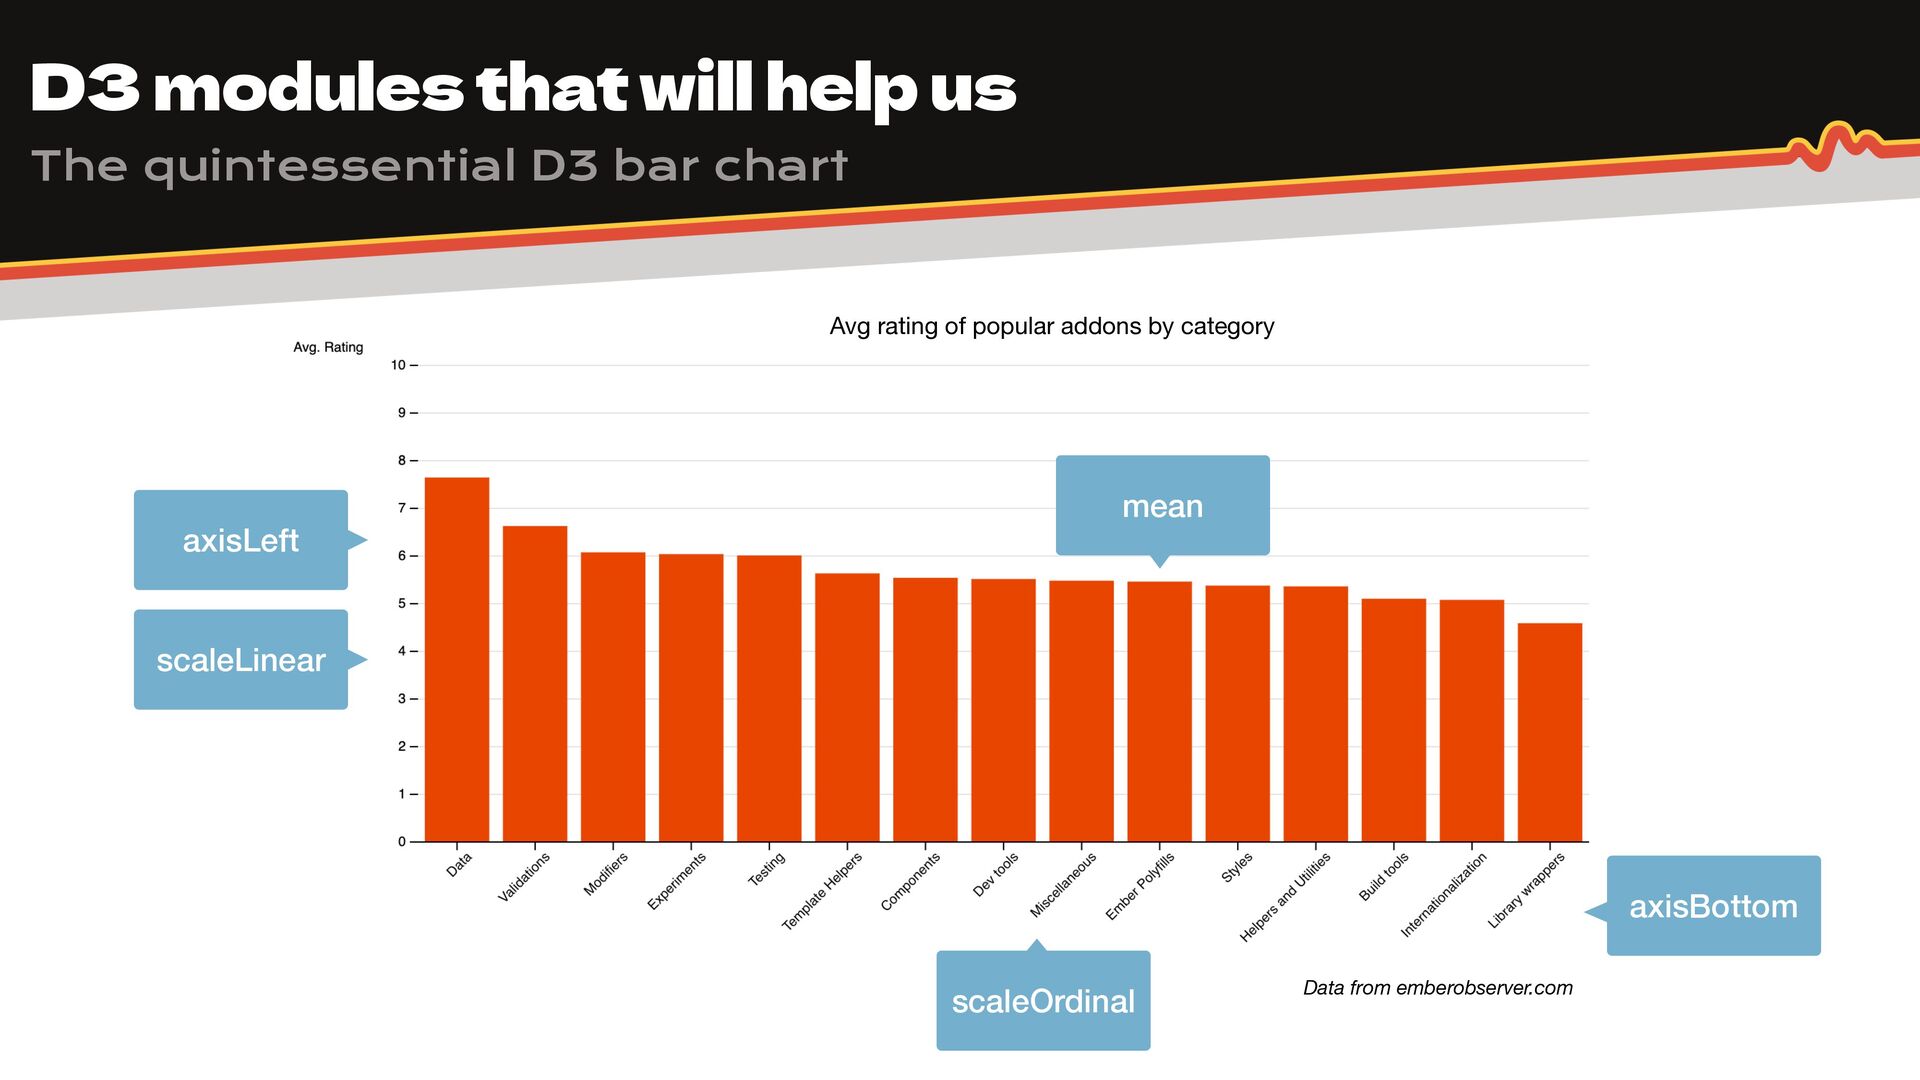
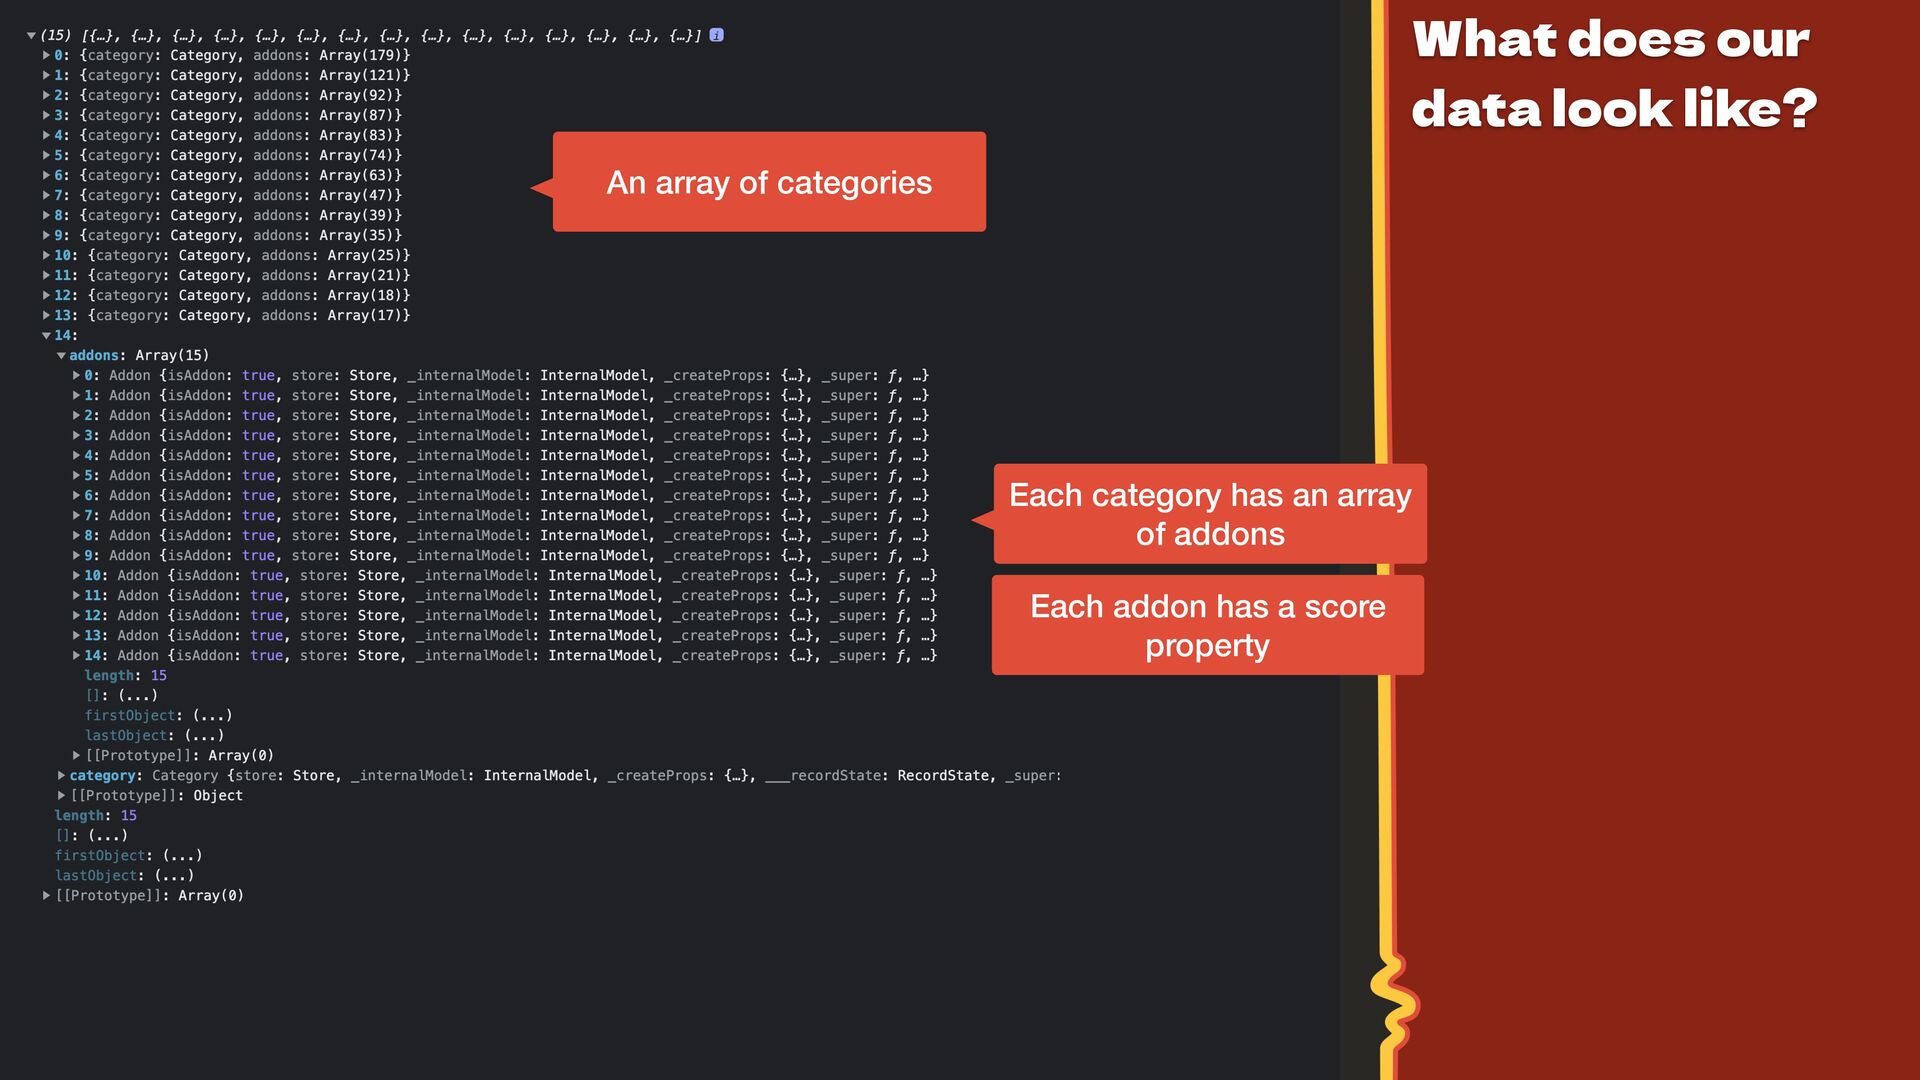
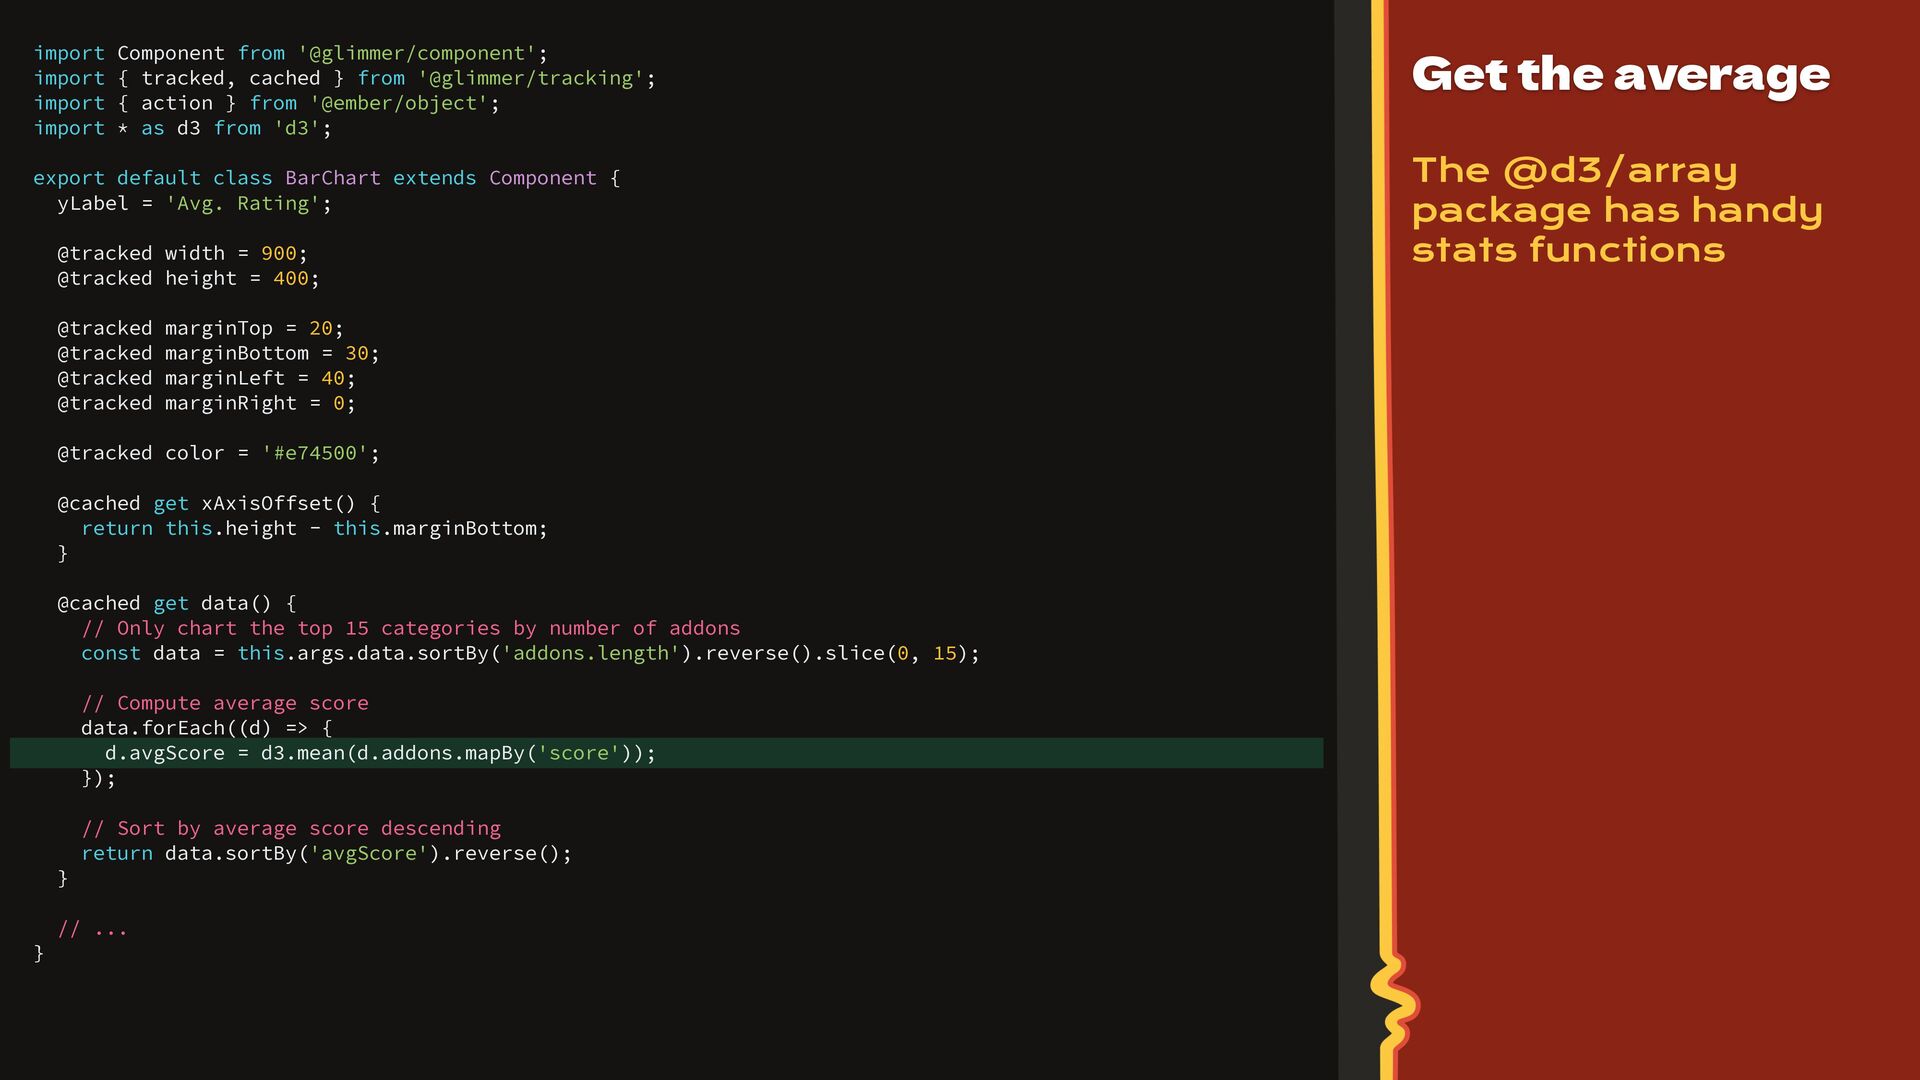
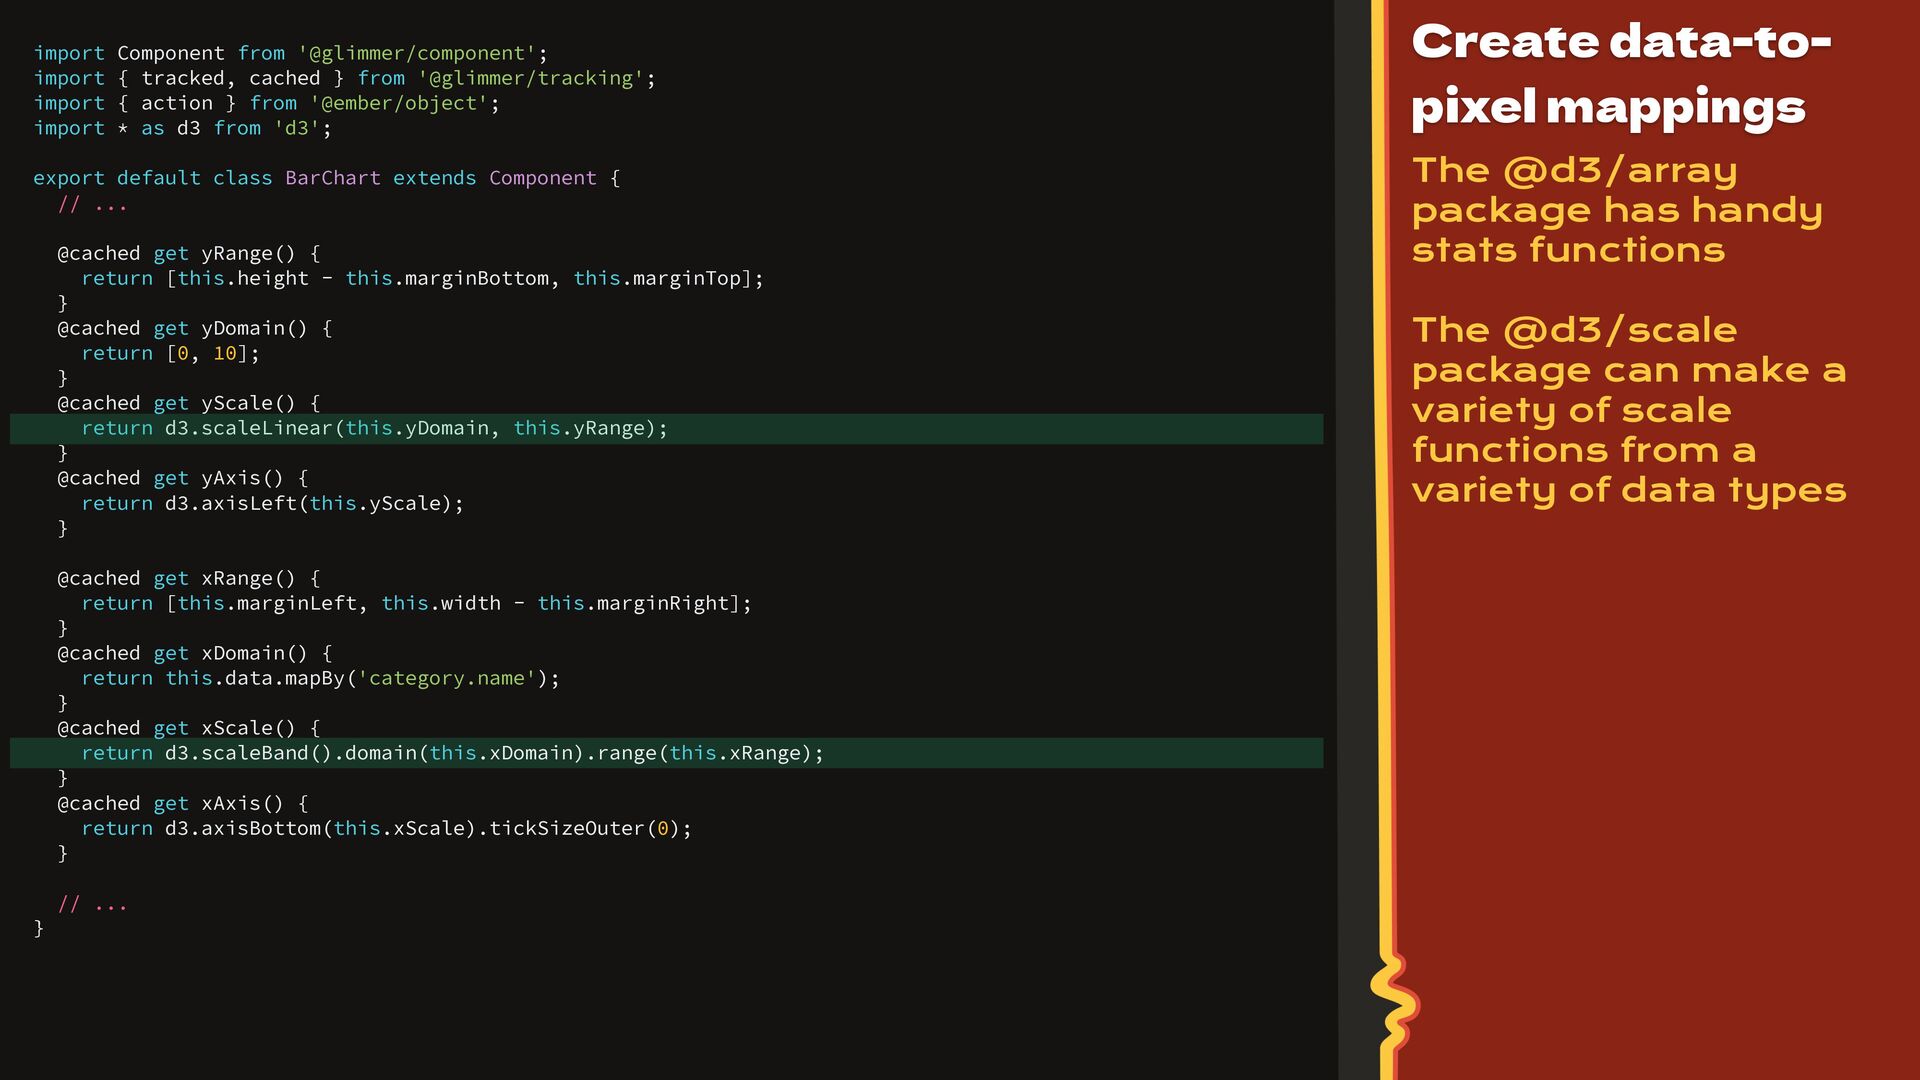
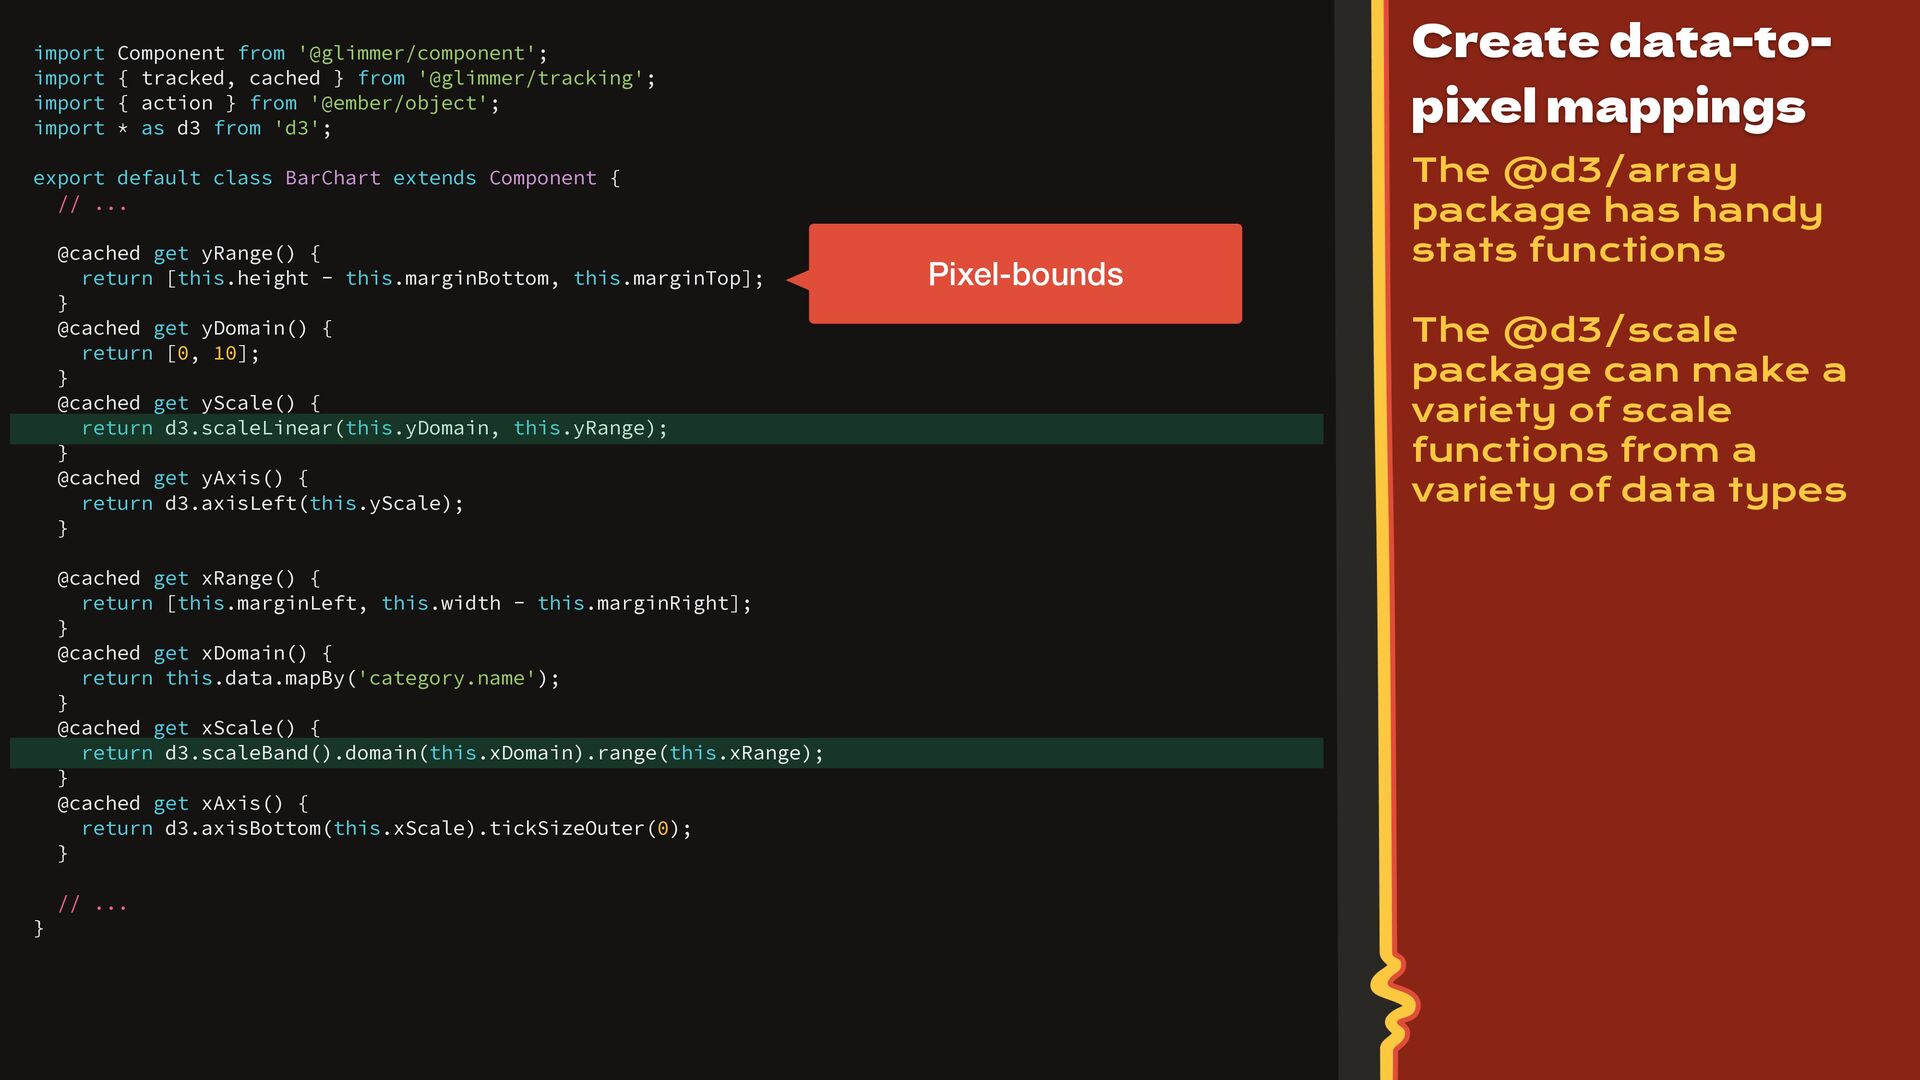
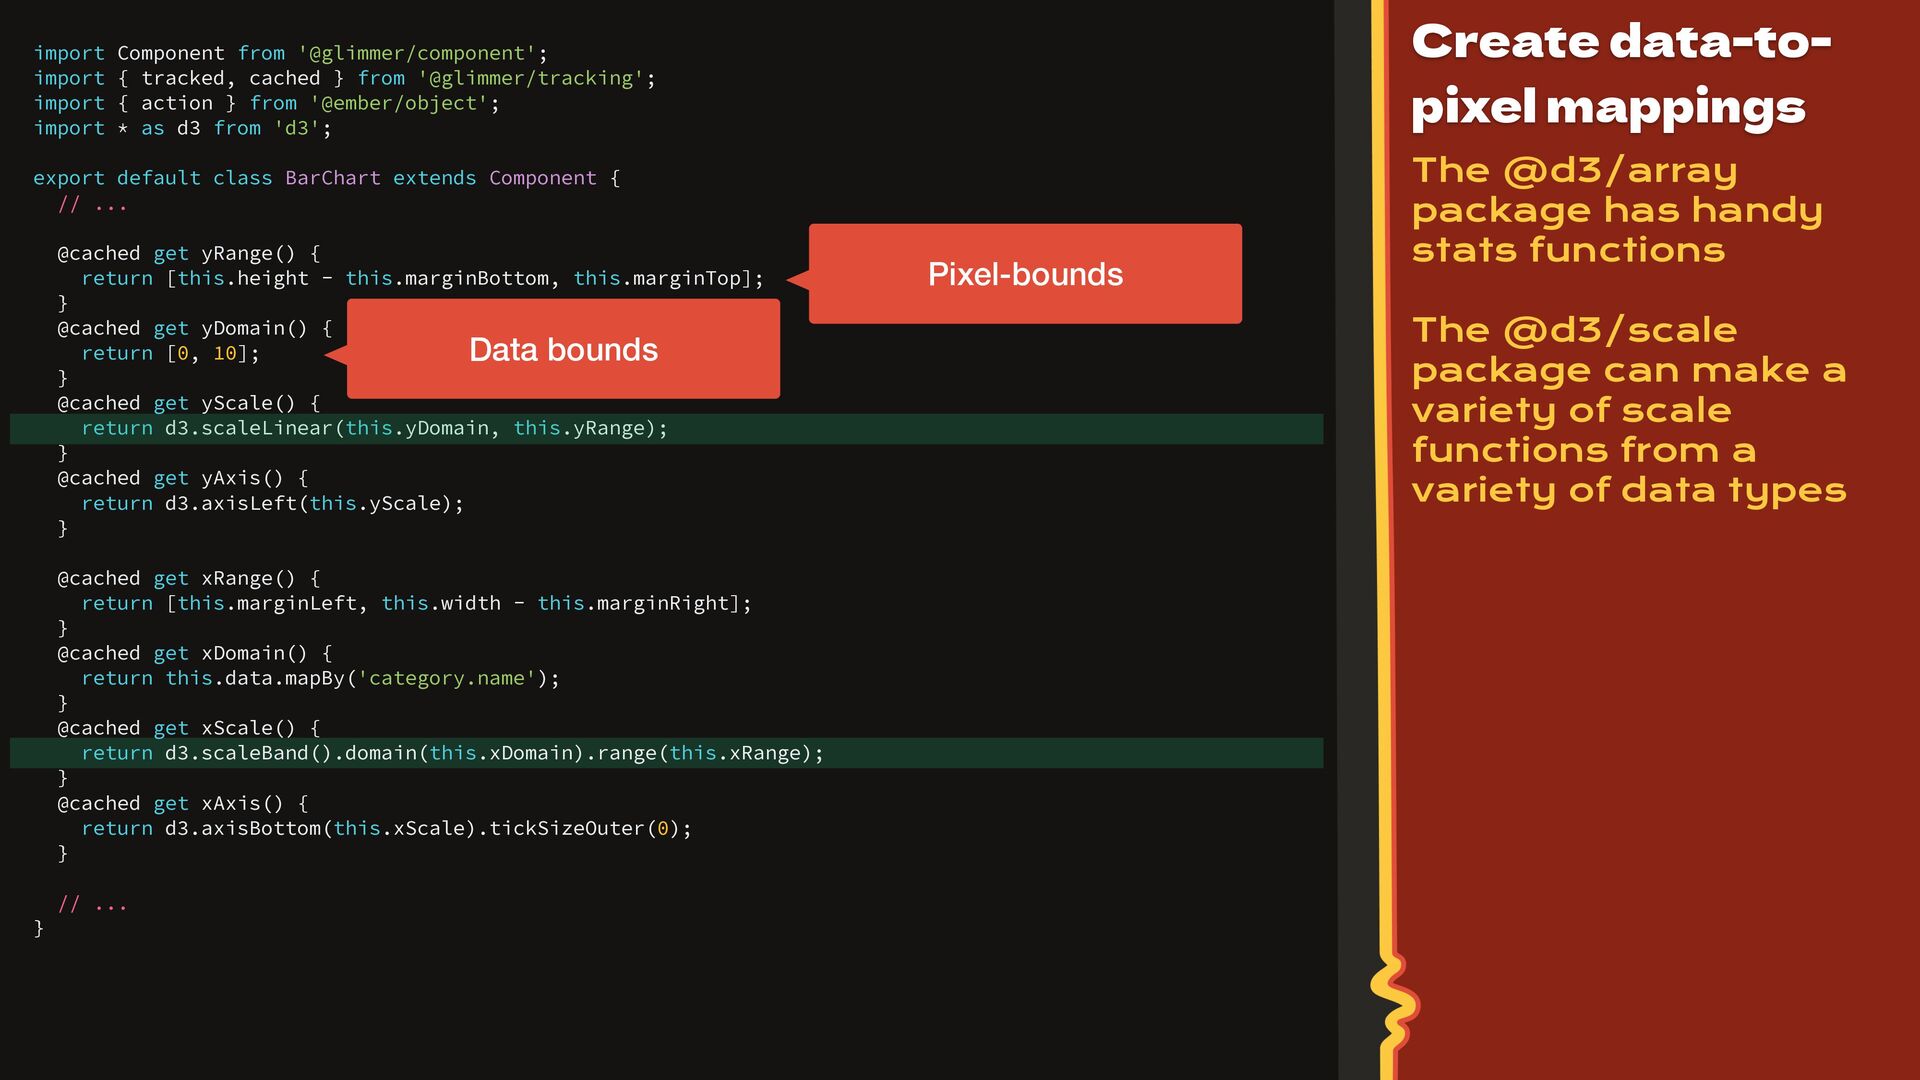
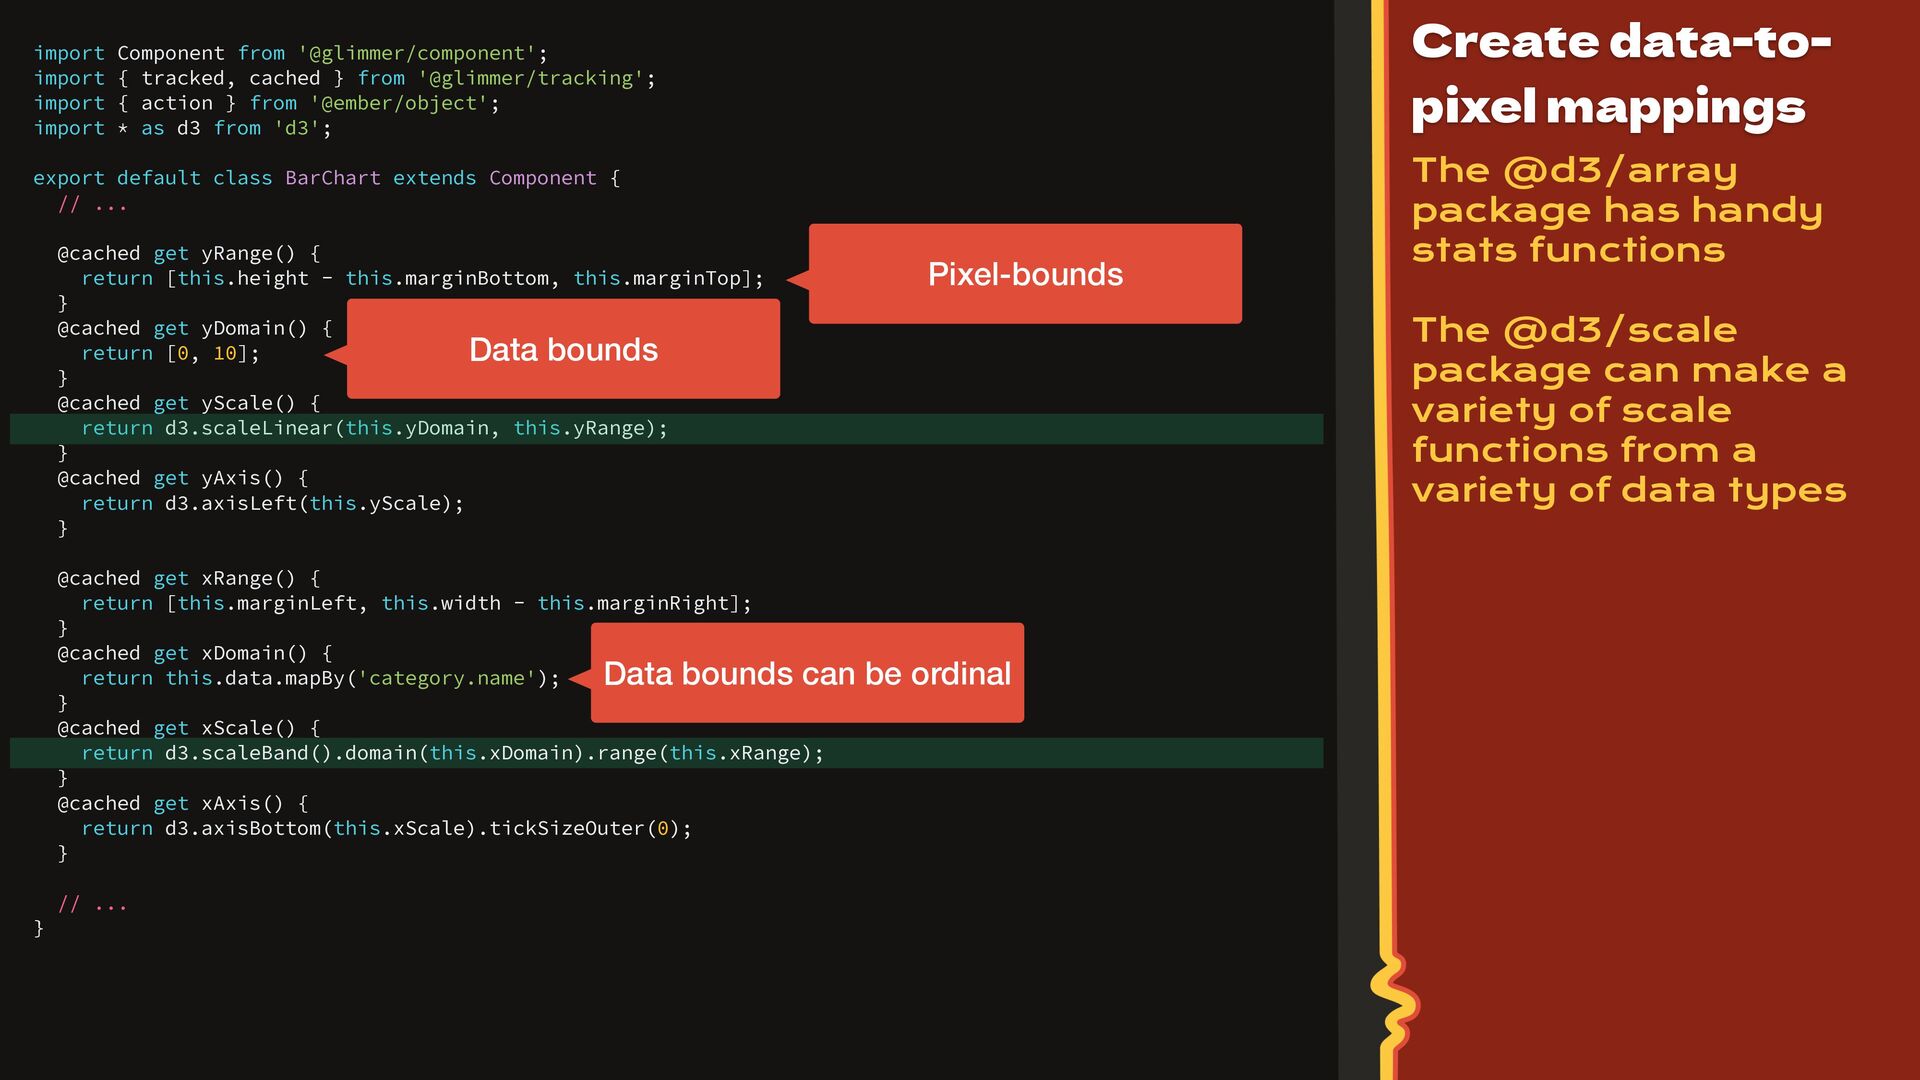
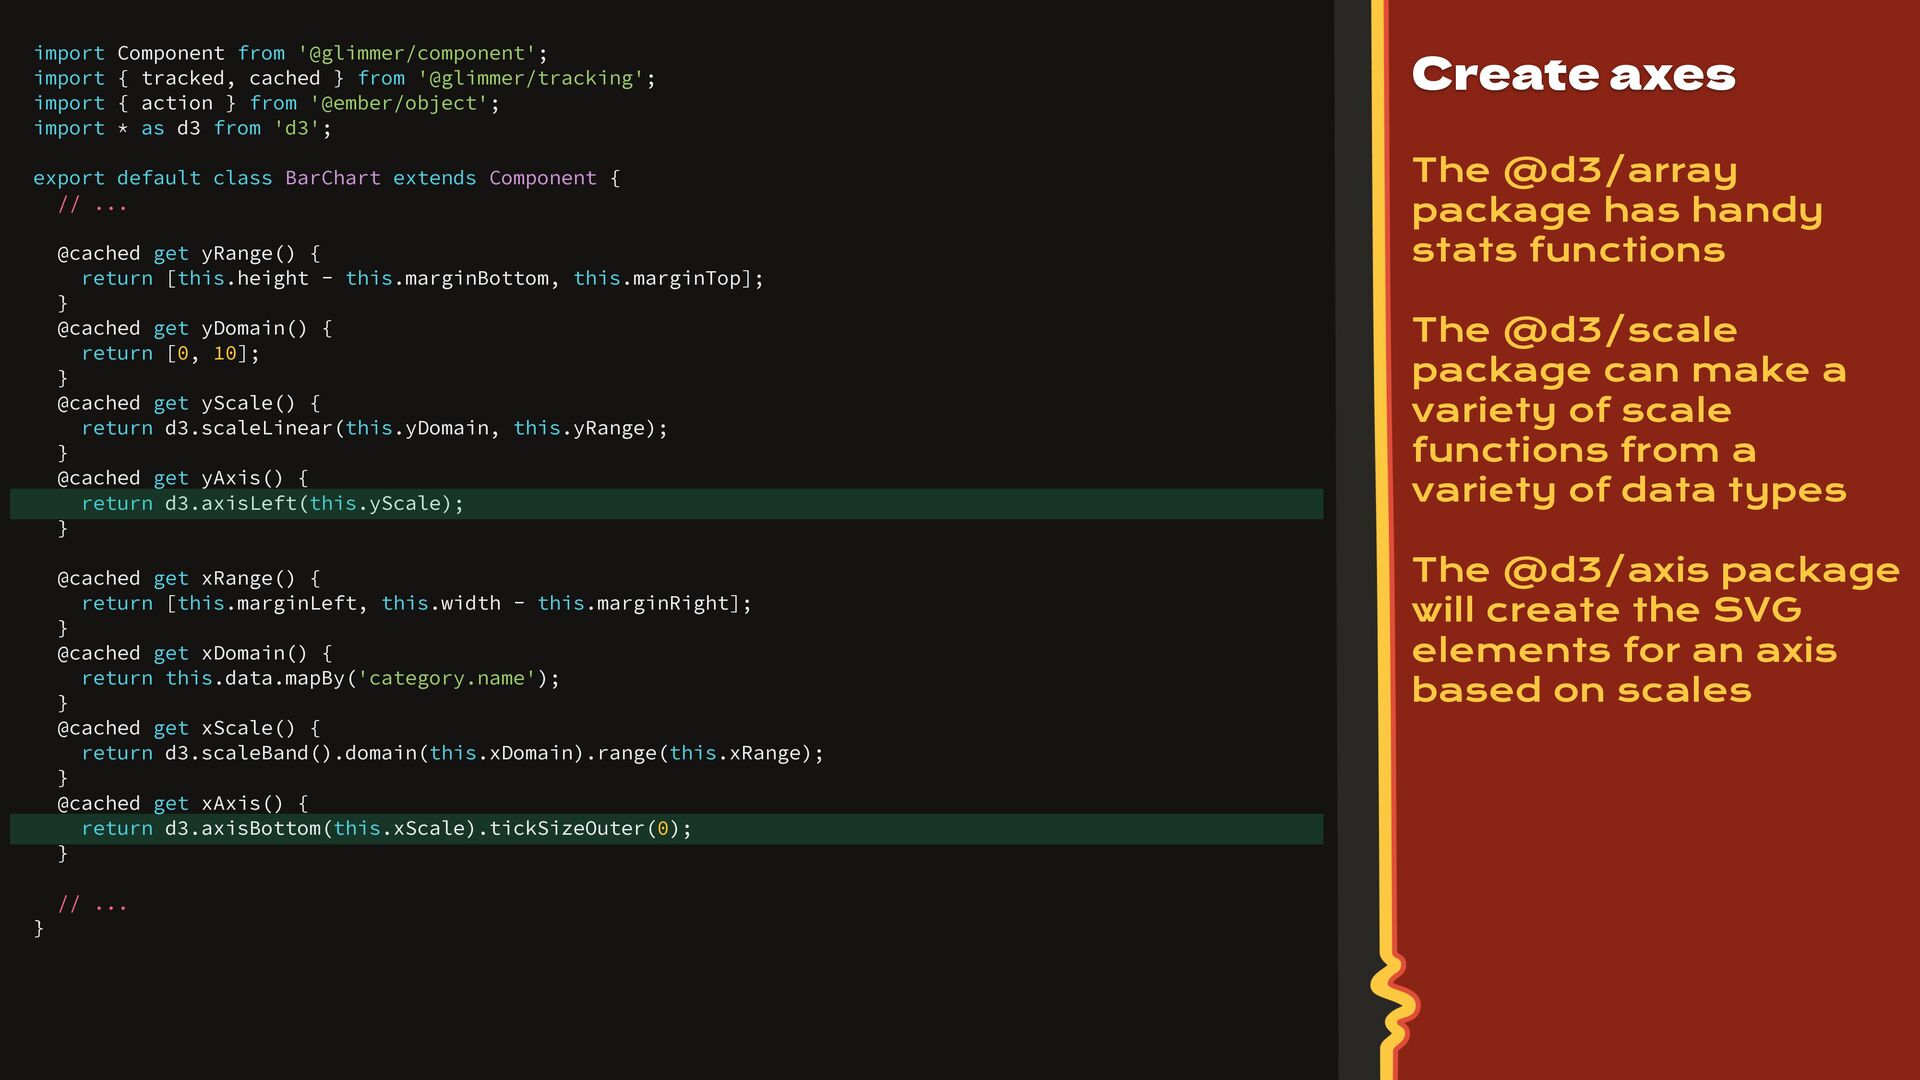
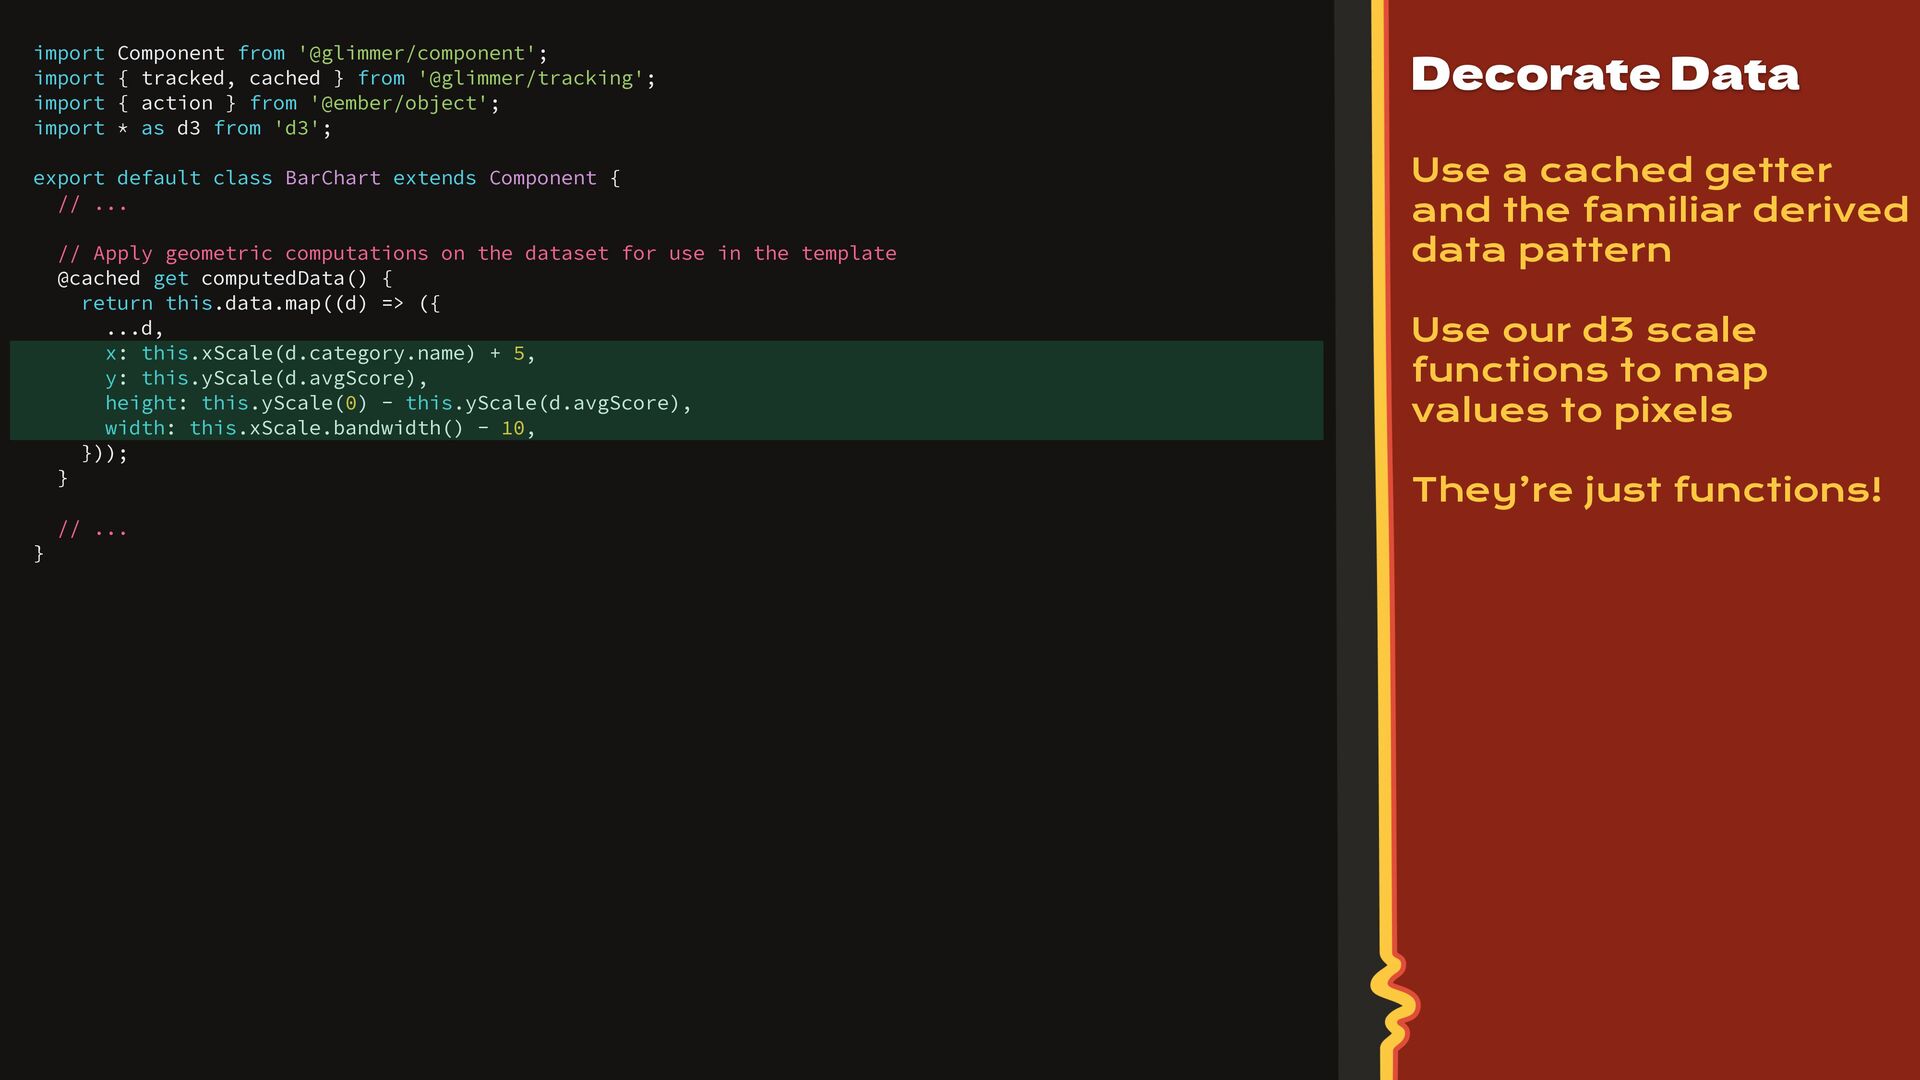
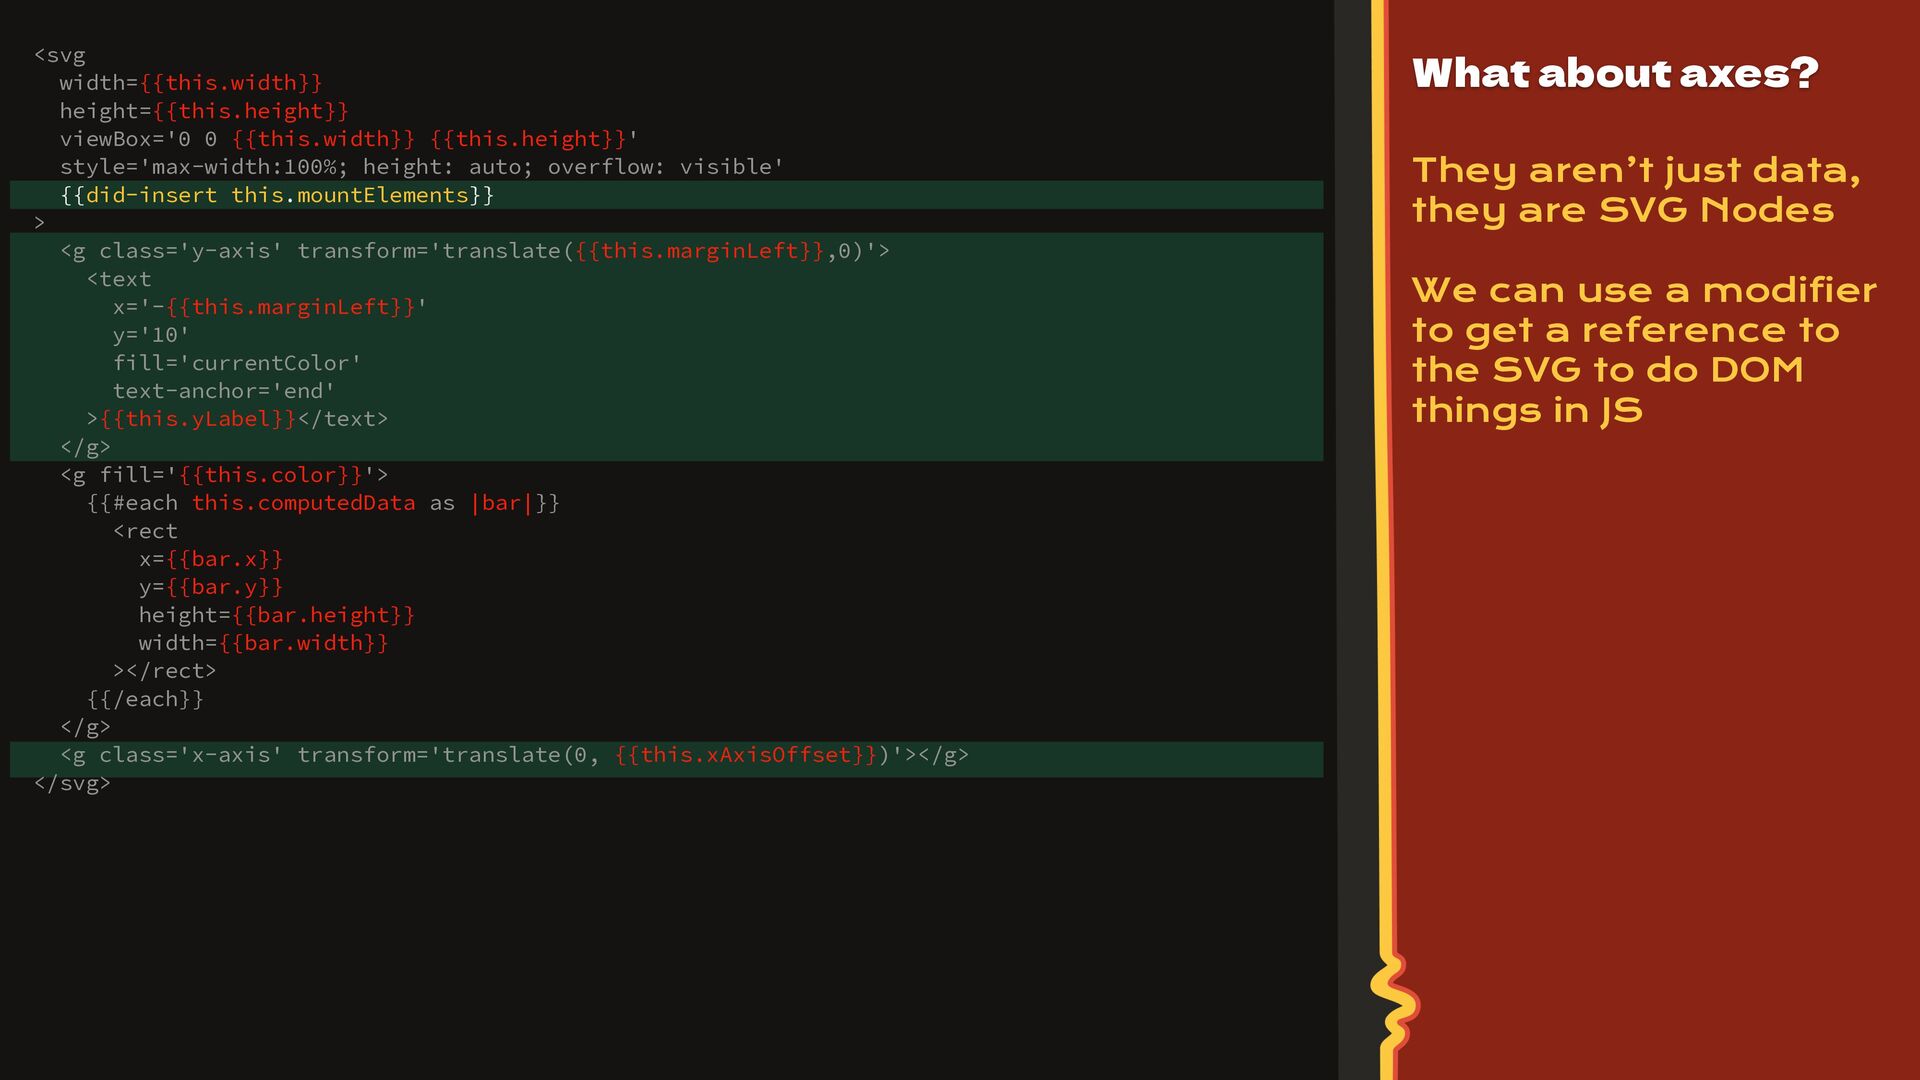
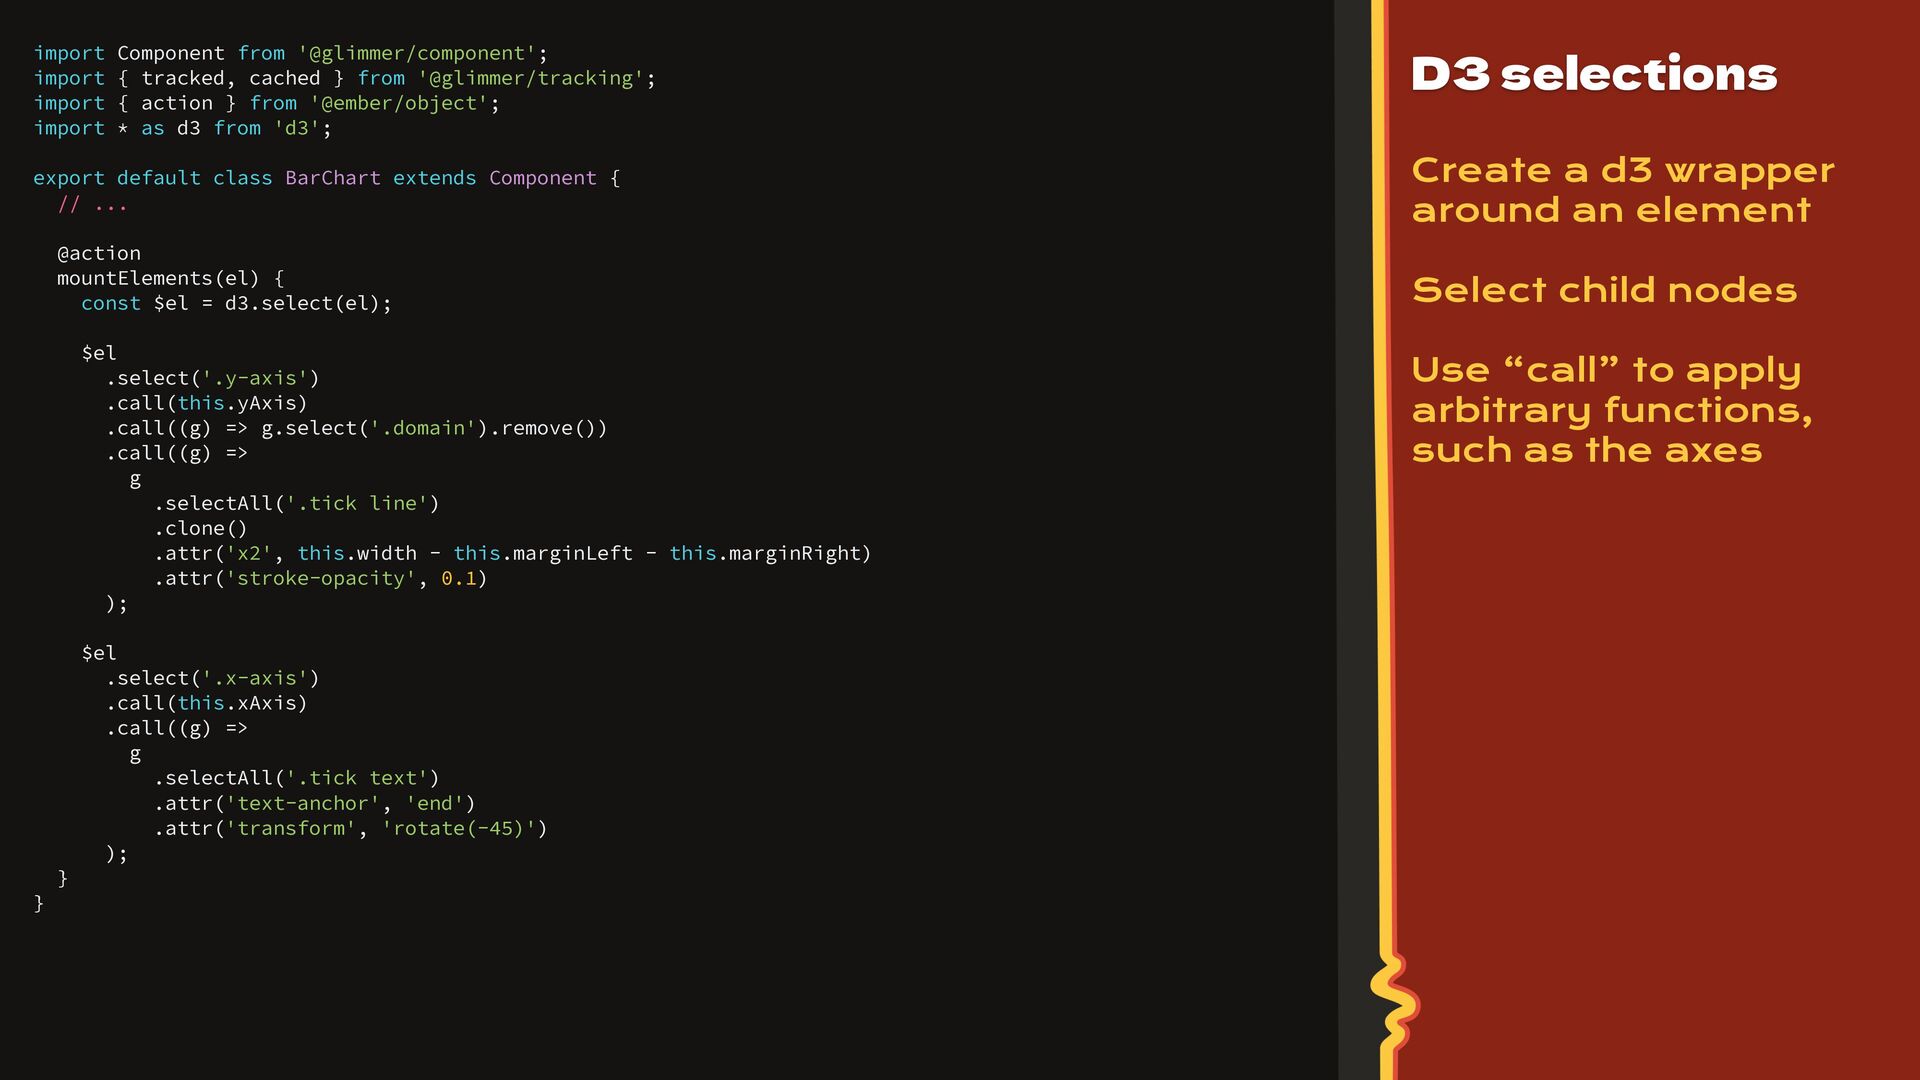
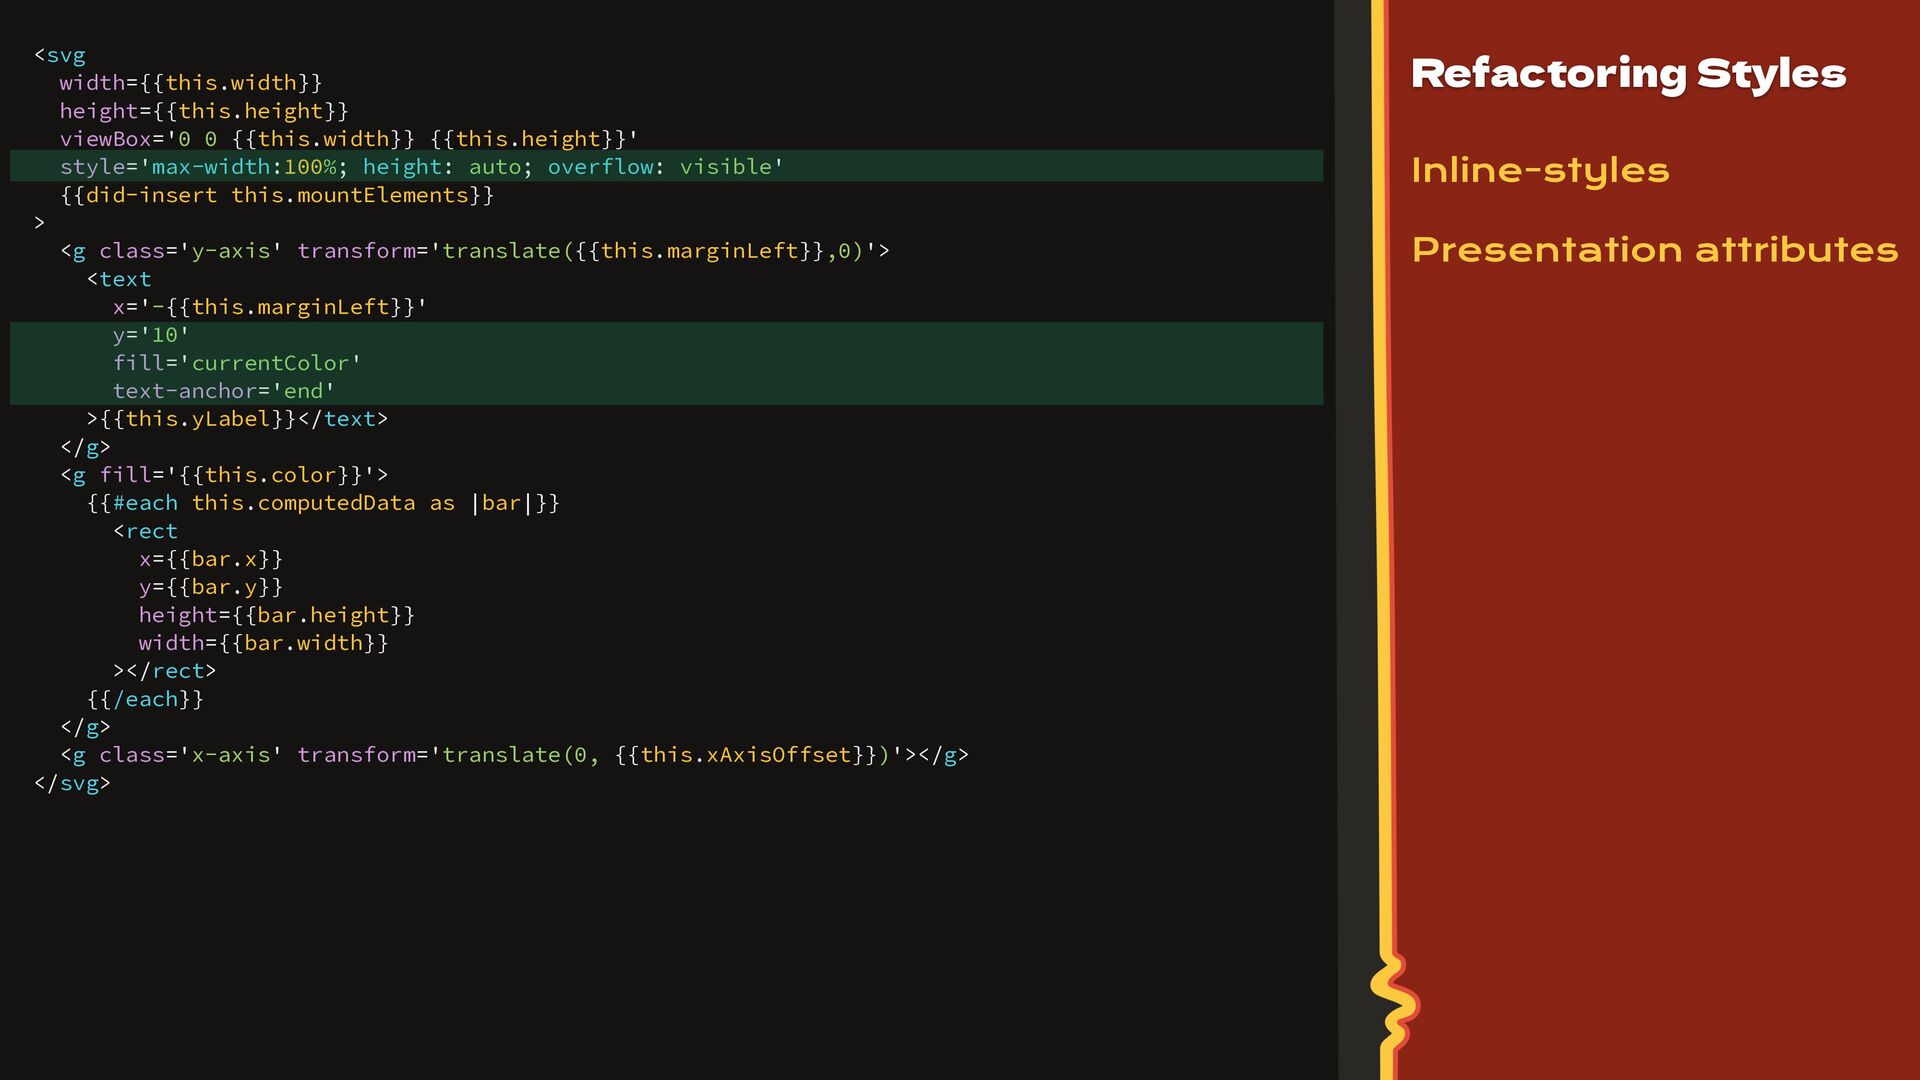
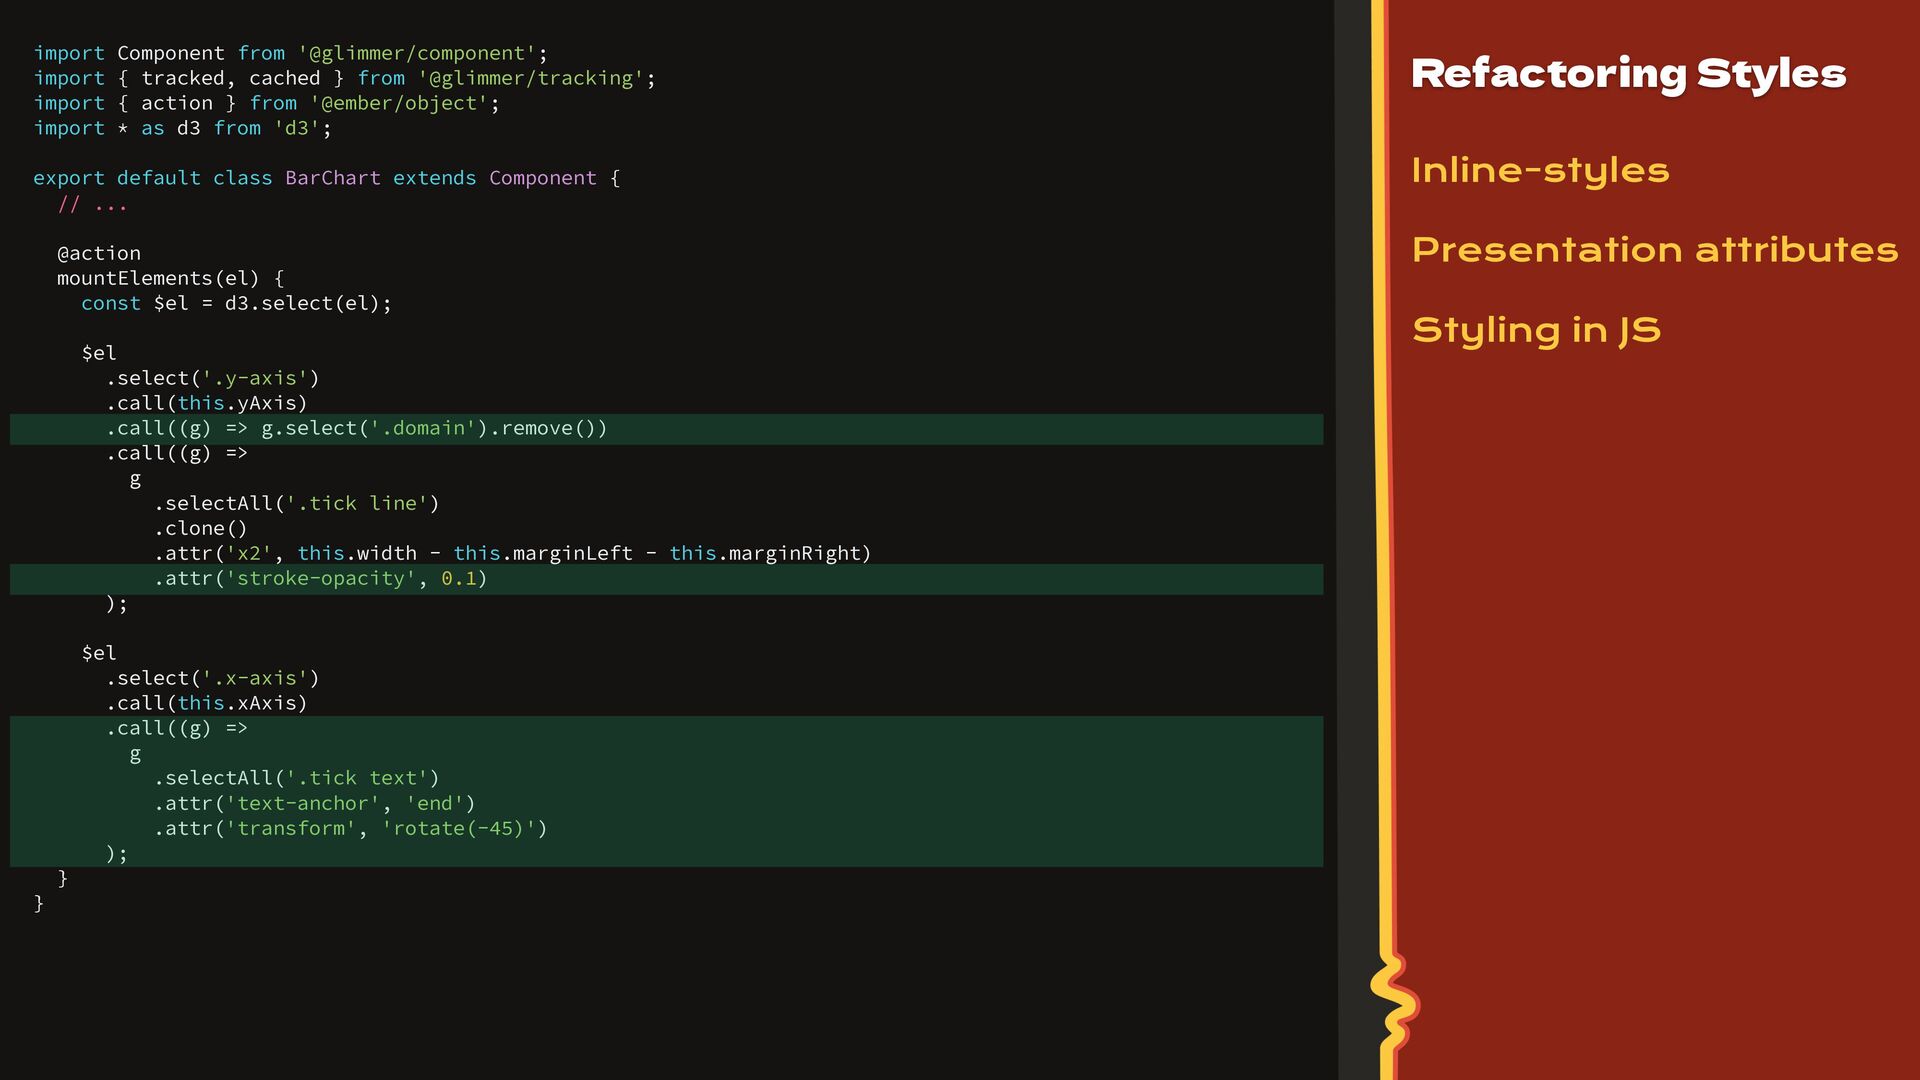
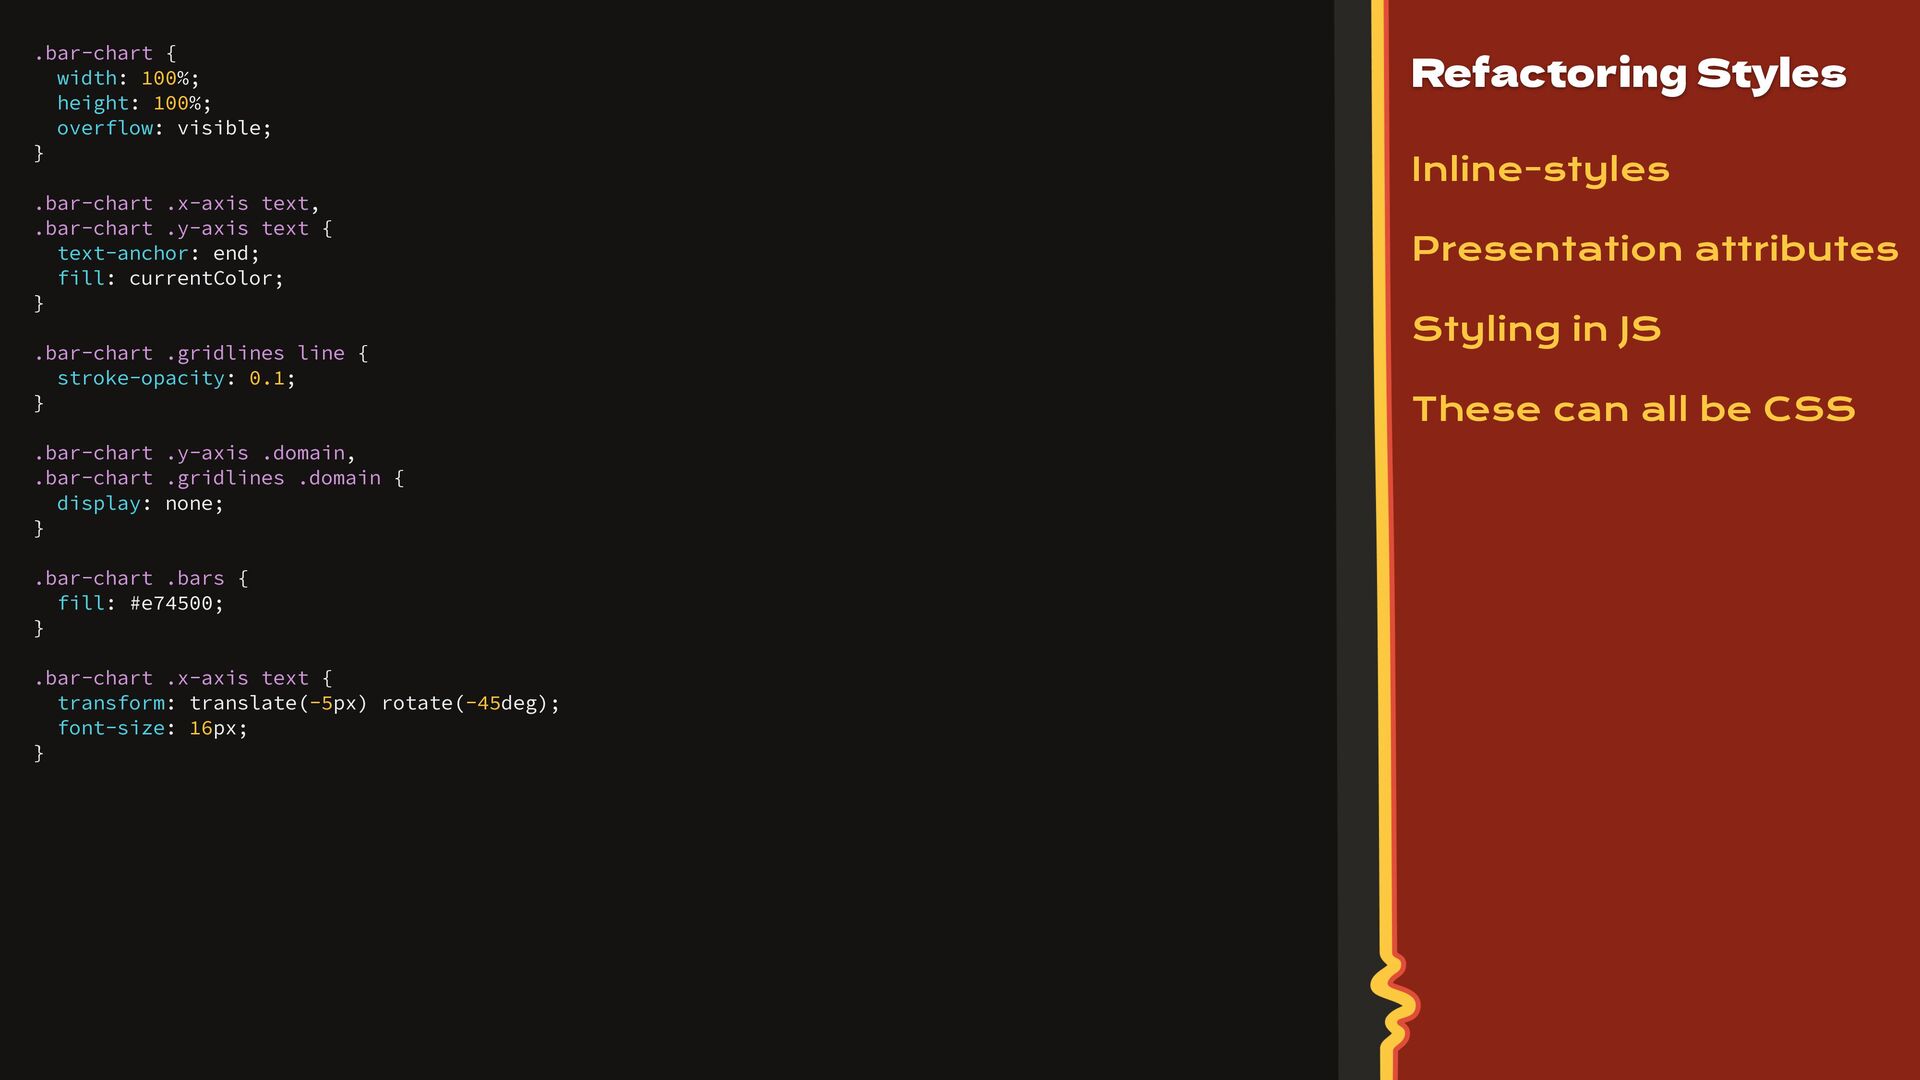
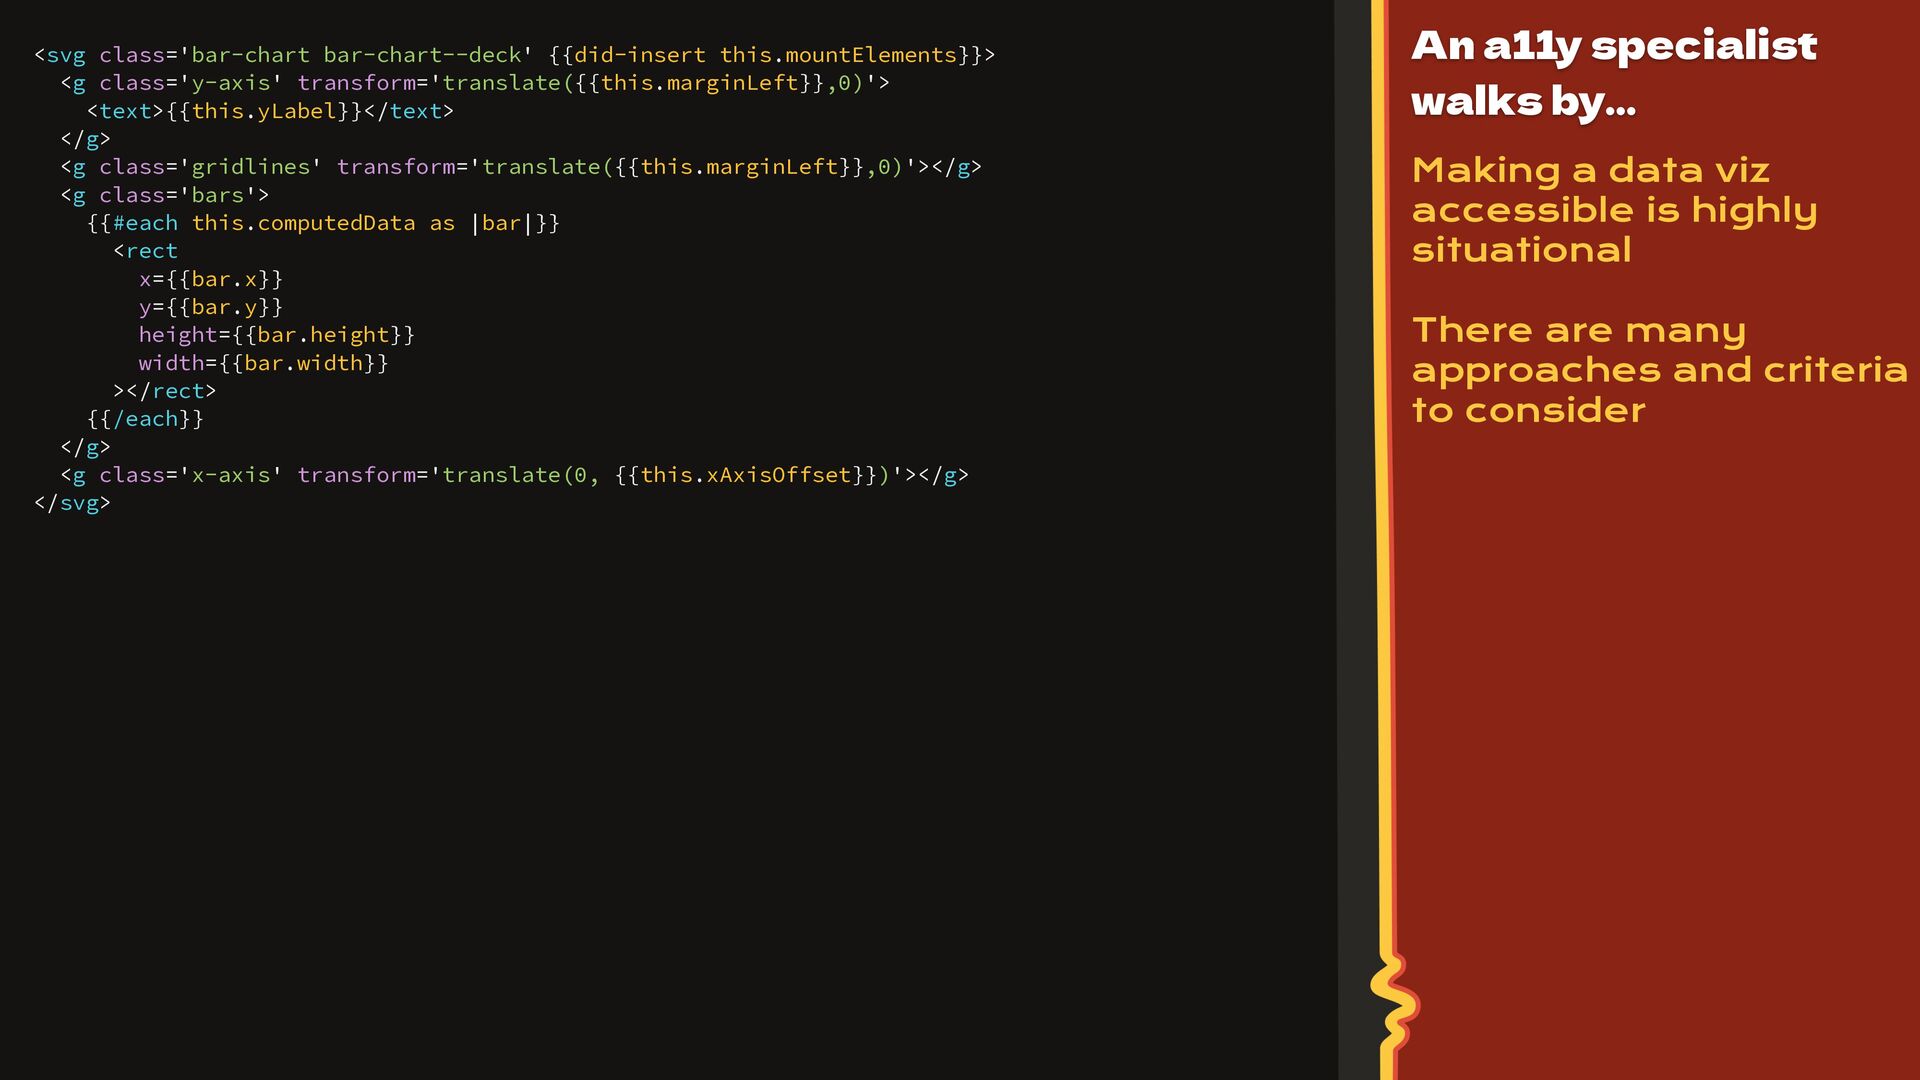
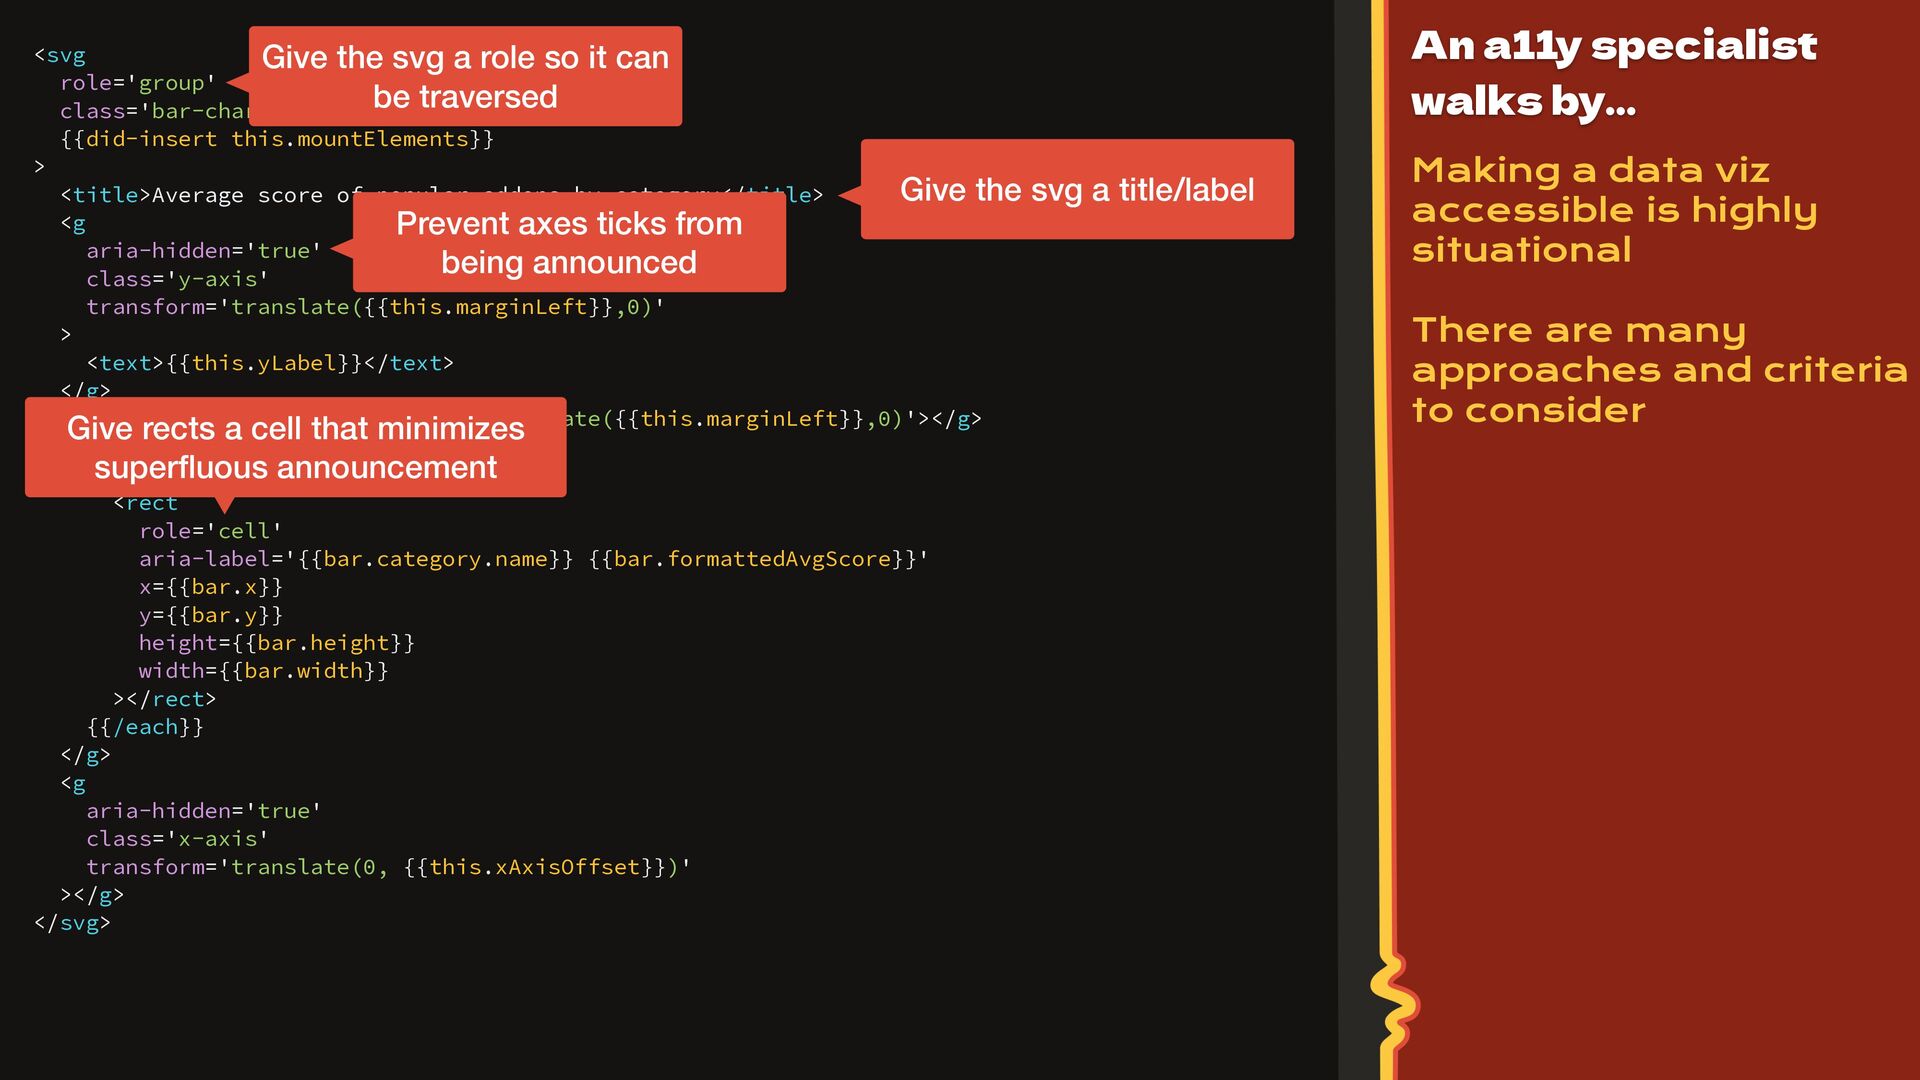
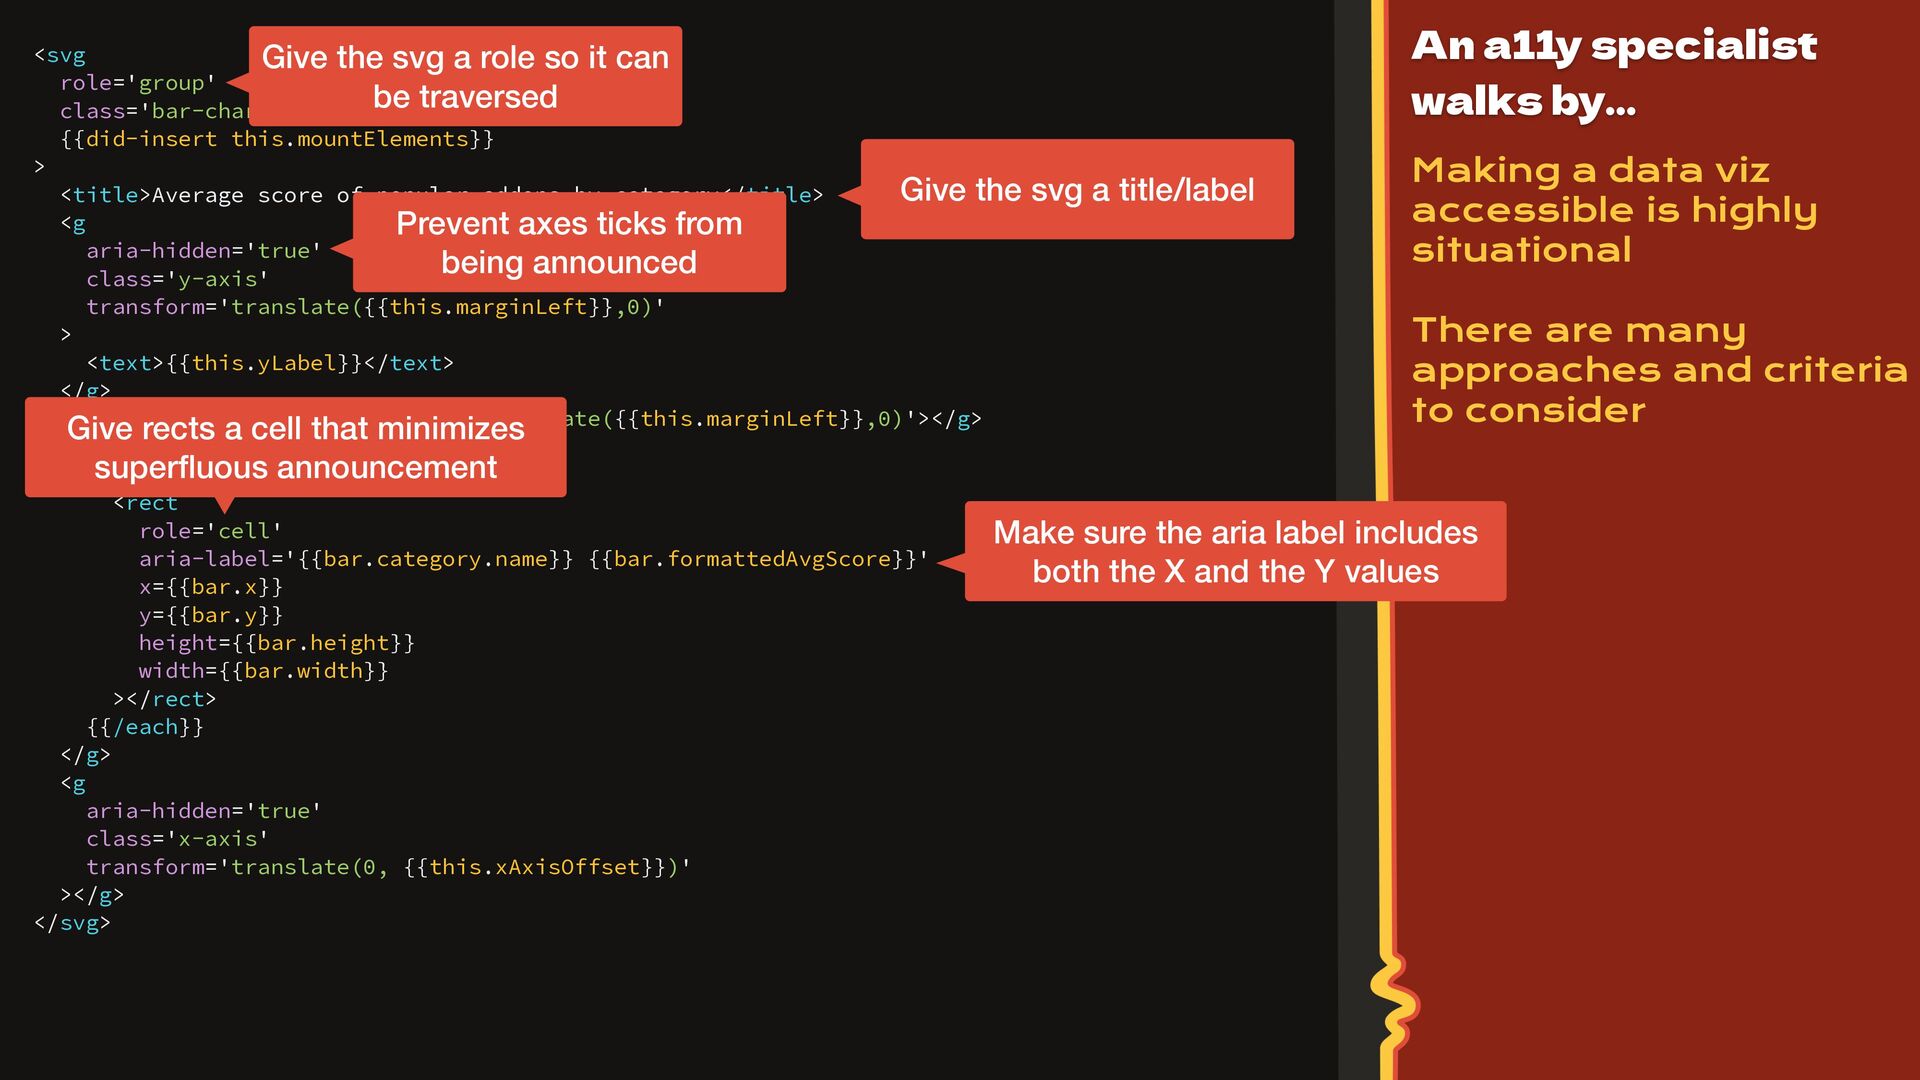
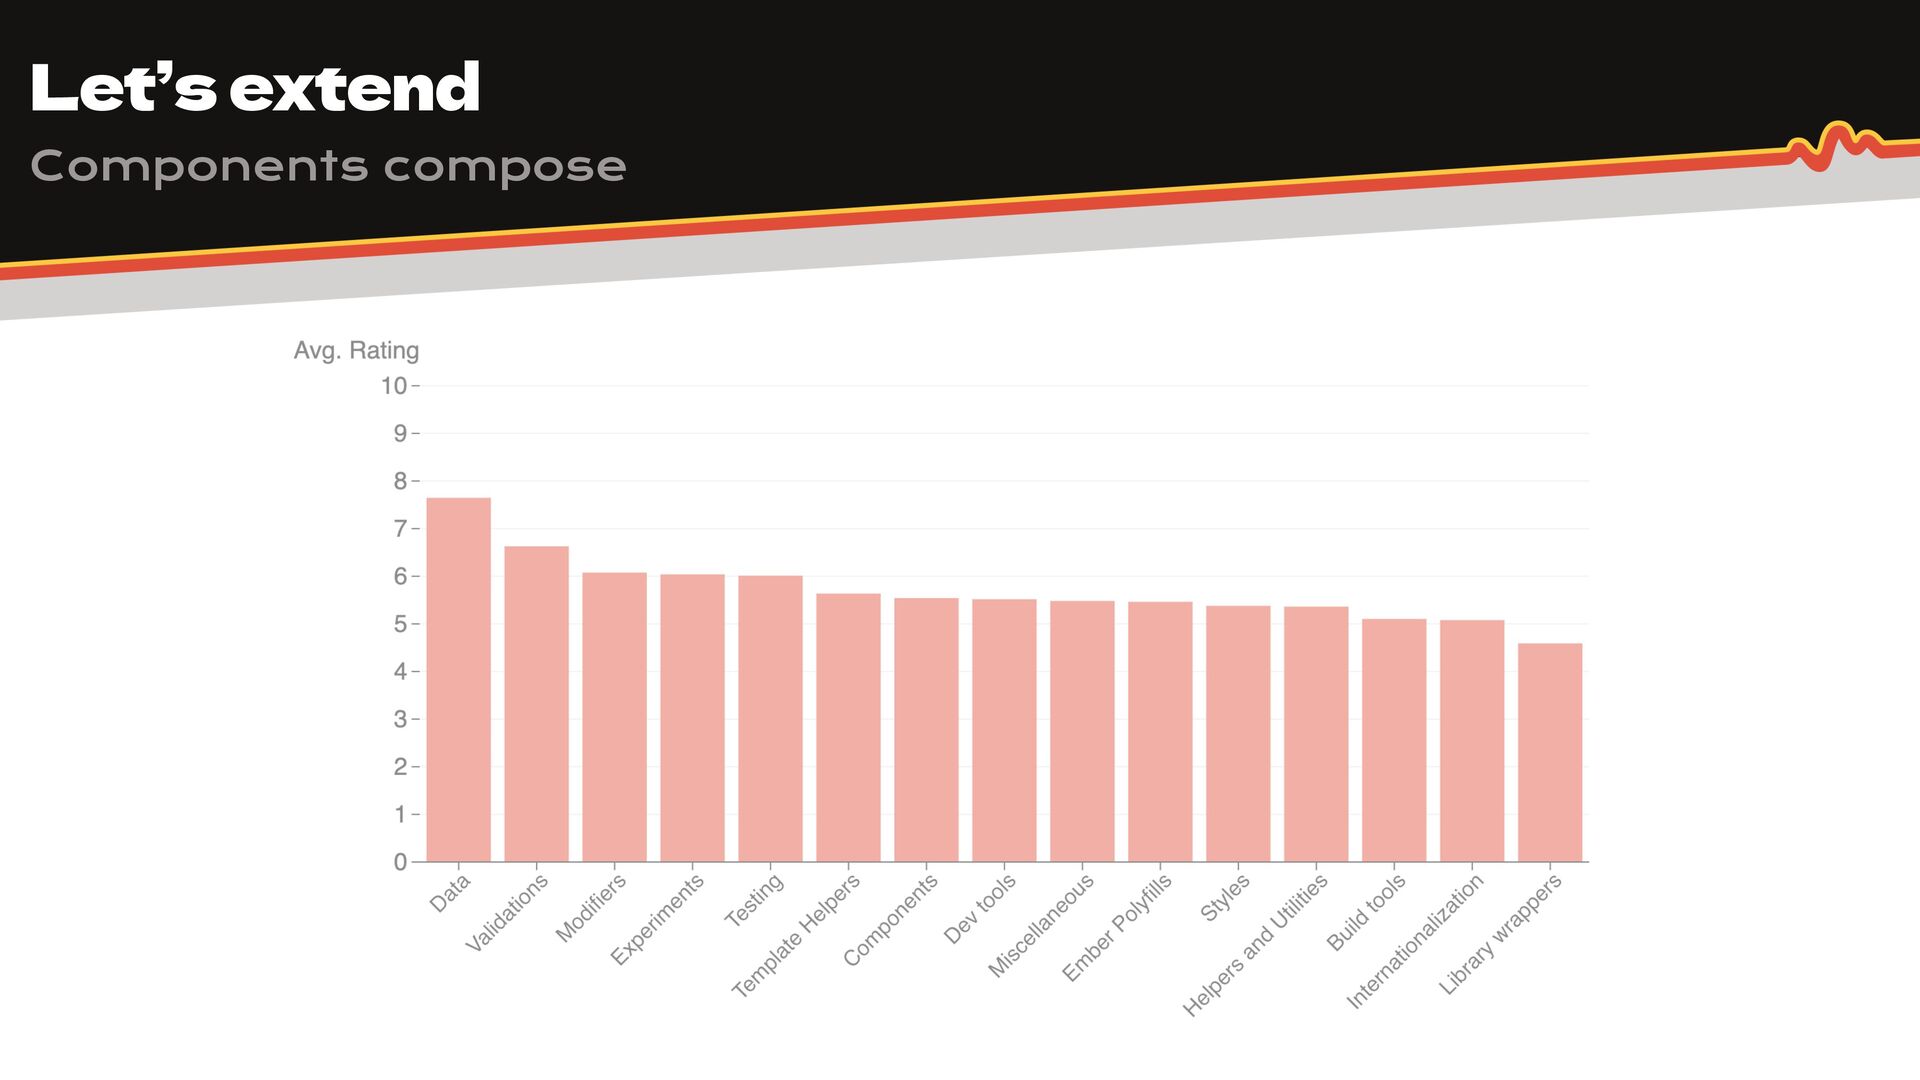
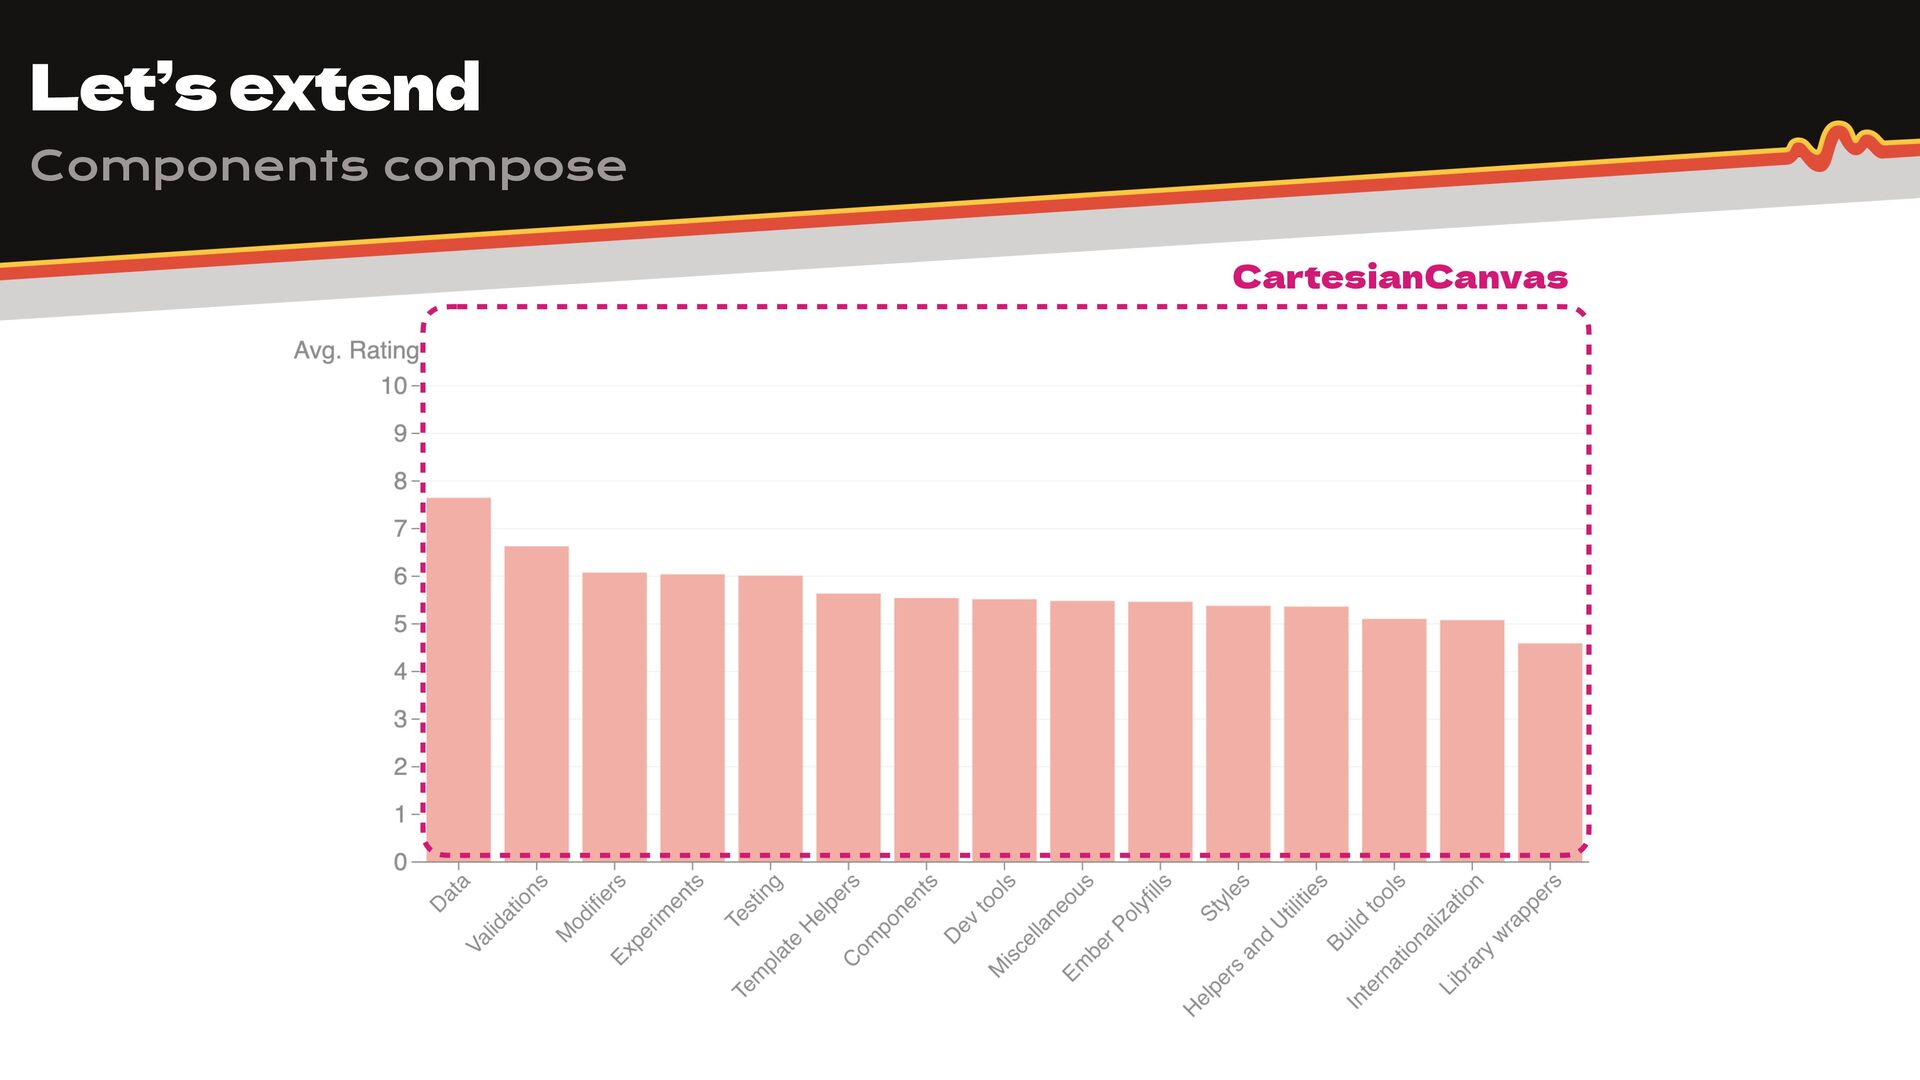
} from '@ember/object'; import * as d3 from 'd3'; export default class D3BarChart extends Component { yLabel = 'Avg. Rating'; @action mount(el) { // Only chart the top 15 categories by number of addons let data = this.args.data.sortBy('addons.length').reverse().slice(0, 15); // Compute average score data.forEach((d) => { d.avgScore = d3.mean(d.addons.mapBy('score')); }); // Sort by average score descending data = data.sortBy('avgScore').reverse(); // Aesthetic measurements const height = 400; const width = 900; const marginTop = 20; const marginBottom = 30; const marginLeft = 40; const marginRight = 0; const color = '#e74500'; // Y-axis derivation const yRange = [height - marginBottom, marginTop]; const yDomain = [0, 10]; const yScale = d3.scaleLinear(yDomain, yRange); const yAxis = d3.axisLeft(yScale); // X-axis derivation const xRange = [marginLeft, width - marginRight]; const xDomain = data.mapBy('category.name'); const xScale = d3.scaleBand().domain(xDomain).range(xRange); const xAxis = d3.axisBottom(xScale).tickSizeOuter(0); // Hydrate svg element & decorate const svg = d3 .select(el) .attr('width', width) .attr('height', height) .attr('viewBox', [0, 0, width, height]) .attr('style', 'max-width:100%; height: auto; overflow: visible'); // Add the y-axis svg .append('g') .attr('transform', `translate(${marginLeft},0)`) .call(yAxis) .call((g) => g.select('.domain').remove()) .call((g) => g .selectAll('.tick line') .clone() .attr('x2', width - marginLeft - marginRight) .attr('stroke-opacity', 0.1) ) .call((g) => g .append('text') .attr('x', -marginLeft) .attr('y', 10) .attr('fill', 'currentColor') .attr('text-anchor', 'end') .text(this.yLabel) ); // Add bars svg .append('g') .attr('fill', color) .selectAll('rect') .data(data) .join('rect') .attr('x', (d) => xScale(d.category.name) + 5) .attr('y', (d) => yScale(d.avgScore)) .attr('height', (d) => yScale(0) - yScale(d.avgScore)) .attr('width', xScale.bandwidth() - 10); // Add the x-axis svg .append('g') .attr('transform', `translate(0,${height - marginBottom})`) .call(xAxis) .call((g) => g .selectAll('.tick text') .attr('text-anchor', 'end') .attr('transform', 'rotate(-45)') ); } } <svg class='bar-chart bar-chart--deck' {{did-insert this.mountElements}}> <g class='y-axis' transform='translate({{this.marginLeft}},0)'> <text>{{this.yLabel}}</text> </g> <g class='gridlines' transform='translate({{this.marginLeft}},0)'></g> <g class='bars'> {{#each this.computedData as |bar|}} <rect x={{bar.x}} y={{bar.y}} height={{bar.height}} width={{bar.width}} ></rect> {{/each}} </g> <g class='x-axis' transform='translate(0, {{this.xAxisOffset}})'></g> </svg> import Component from '@glimmer/component'; import { tracked, cached } from '@glimmer/tracking'; import { action } from '@ember/object'; import * as d3 from 'd3'; export default class BarChartCSS extends Component { yLabel = 'Avg. Rating'; @tracked height = 1; @tracked width = 1; @tracked marginTop = 20; @tracked marginBottom = 30; @tracked marginLeft = 40; @tracked marginRight = 0; @cached get xAxisOffset() { return Math.max(0, this.height - this.marginBottom); } @cached get data() { // Only chart the top 15 categories by number of addons const data = this.args.data.sortBy('addons.length').reverse().slice(0, 15); // Compute average score data.forEach((d) => { d.avgScore = d3.mean(d.addons.mapBy(‘score')); }); // Sort by average score descending return data.sortBy('avgScore').reverse(); } @cached get yRange() { return [this.height - this.marginBottom, this.marginTop]; } @cached get yDomain() { return [0, 10]; } @cached get yScale() { return d3.scaleLinear(this.yDomain, this.yRange);} @cached get yAxis() { return d3.axisLeft(this.yScale); } @cached get yGridlines() { return d3 .axisLeft(this.yScale) .tickSize(-this.width + this.marginLeft + this.marginRight) .tickFormat(''); } @cached get xRange() { return [this.marginLeft, this.width - this.marginRight]; } @cached get xDomain() { return this.data.mapBy(‘category.name'); } @cached get xScale() { return d3.scaleBand().domain(this.xDomain).range(this.xRange); } @cached get xAxis() { return d3.axisBottom(this.xScale).tickSizeOuter(0); } // Apply geometric computations on the dataset for use in the template @cached get computedData() { return this.data.map((d) => ({ ...d, x: this.xScale(d.category.name) + 5, y: this.yScale(d.avgScore), height: Math.max(0, this.yScale(0) - this.yScale(d.avgScore)), width: Math.max(0, this.xScale.bandwidth() - 10), })); } @action mountElements(el) { this.width = el.clientWidth; this.height = el.clientHeight; const $el = d3.select(el); $el.select('.y-axis').call(this.yAxis); $el.select('.gridlines').call(this.yGridlines); $el.select('.x-axis').call(this.xAxis); } } .bar-chart { width: 100%; height: 100%; overflow: visible; } .bar-chart .x-axis text, .bar-chart .y-axis text { text-anchor: end; fill: currentColor; } .bar-chart .gridlines line { stroke-opacity: 0.1; } .bar-chart .y-axis .domain, .bar-chart .gridlines .domain { display: none; } .bar-chart .bars { fill: #e74500; } .bar-chart .x-axis text { transform: translate(-5px) rotate(-45deg); font-size: 16px; } Just D3 Patterns D3 + Ember Patterns